> ## Content Index
> Fetch the complete content index at: https://blog.afi.io/llms.txt
> Use this file to discover other available public pages before exploring further.
# Add data to Google Maps with data driven styling
- URL: https://blog.afi.io/blog/add-data-to-google-maps-with-data-driven-styling/
- Published: 2026-07-02T07:17:17.000Z
- Updated: 2026-08-21T05:08:49.000Z
- Description: Learn how to style Google Maps with your own data using data driven styling for datasets. Upload data, set styling rules, and render custom maps.
- Author: Afian Anwar
- Tags: googlemaps
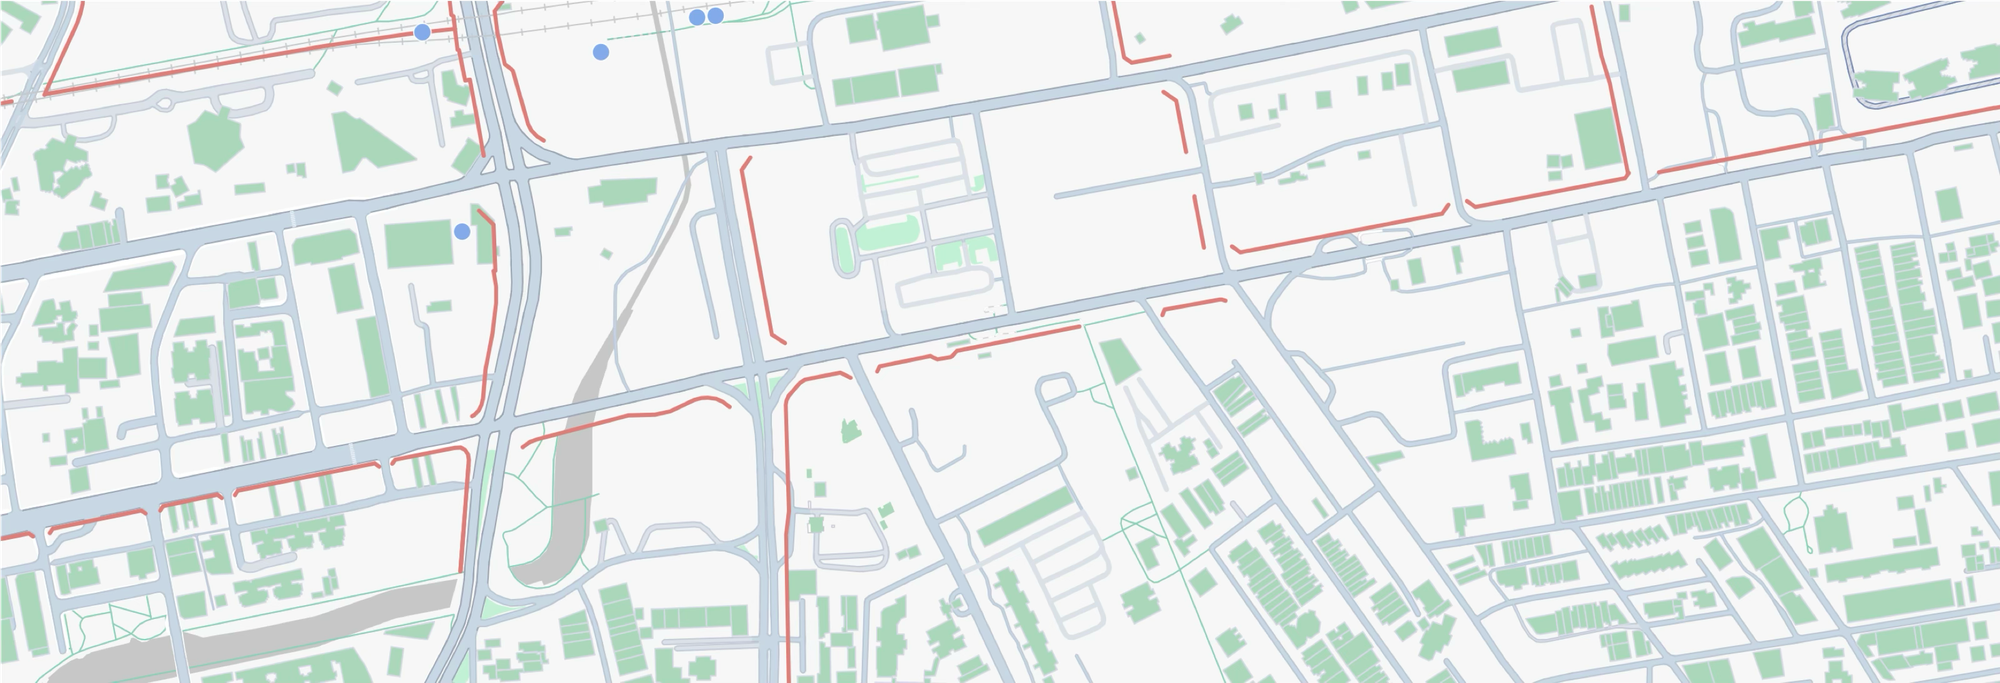
[Data driven styling for datasets](https://developers.google.com/maps/documentation/javascript/dds-datasets/overview?ref=blog.afi.io) lets you upload your own geospatial data to Google Maps and style it however you like. Unlike [data driven styling for boundaries](https://developers.google.com/maps/documentation/javascript/dds-boundaries/overview?ref=blog.afi.io), which only works with the administrative boundaries Google curates, data driven styling for datasets accepts any geometry you bring (points, lines, and polygons) so you can turn raw location data into interactive, insightful map visualizations. In this post, we'll put it to work by building a [cycling guide for Singapore](https://cycling-in-singapore.afi.dev/?ref=blog.afi.io) that puts the city's bike racks, bike lanes, and buildings on a Google Map. This tutorial is not technically demanding, but it does require familiarity with the [Google Cloud Console](http://console.cloud.google.com/?ref=blog.afi.io) and [React](https://react.dev/?ref=blog.afi.io).
Part 1: [Style a Google Map any way you want](https://blog.afi.io/blog/style-a-google-map-any-way-you-want/)
Part 2: [Apply styles for Google Maps using JSON style arrays](https://blog.afi.io/blog/apply-styles-for-google-maps-using-json-style-arrays/)
Part 3: [Cloud based map styling for Google Maps](https://blog.afi.io/blog/cloud-based-map-styling-for-google-maps/)
Part 4: [Google Maps data driven styling for boundaries](https://blog.afi.io/blog/google-maps-data-driven-styling-for-boundaries/)
Part 5: [Create a heatmap in Google Maps with data driven styling](https://www.afi.io/blog/create-a-heatmap-in-google-maps-with-data-driven-styling/?ref=blog.afi.io)
Part 6: [Upload and style datasets using the Maps Datasets API](https://www.afi.io/blog/upload-and-style-datasets-using-the-maps-datasets-api/?ref=blog.afi.io)
**Part 7: Add data to Google Maps with data driven styling (this article)**
[Cycling in SingaporeUsing Google data driven styling for datasets to map bike racks and bike lanes in Singapore](https://cycling-in-singapore.afi.dev/?ref=blog.afi.io)
### What is Google Maps data driven styling for datasets?
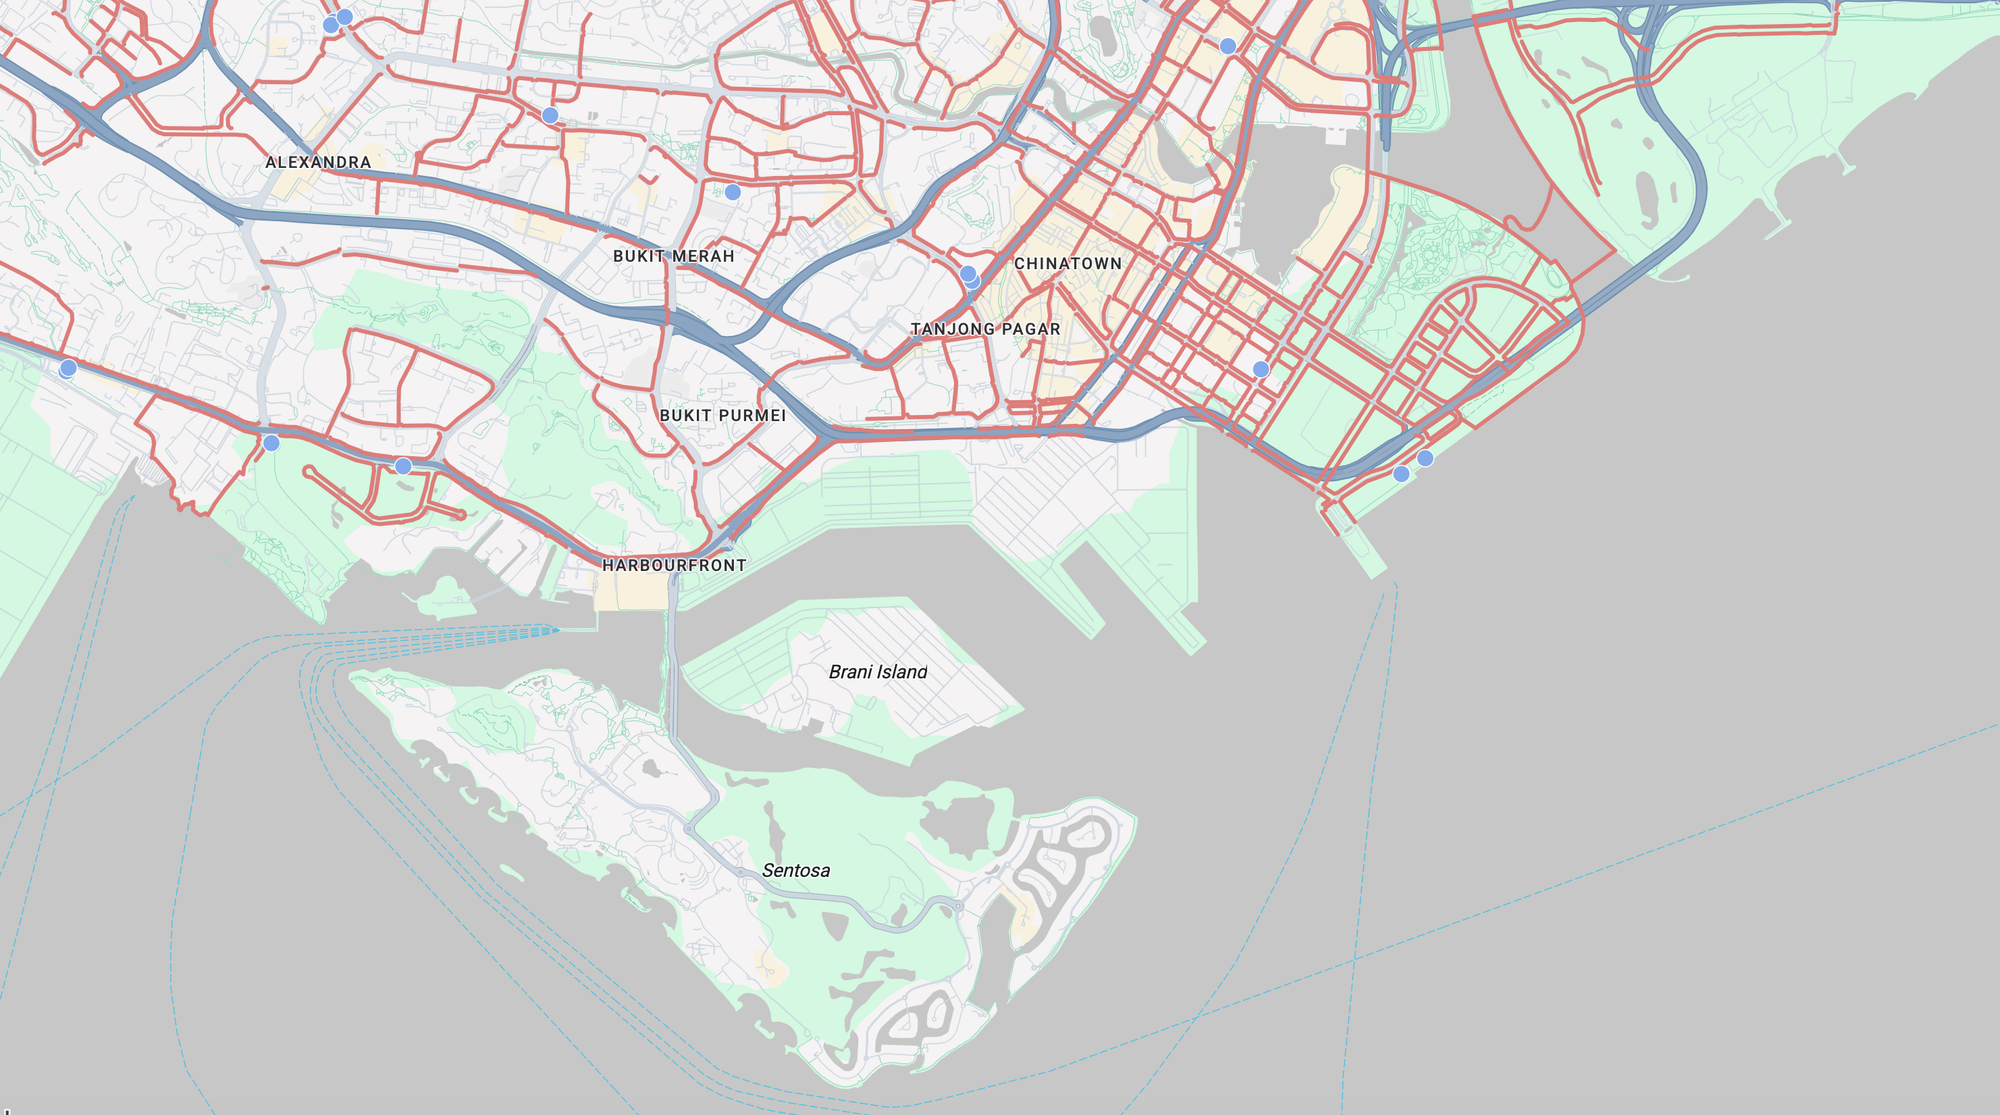
Google Maps data driven styling for datasets lets you style features based on data
Data driven styling for datasets is an easy to use, high performance way to visualize your own data on Google Maps. It's easy to use because you simply upload your data to the Google Cloud console. No custom overlays or client side preprocessing required. Several formats are supported, including GeoJSON, CSV, and KML.
It's performant because the heavy lifting happens server side. Once your dataset is attached to a map style and a vector Map ID, Google bakes each feature (its geometry plus its data attributes) directly into the vector tiles it serves. As those tiles load, a feature style function tells the renderer how to paint each feature, and the rendering itself runs through WebGL on the GPU. Every polygon becomes a triangulated mesh the graphics card fills in parallel, so the map stays fast and responsive even as users pan and zoom.
### Google Maps data driven styling for datasets worked example
The easiest way to understand data driven styling for datasets is to build something with it. Inspired by Google's official demo, [Cycling in Seattle](https://storage.googleapis.com/gmp-maps-demos/data-driven-styling-datasets/index.html?ref=blog.afi.io#/visualize-datasets), we'll build a similar app, one that maps the cycling infrastructure of Singapore, where I'm originally from. I love to bike, but I've never done it in Singapore. My impression was that the infrastructure there wasn't good enough to keep me safe. This project is my way to find out whether that's still true.
In general, adding your own data to Google Maps and styling it takes three main steps:
1. **Create a map style and a vector Map ID** in the Google Cloud console, and associate the style with the Map ID.
2. **Upload your dataset** to the Google Cloud console and bind it to that map style (you can also use the [Maps Datasets API](https://developers.google.com/maps/documentation/datasets/overview?ref=blog.afi.io)).
3. In your app, **add a feature style function** **to your map** that references the dataset and styles its features according to whatever business logic you choose.
### Create a map style and vector Map ID
Creating a map style on the Google Cloud Console
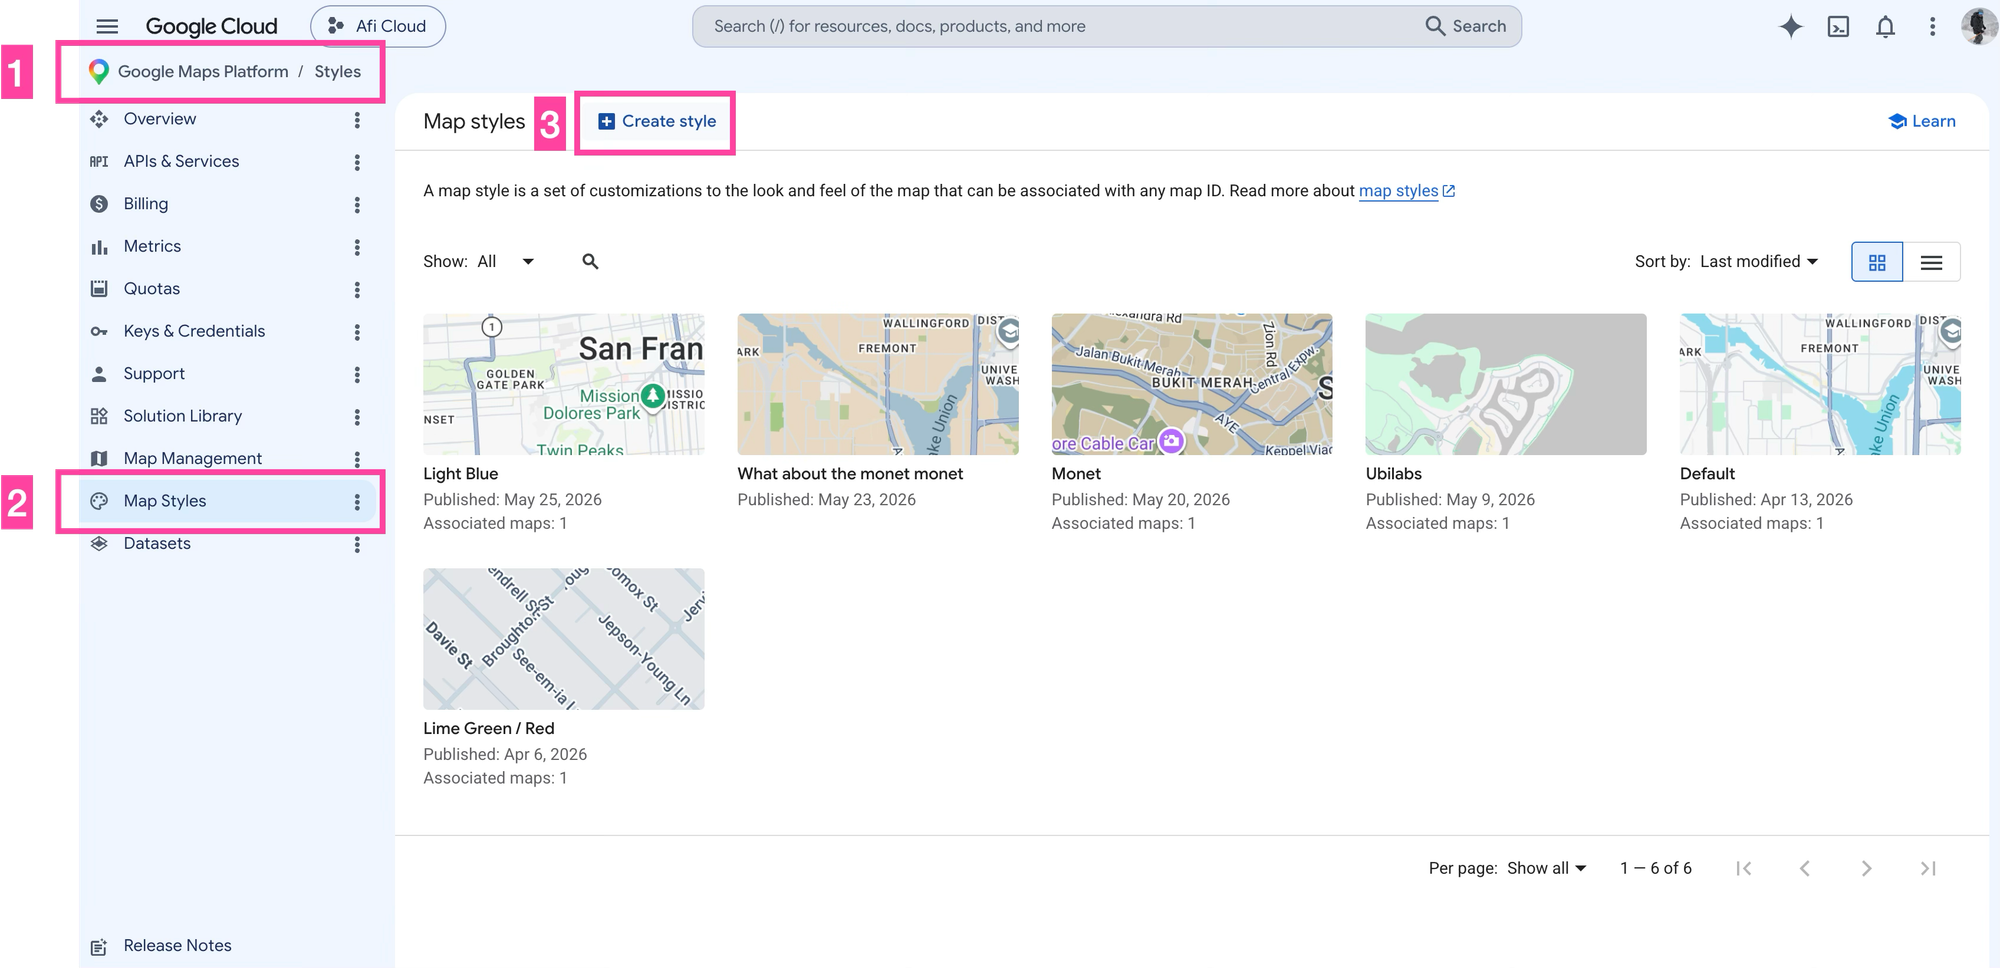
Log into your [Google Cloud Console](http://console.cloud.google.com/?ref=blog.afi.io), choose a Project and select \[Google Maps Platform\], \[Map Styles\] and click on \[+ Create Style\]. Name the style "ubilabs-style" - it's taken directly from the [Cycling in Seattle](https://storage.googleapis.com/gmp-maps-demos/data-driven-styling-datasets/index.html?ref=blog.afi.io#/visualize-datasets) demo built by a creative agency called [Ubilabs](https://ubilabs.com/en?ref=blog.afi.io)), and seed it with the JSON styles array below.
```
{
"variant": "light",
"styles": [
{
"id": "infrastructure",
"label": {
"visible": false
}
},
{
"id": "infrastructure.building",
"geometry": {
"visible": true,
"fillOpacity": 1,
"fillColor": "#a9d7ba"
}
},
{
"id": "infrastructure.building.commercial",
"geometry": {
"visible": false
}
},
{
"id": "infrastructure.building.indoor",
"geometry": {
"visible": false
}
},
{
"id": "infrastructure.transitStation.busStation",
"label": {
"visible": false
}
},
{
"id": "infrastructure.urbanArea",
"geometry": {
"visible": true
}
},
{
"id": "natural.base",
"geometry": {
"visible": true
}
},
{
"id": "natural.water",
"geometry": {
"fillOpacity": 1,
"fillColor": "#c7c7c7"
}
},
{
"id": "pointOfInterest",
"geometry": {
"visible": false
},
"label": {
"visible": false
}
},
{
"id": "pointOfInterest.landmark",
"label": {
"visible": false
}
},
{
"id": "pointOfInterest.other",
"geometry": {
"visible": true
}
}
]
}
```
This gives you a modern looking map with muted grays and greens.
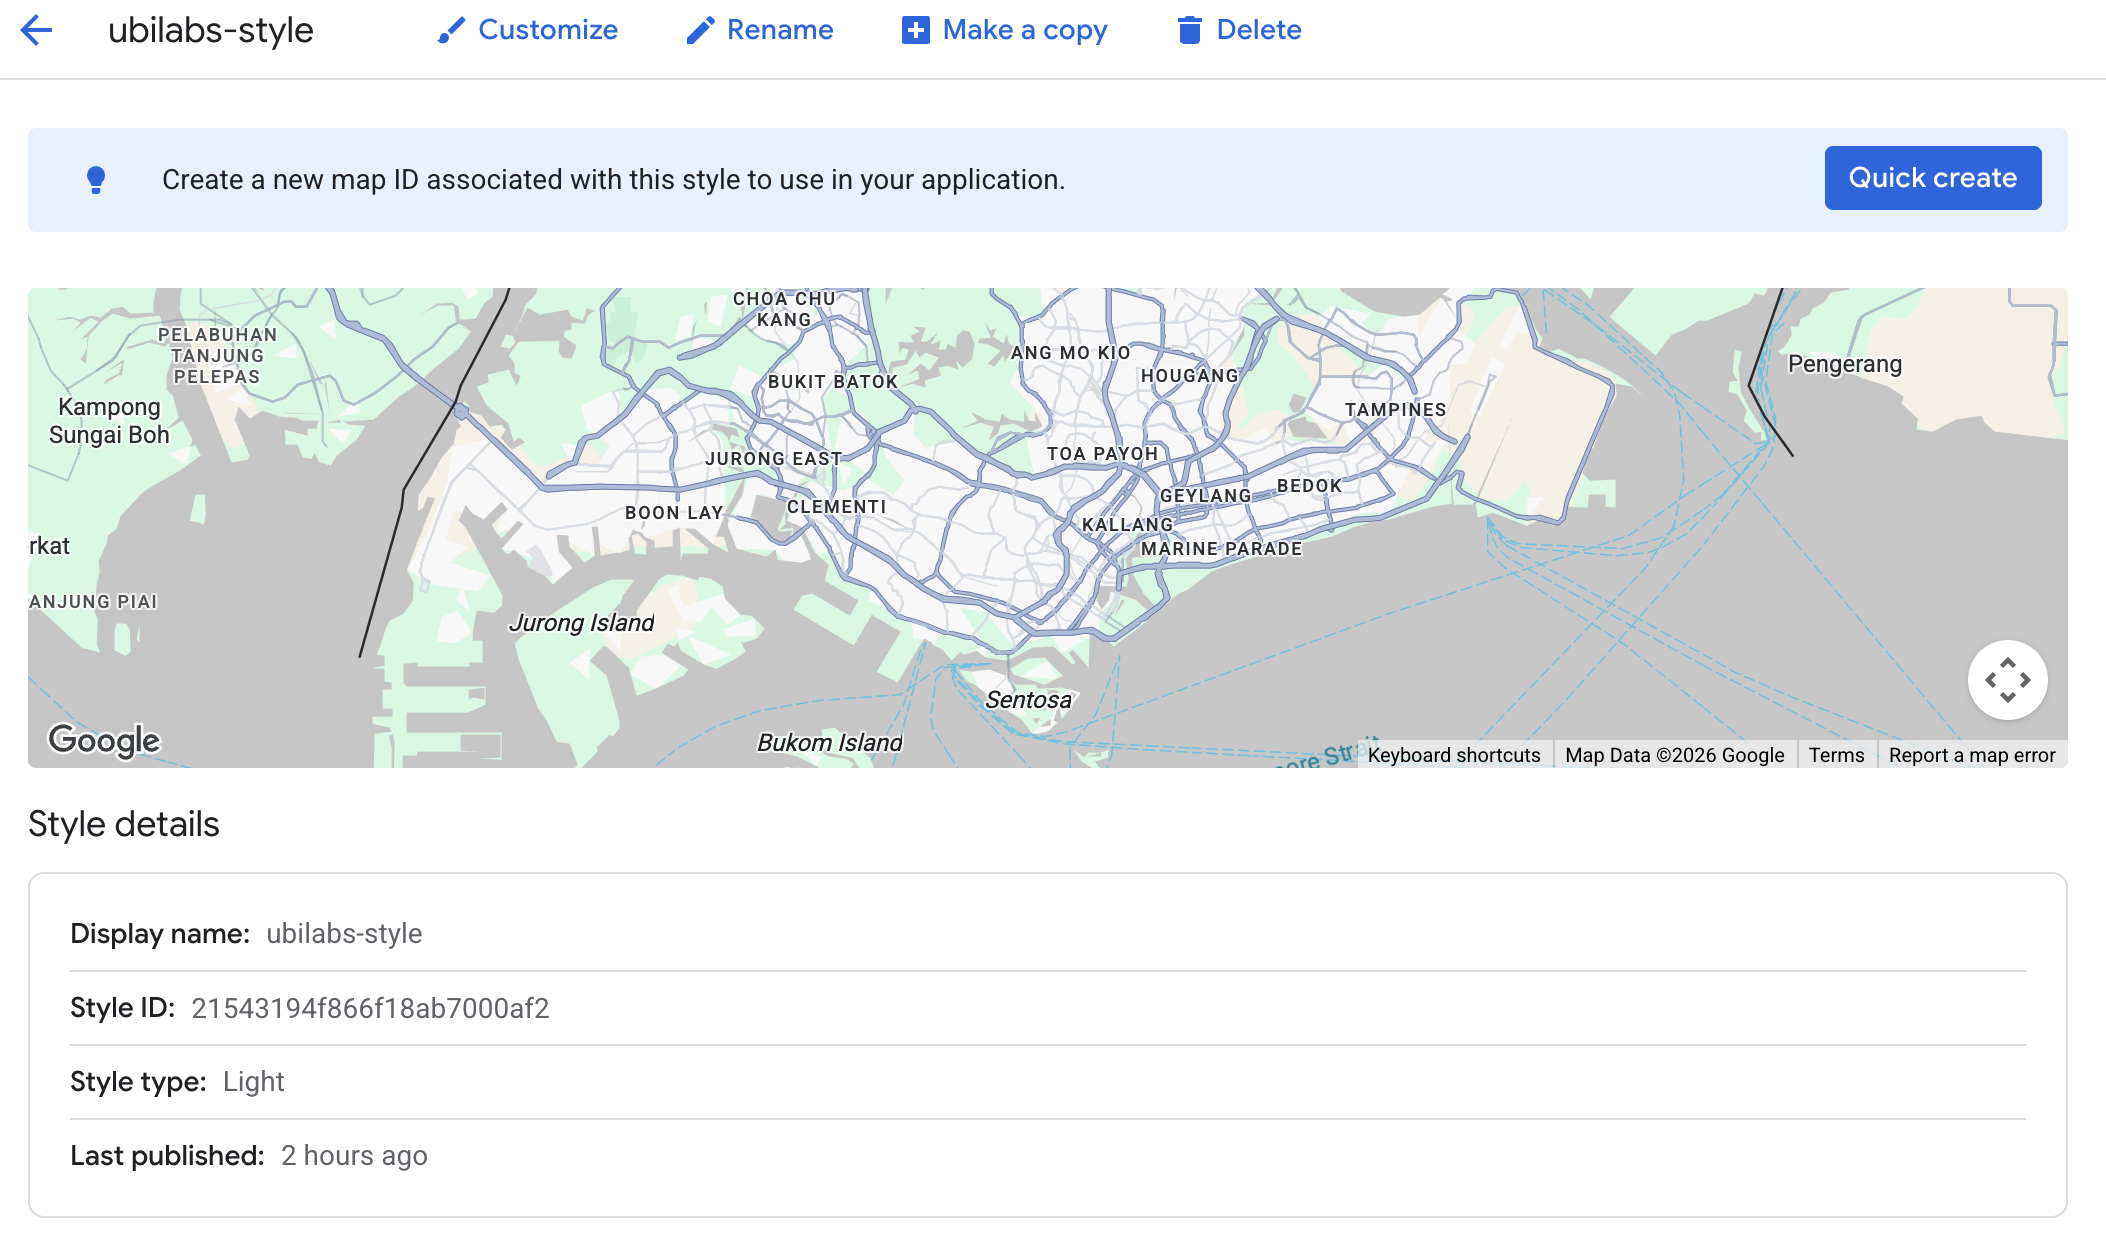
Associating a Map ID with a map style on the Google Cloud Console
Now create a new Map ID by going to \[Google Maps Platform\], \[Map Management\] and click on \[+ Create Map ID\].
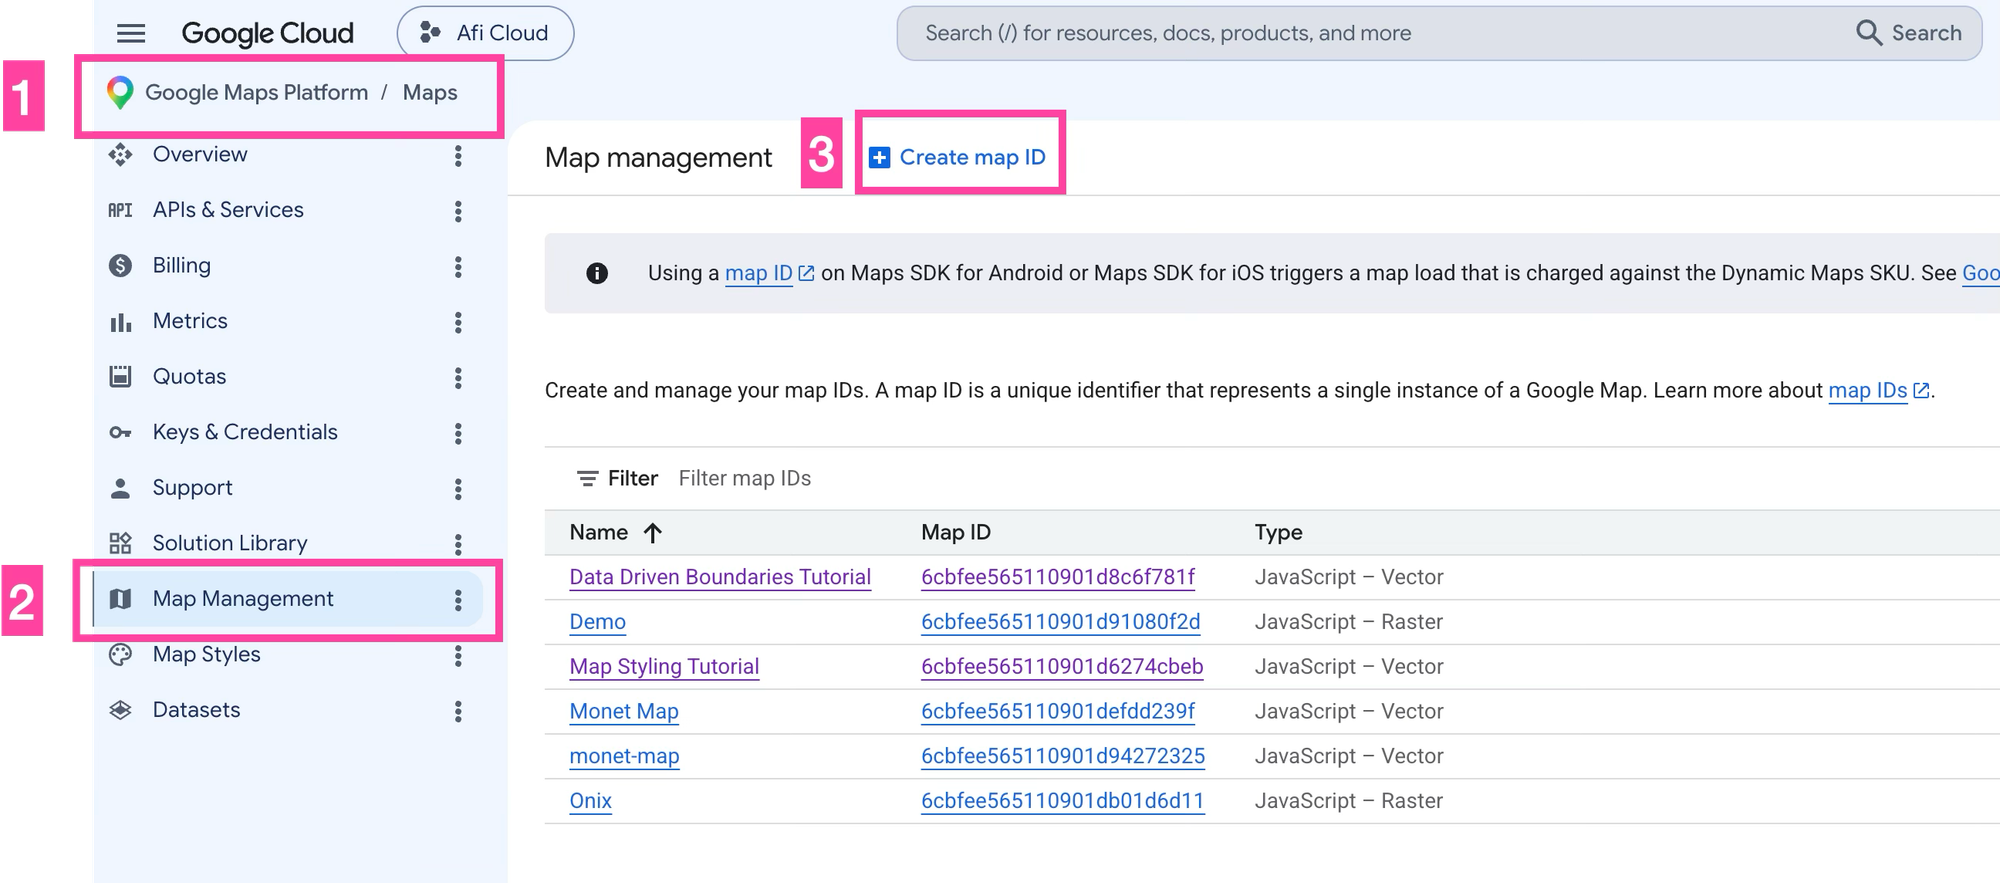
Creating a new Map ID on the Google Cloud Console
Give it a descriptive name e.g. "Cycling in Singapore" and make sure that its a Javascript **vector** map.
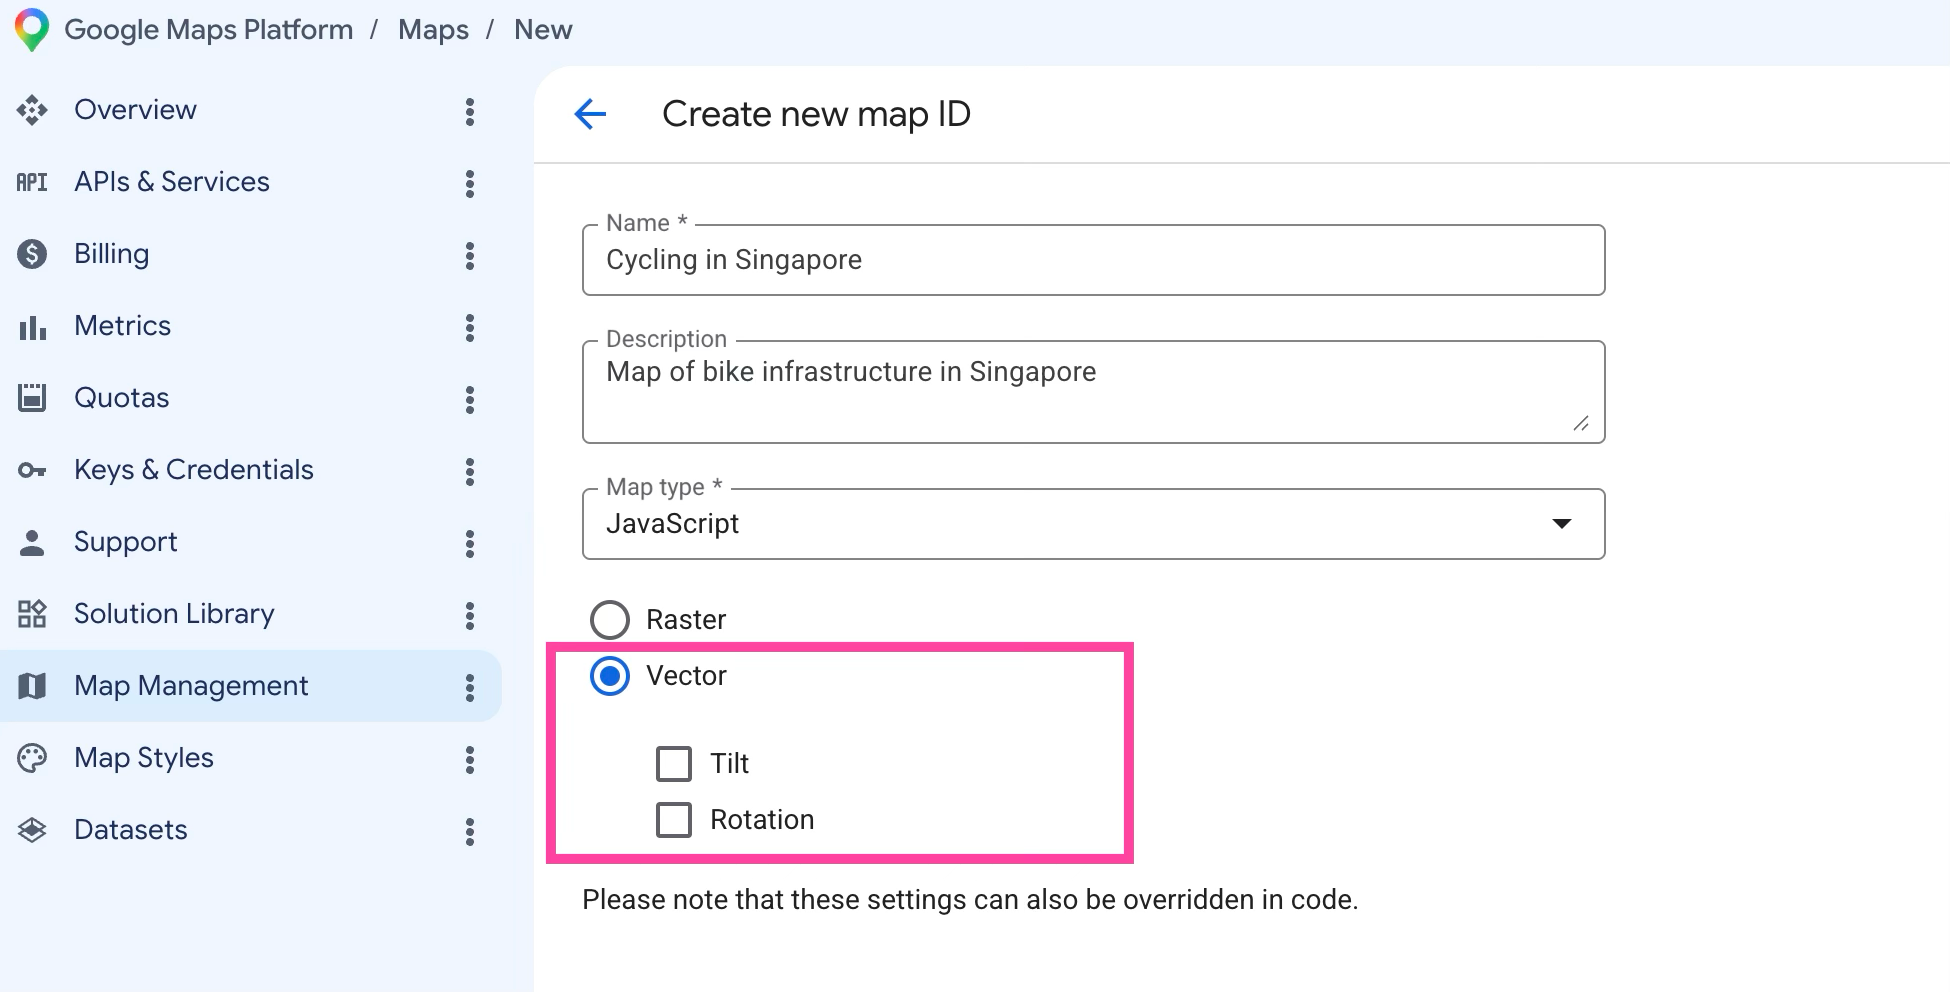
Selecting a vector map as map type
Take note of the Map ID. We'll use it later in our app.
### Upload your dataset
Next, we'll upload our datasets to the [Google Cloud console](https://console.cloud.google.com/?ref=blog.afi.io). Since I want to understand Singapore's cycling infrastructure, I'll start with two layers: where bike racks sit and where bike lanes run.
Conveniently, Singapore's tidy division of responsibilities makes the data easy to source. Bike racks fall under the national transit agency, the [Land Transportation Authority](https://www.lta.gov.sg/content/ltagov/en.html?ref=blog.afi.io) (LTA) because they are typically installed near bus stops and train stations, while bike lanes are the domain of the national planning agency, the [Urban Redevelopment Authority](https://www.ura.gov.sg/?ref=blog.afi.io) (URA). Both agencies publish their data on the [Open Data Portal](https://data.gov.sg/?ref=blog.afi.io), built by [Open Government Products](https://www.open.gov.sg/?ref=blog.afi.io), an experimental team that develops technology for the Singapore government.
[LTABicycleRackGEOJSON.geojsonGoogle Docs](https://drive.google.com/file/d/18ArVCNm3cFTYgl8ZCNBUMVmuvwVCvPXp/view?usp=sharing&ref=blog.afi.io)
[URACyclingPathsGEOJSON.geojsonGoogle Docs](https://drive.google.com/file/d/1368QWo0SYkWyPm-pTP42gkn-muT6QLsj/view?usp=sharing&ref=blog.afi.io)
Download `LTABicycleRackGEOJSON.geojson` and `URACyclingPathsGEOJSON.geojson` to your computer and then navigate to \[Google Maps Platform\], \[Datasets\] and click on \[+ Create Dataset\].
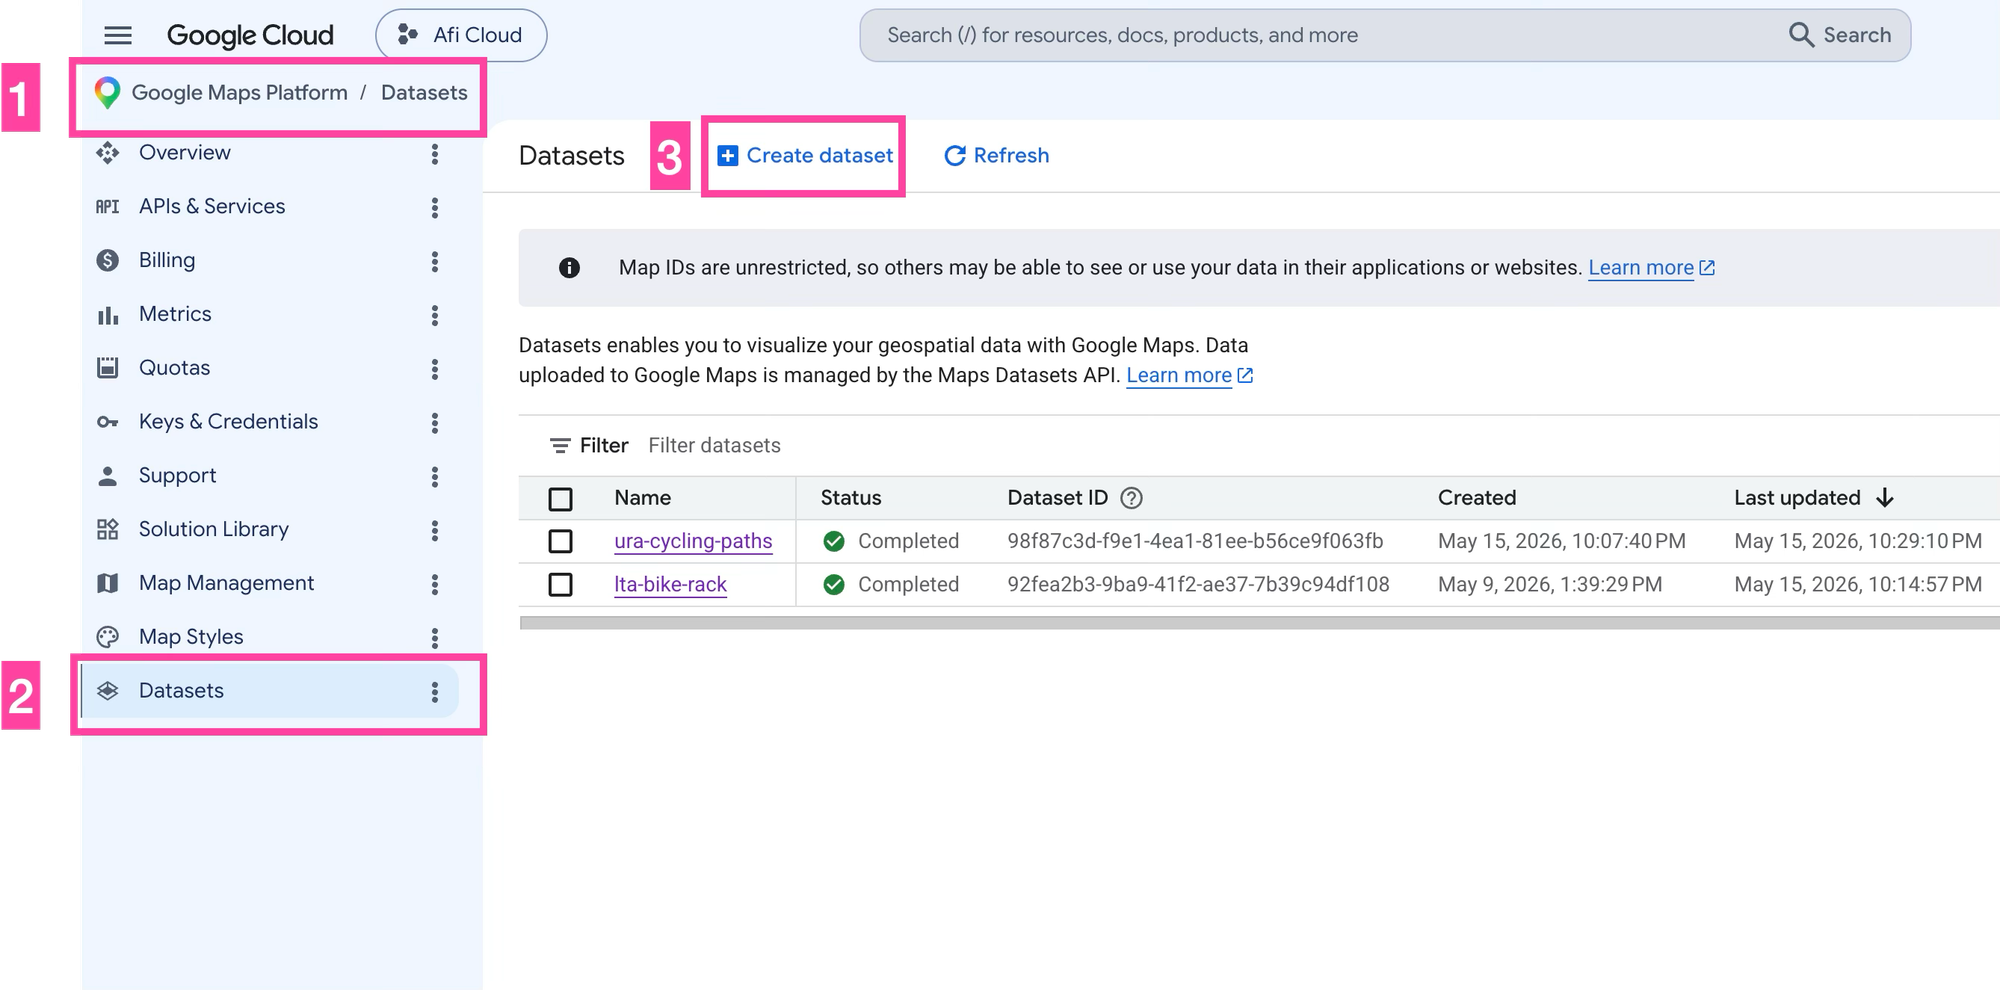
Creating a dataset and uploading it to the Google Cloud Console
Give your dataset a descriptive name (I used `lta-bike-racks` and `ura-cycling-paths` for the bike rack and bike lane data files) and upload the respective files from your computer. If this was done correctly, you should see the datasets listed in the Datasets section. The most important piece of information is the Dataset ID, which we'll use later on to reference the dataset in our code.
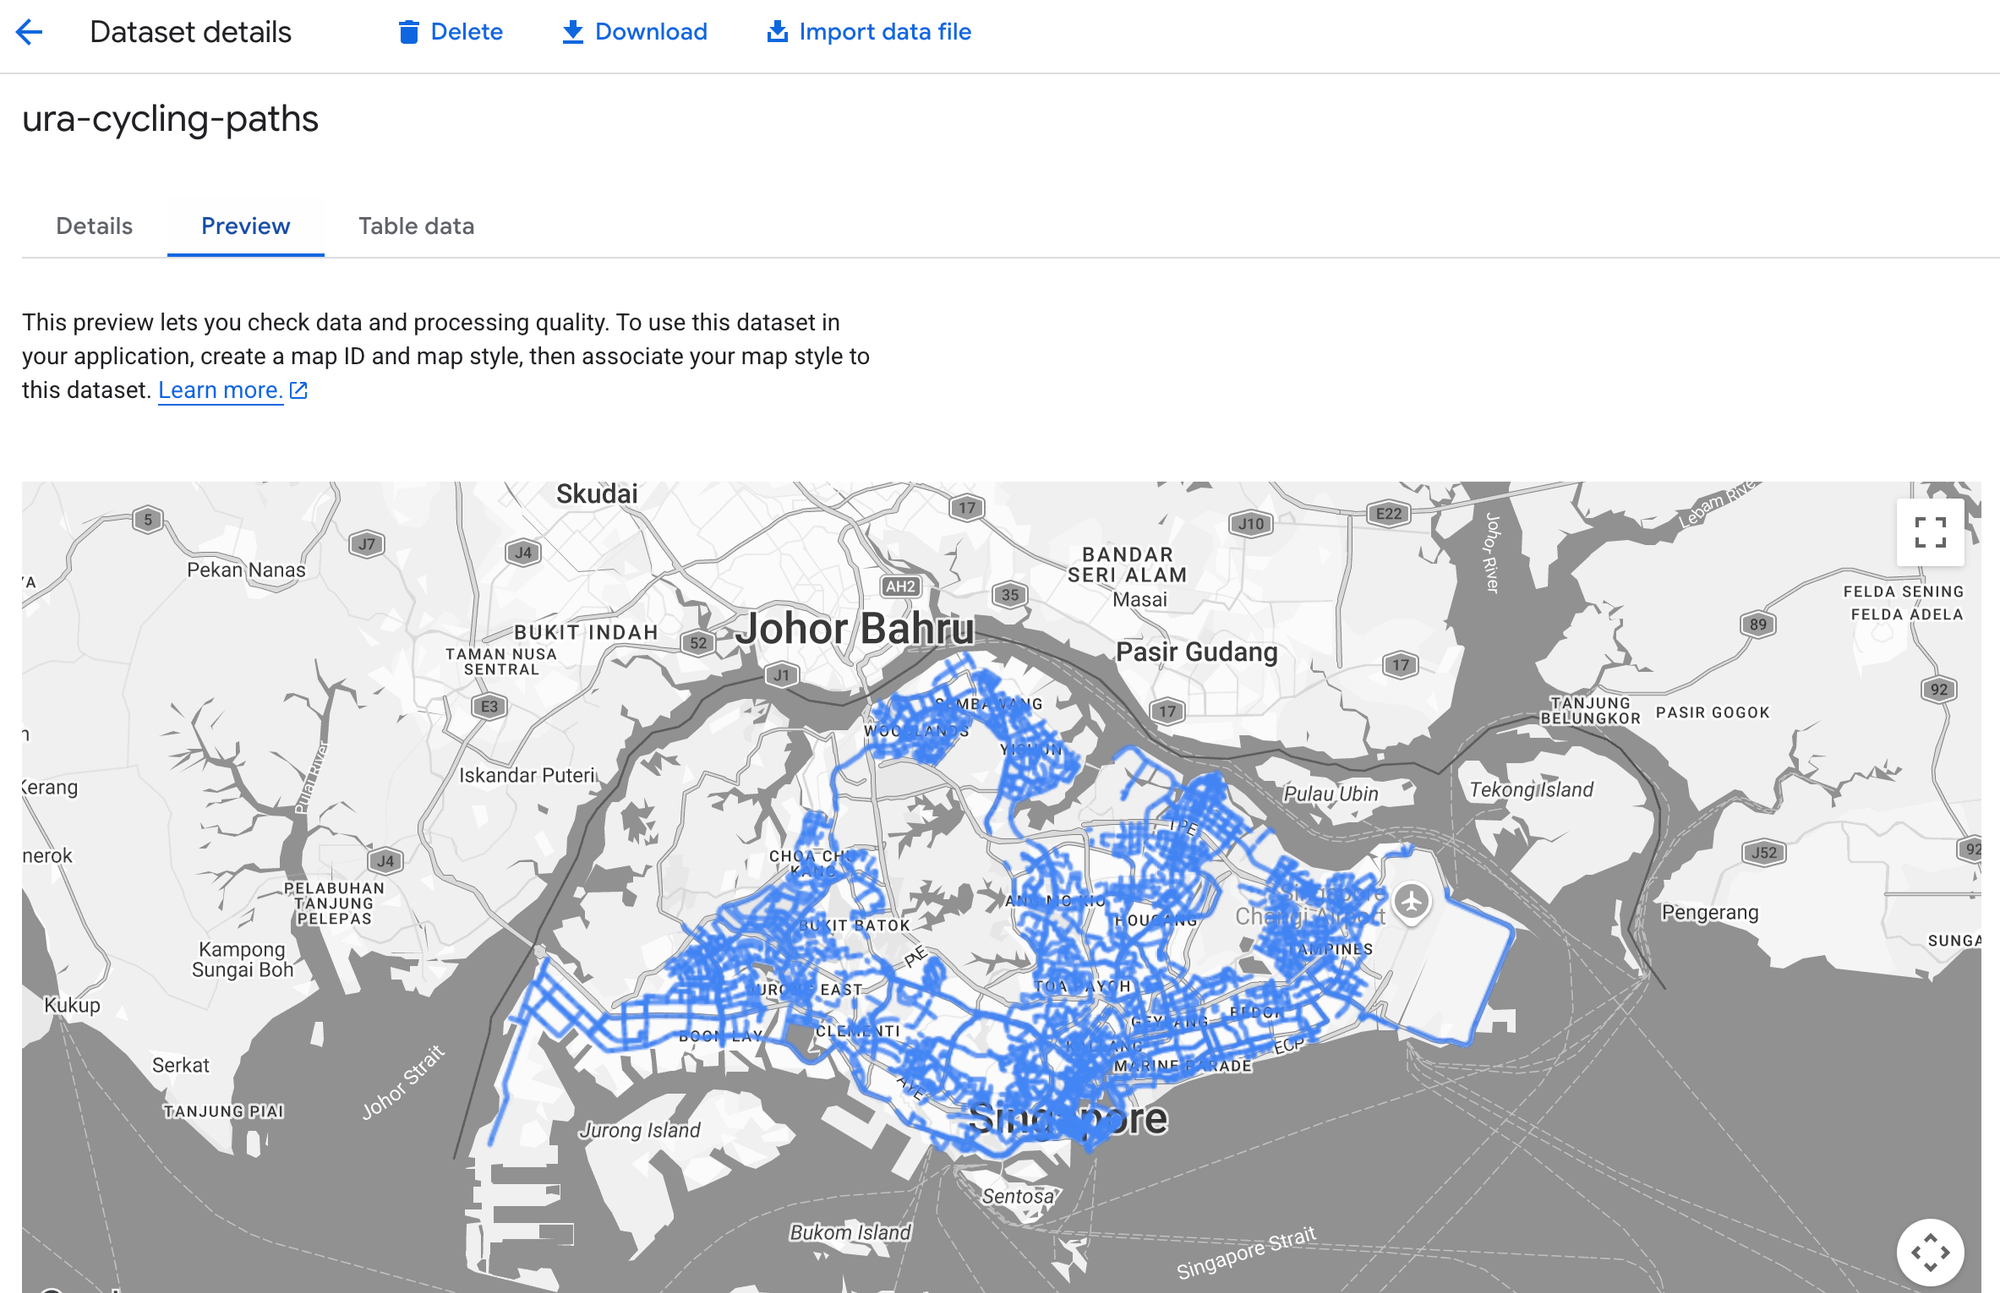
Using the preview tab to view the dataset uploaded to the Google Cloud Console
If you click on the dataset name and select the \[Preview\] tab, you'll be able to see what the data looks like on a map.
A quick note - data uploaded to the Cloud Console needs to meet a few requirements:
1. It has to be in GeoJSON, CSV, or KML format,
2. Has a file size no larger than 500 MB (split up your data into multiple files if you exceed this limit),
3. And the display name you give the dataset has to be unique within your Google Cloud project.
Finally, we need to link our dataset to the map style created earlier, and associate the style with a Map ID. If any of these steps are done incorrectly your data won't show up.
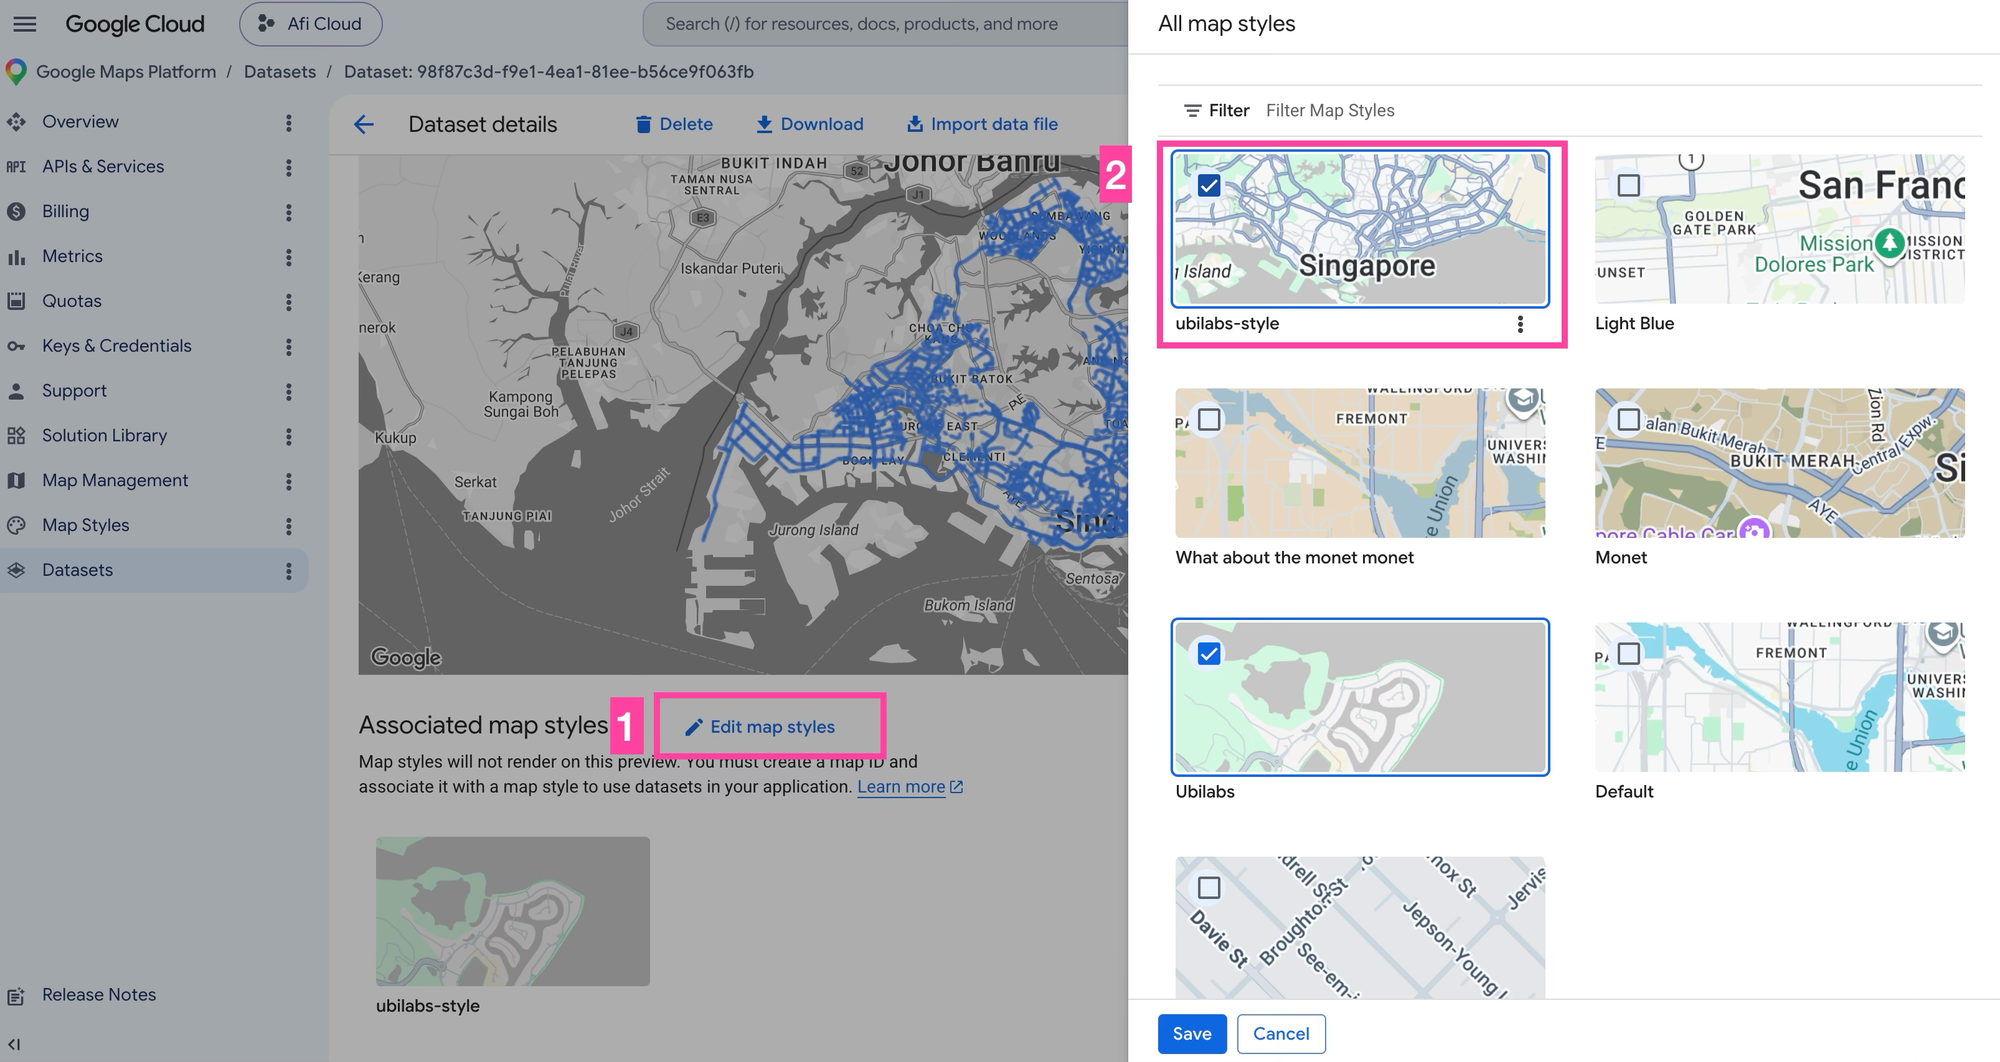
Linking the map style to the dataset
Click on the dataset name, select the \[Preview\] tab and scroll down until you see the "Associated map styles" heading. Select \[Edit Map Styles\] and choose the style you want to associate the dataset with. In our case, select the `ubilabs-style` we created earlier and hit \[Save\].
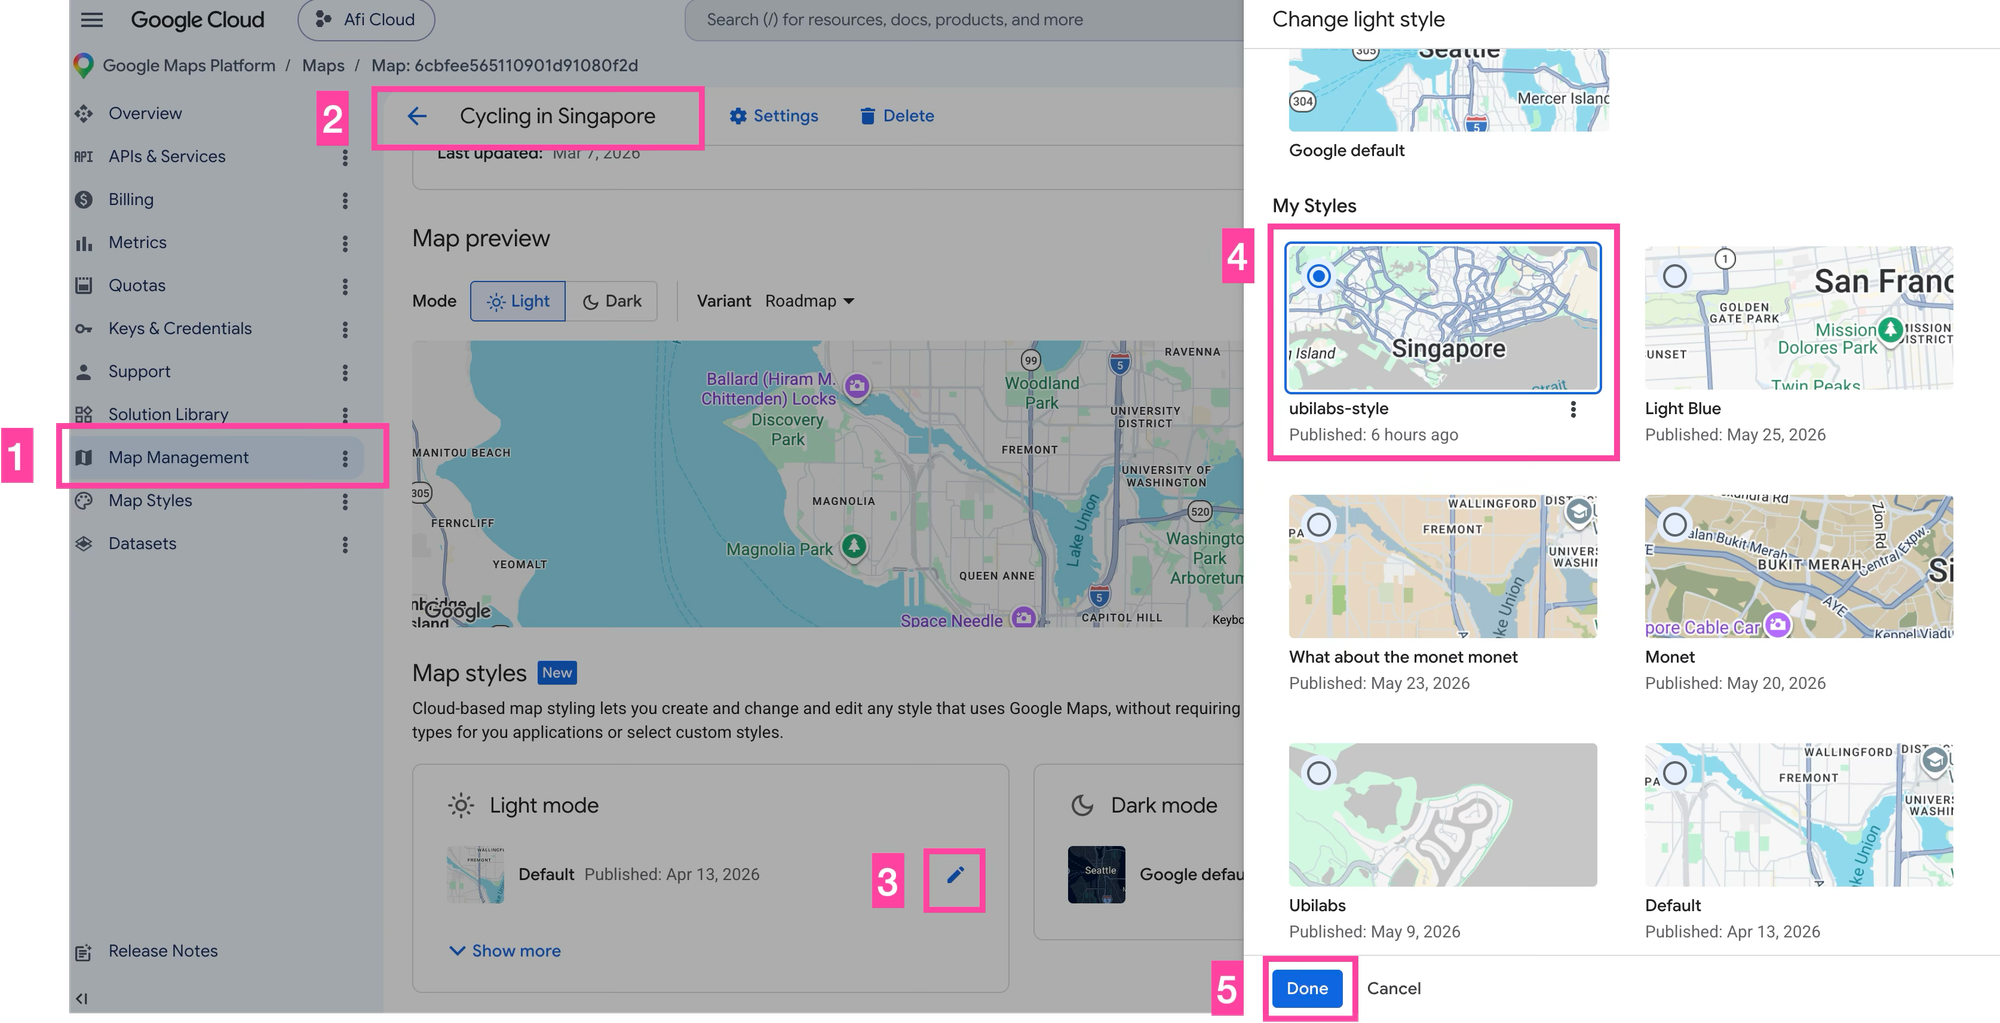
Lining the Map ID to the map style with the attached dataset
Finally, we need to associated the `ubilabs-style` map style with the "Cycling in Singapore" map. Return to the \[Map Management\] section, click on the Map ID created earlier and scroll down until you find the "Light mode" section. Click the \[✏️\] icon and choose the `ubilabs-style` created earlier. Click \[Done\] to save that style to the map. Now, the style we chose will automatically be applied to the Google Map when we reference that Map ID in our code.
### Add a feature style function to your map
With the Map ID and data set up, the last step is to render everything on a map. I've covered the fundamentals in earlier posts ([applying Cloud-based styling to a Google Map](https://blog.afi.io/blog/cloud-based-map-styling-for-google-maps/) and [styling map features with data-driven styling](https://blog.afi.io/blog/google-maps-data-driven-styling-for-boundaries/)) so here I'll focus on the part that's specific to data driven styling for datasets: pulling the data you uploaded to the Cloud Console and styling it.
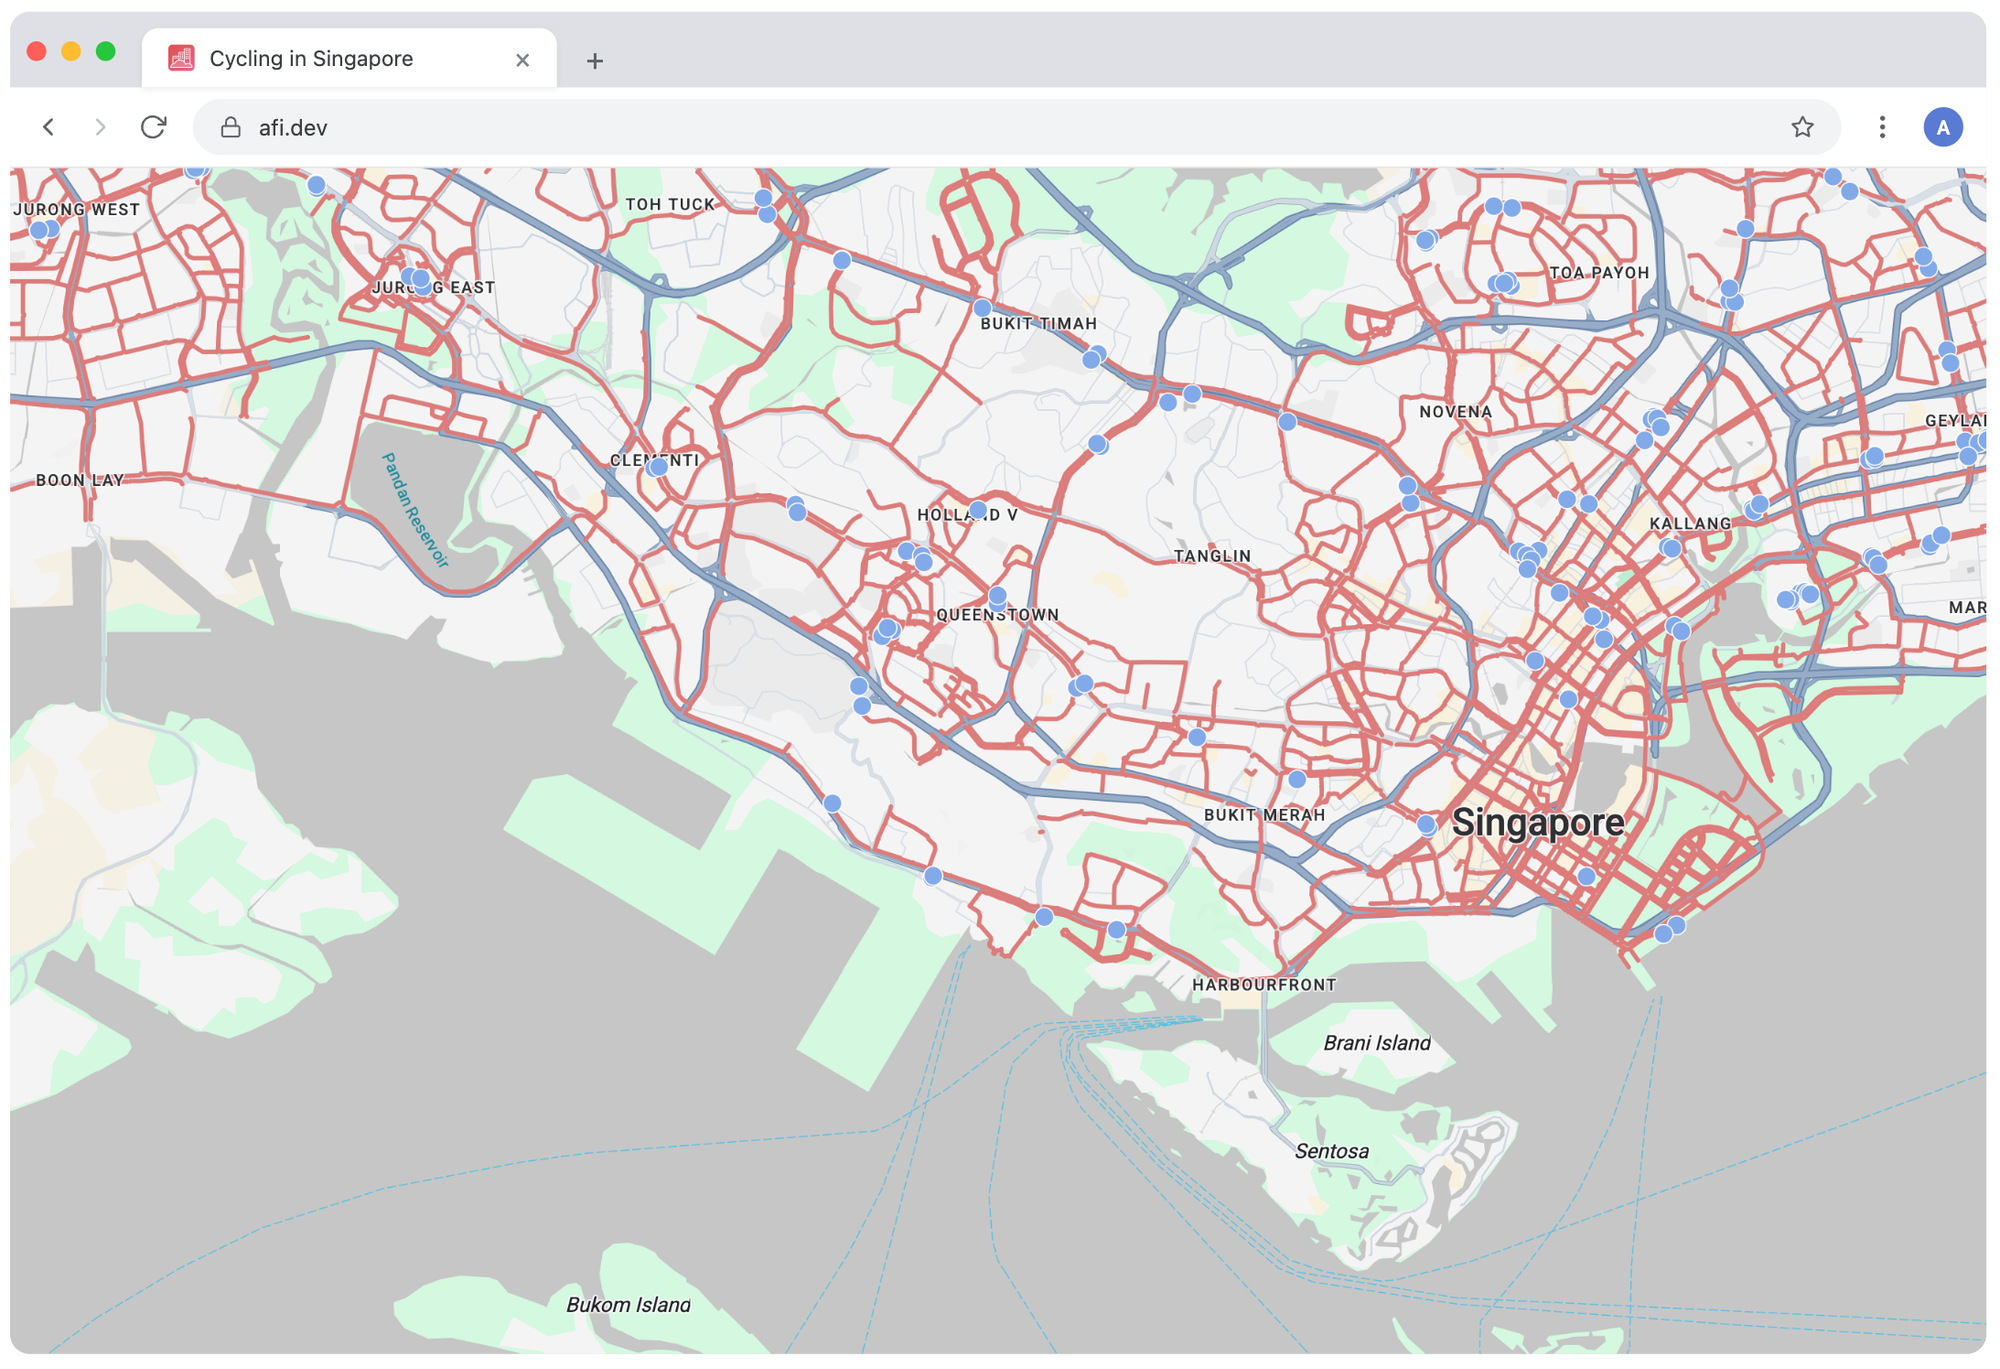
Adding a feature style function to the Google Map
The [Cycling in Singapore ](https://cycling-in-singapore.afi.dev/?ref=blog.afi.io)app is built with React and uses the [@vis.gl/react-google-maps](https://visgl.github.io/react-google-maps/?ref=blog.afi.io) library to render the map and handle click interactions. Bicycle racks show up as blue circles and bike lanes as red paths.
The best way to follow along is to work through the snippets below until each one makes sense, then fork the [google\_maps\_data\_styling\_datasets](https://github.com/afilabs/google%5Fmaps%5Fdata%5Fstyling%5Fdatasets/?ref=blog.afi.io) repo and experiment. Tweak how the data is styled and watch what changes on the map. From there, you can use the code as a template for your own data driven maps.
**App.jsx**
`App.jsx` is the root component of our React app. It wraps everything in an ``, which loads the Google Maps JavaScript API and supplies your API key and renders the `` along with the two data layers,`` and ``. Because data driven styling only works on vector maps, the `` must be given a `mapId` that points to the vector map style we created in the Cloud console.
```
/*** App.jsx ***/
import {APIProvider} from '@vis.gl/react-google-maps';
import {Map} from '@vis.gl/react-google-maps';
import { useCallback } from 'react';
import BikeRackDatasetLayer from './BikeRackDatasetLayer';
import CyclingPathDatasetLayer from './CyclingPathDatasetLayer';
function App() {
return (
)
}
export default App
```
**BikeRackDatasetLayer.jsx**
`BikeRackDatasetLayer.jsx` a React component whose job is to wire the bike rack dataset layer into the map.
First, we save a reference to the bike rack dataset ID.
```
const BIKE_RACK_DATASET_ID = "92fea2b3-9ba9-41f2-ae37-7b39c94df108";
```
This information can be found in the Datasets section of the Google Cloud Console.
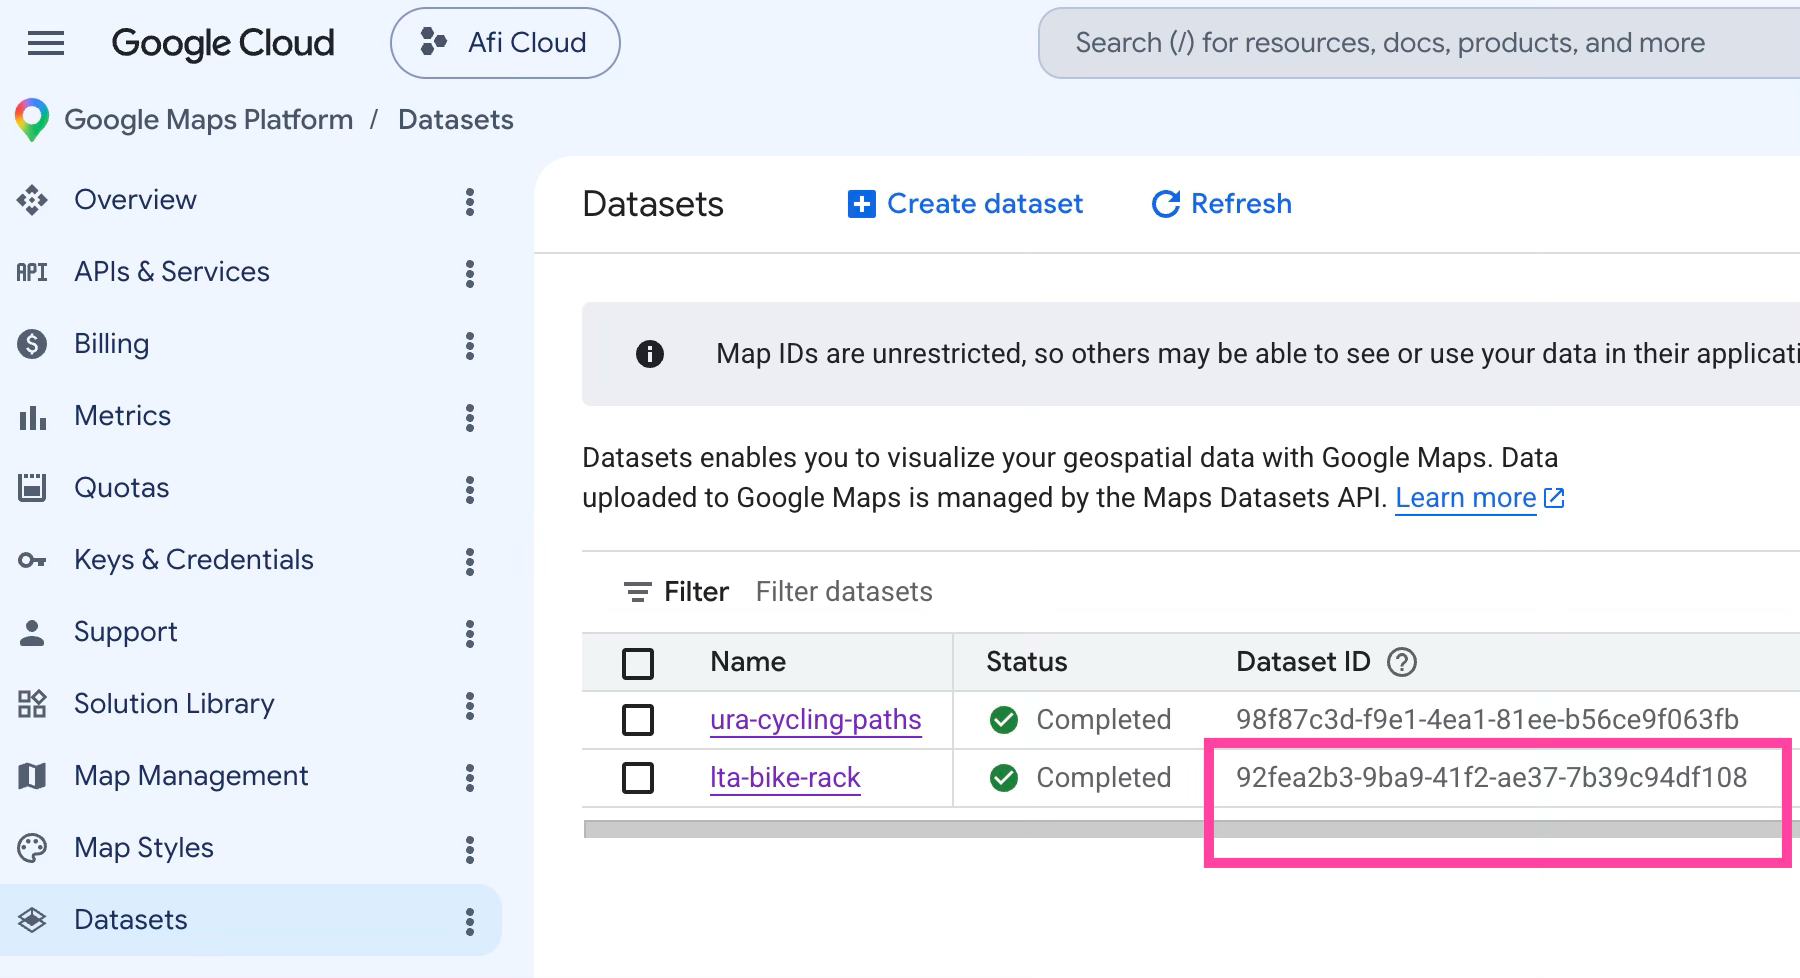
Finding the Dataset ID so that we can reference it in code
Next, we retrieve the dataset feature layer for the bike rack location dataset so that we can style and listen for events on it.
```
/*** BikeRackDatasetLayer.jsx ***/
import { useMap } from "@vis.gl/react-google-maps";
import { useEffect } from "react";
const BIKE_RACK_DATASET_ID = "92fea2b3-9ba9-41f2-ae37-7b39c94df108";
export default function BikeRackDatasetLayer() {
const map = useMap();
useEffect(() => {
if (!map) return;
const layer = map.getDatasetFeatureLayer(BIKE_RACK_DATASET_ID);
//... Feature style function code
//... clickListener code we'll add later
}, [map]);
if (!popup) return null;
return null;
}
```
`map` is the Google Maps instance (here, obtained via the `useMap()` hook from `@vis.gl/react-google-maps`).
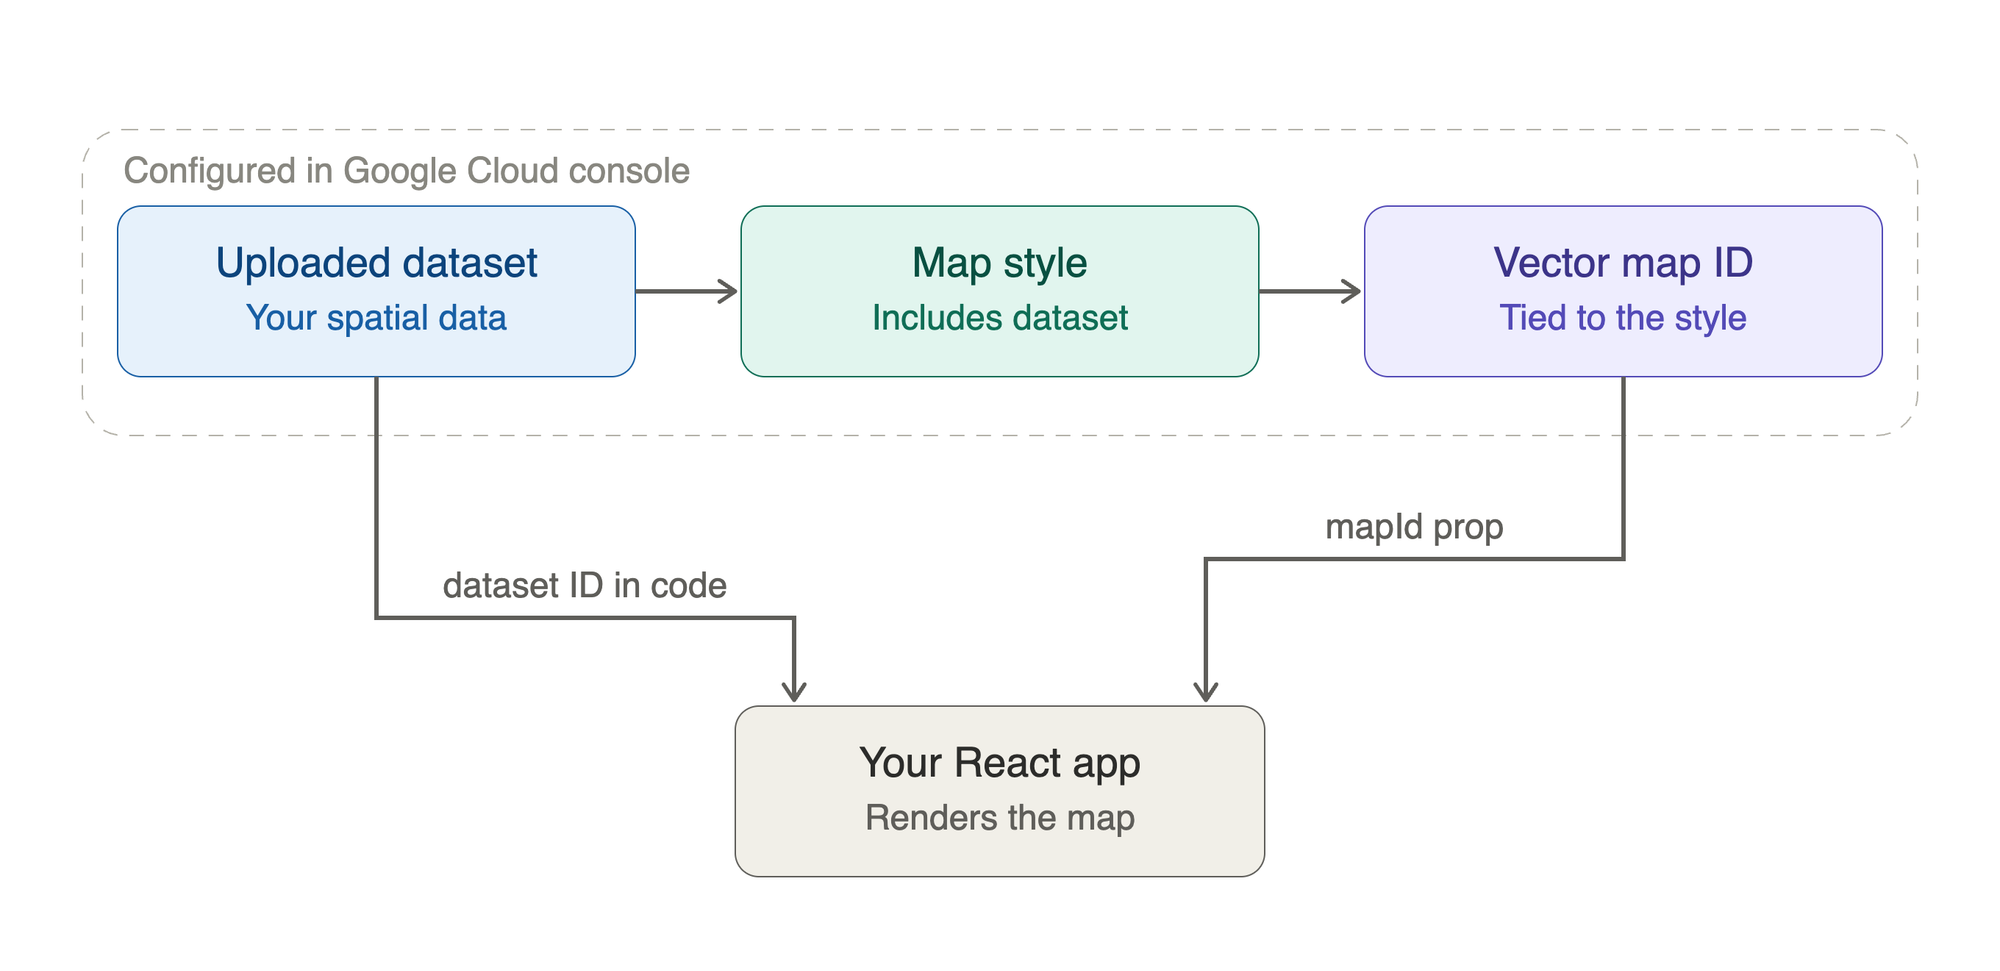
The relationship between datasets, map styles and Map IDs
`map.getDatasetFeatureLayer(BIKE_RACK_DATASET_ID)` returns the `FeatureLayer` for the bike-rack dataset. It can resolve that layer because of the chain you set up earlier: the `lta-bike-rack` dataset is associated with the `ubilabs-style` map style, that style is linked to Map ID `6cbfee565110901d6274cbeb`, and that Map ID is the same one passed to the `` component in `App.jsx`.
So that line of code hands you a `layer` object that represents your bike rack data on this map. That object is the thing you then operate a feature style function on.
```
layer.style = (params) => {
return {
pointRadius: 6,
fillColor: "#83ABEB",
fillOpacity: 1.0,
strokeColor: "#ffffff",
strokeWeight: 0.8,
};
};
```
The visual result is a uniform field of solid sky blue dots, each ringed by a faint white border, every bike rack drawn at the same size and color regardless of its data (I'll show you how to change this later on).
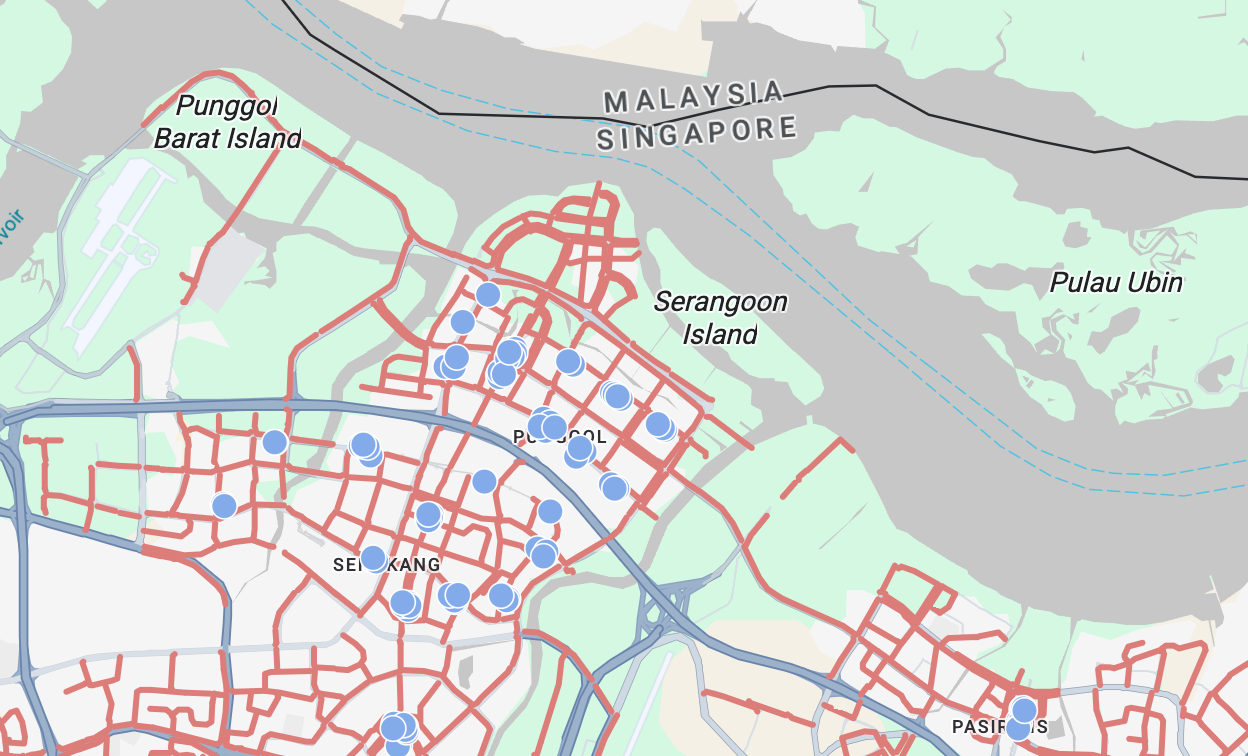
Mapping bike racks in Singapore using LTA data
**CyclingPathDatasetLayer.jsx**
`CyclingPathDatasetLayer.jsx` works very similarly to `BikeRackDatasetLayer.jsx`. The only difference is that the feature style function styles a polyline and not a point marker.
```
layer.style = (params) => {
return {
strokeColor: "#DD7E7A",
strokeWeight: 3.0,
strokeOpacity: 1.0,
};
};
```
This styles the bike lanes as a thick, soft red polyline with full opacity.
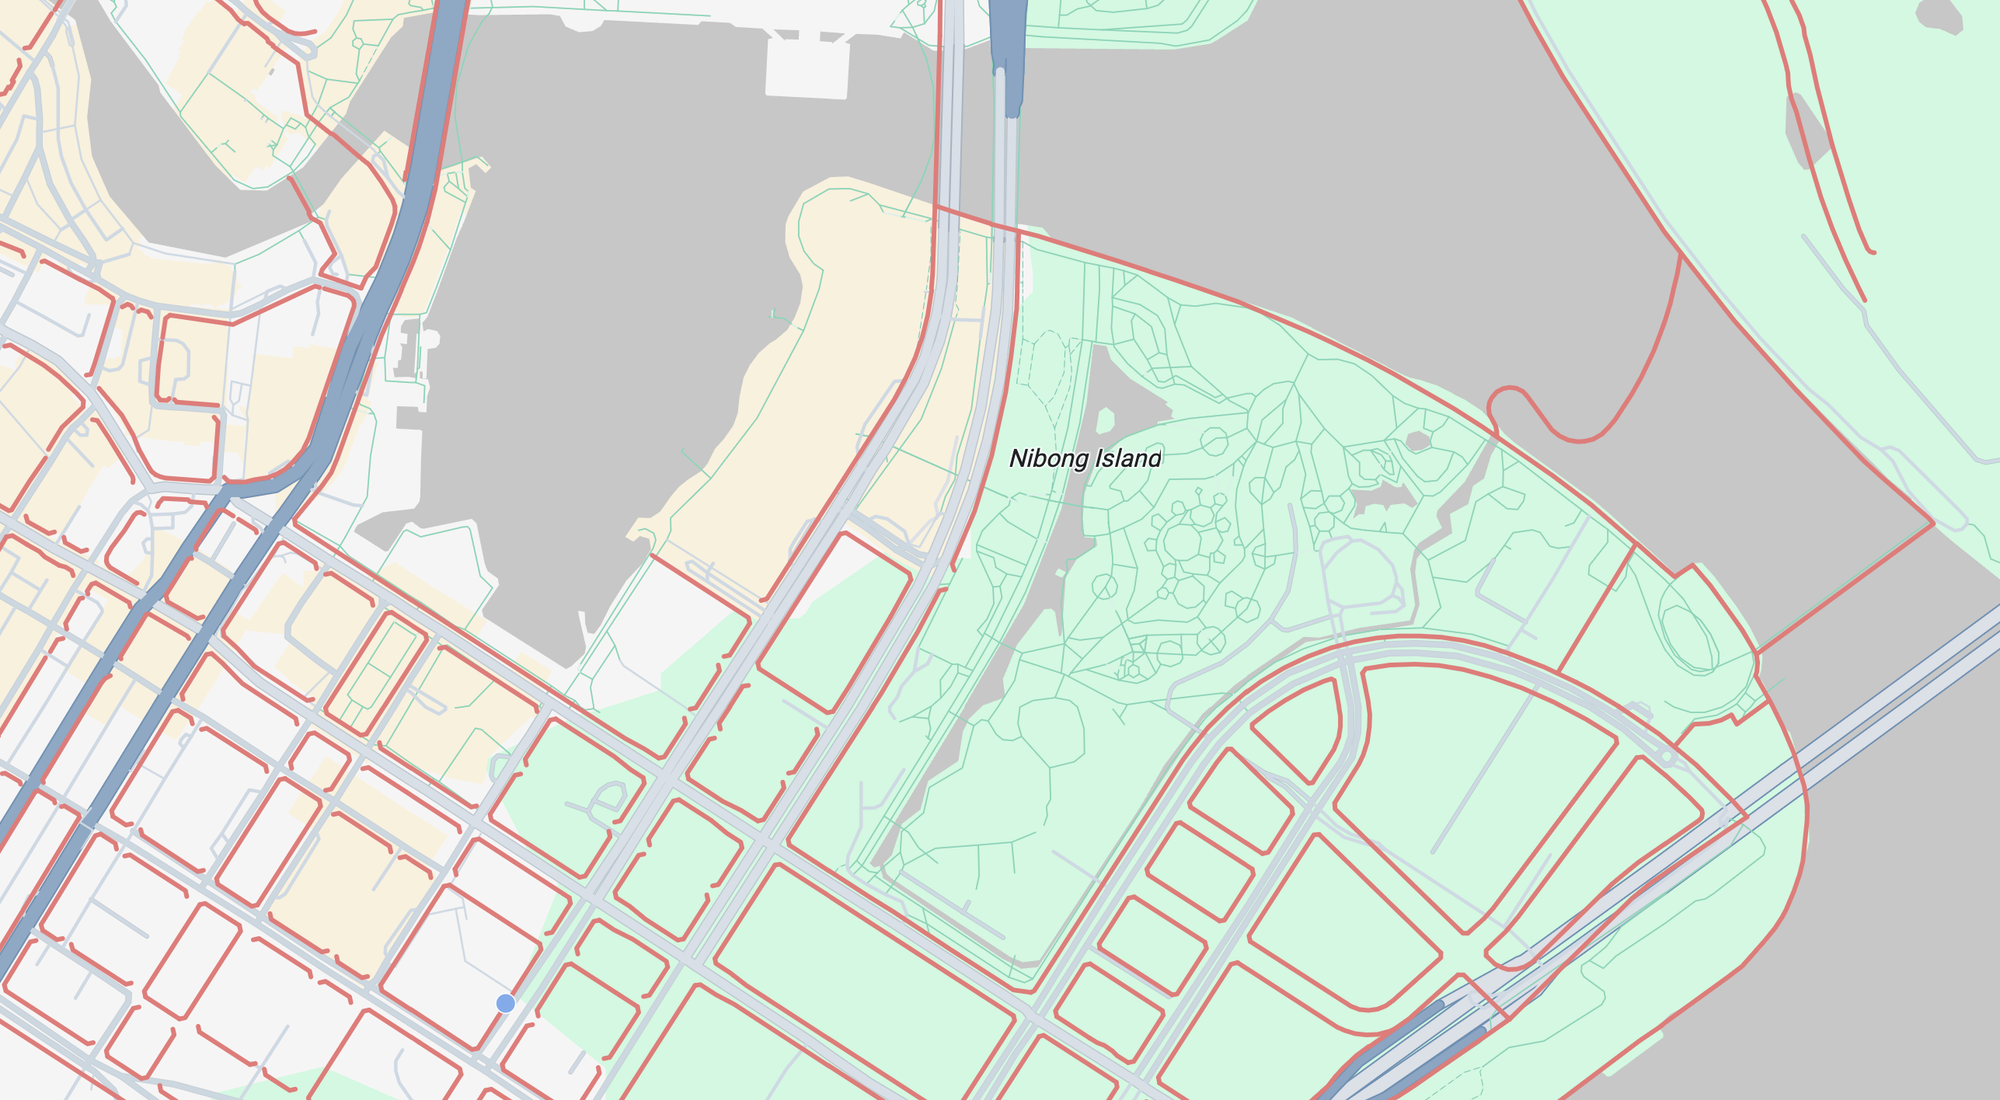
Mapping cycling paths in Singapore using URA data
### Handling click interactions with data driven styling
Like [data driven styling for boundaries](https://blog.afi.io/blog/google-maps-data-driven-styling-for-boundaries/), data driven styling for datasets lets us surface more about a feature on click by attaching a click listener that opens an info window with the feature's details. So let's make our app show more about a bike rack when the user clicks it.
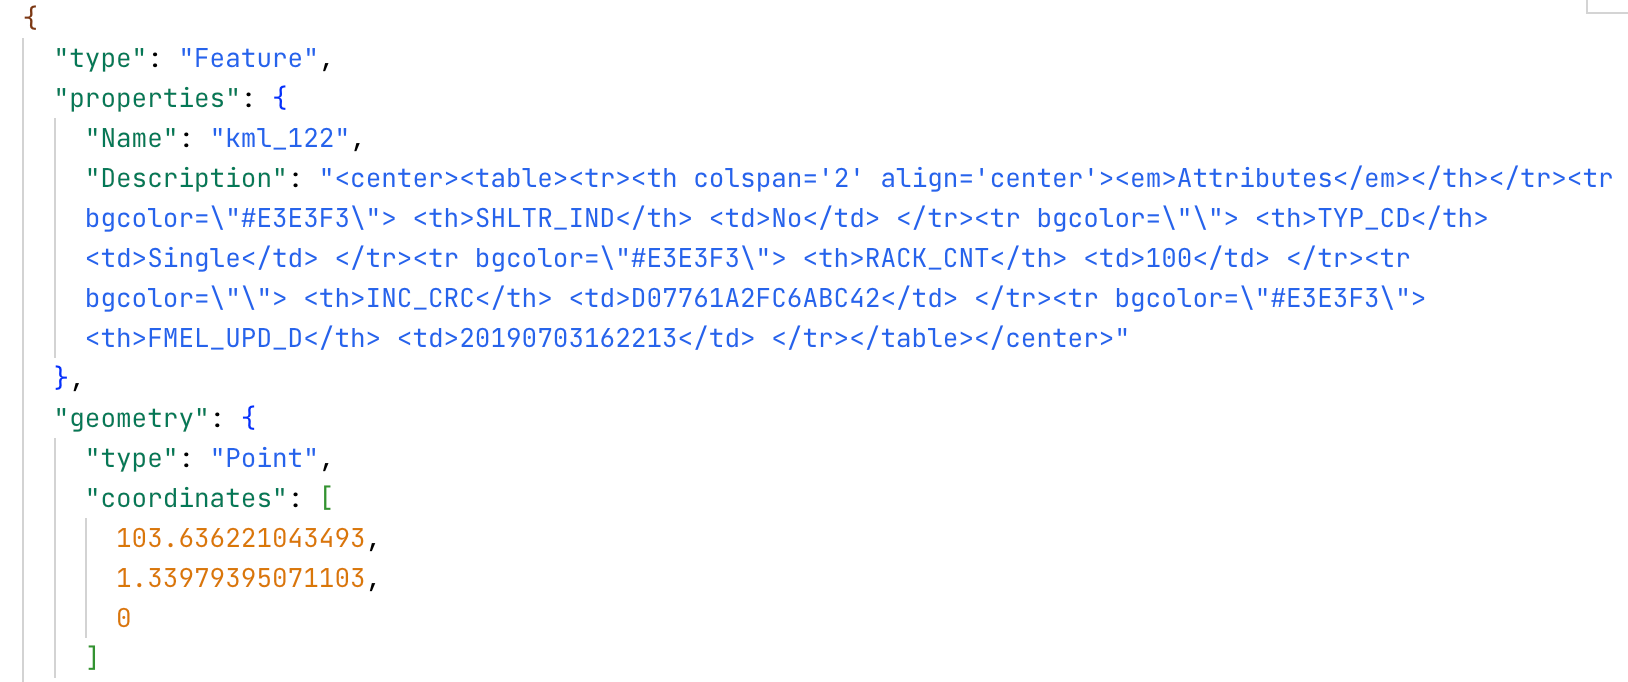
The Description field in the properties attributes of our GeoJSON
If we look carefully at the GeoJSON file we uploaded to the Google Cloud, you'll notice a `Description` field in the `properties` attribute of each feature. The `Description` field can be accessed via the `datasetAttributes` of the `DatasetFeature` object ([docs](https://developers.google.com/maps/documentation/javascript/reference/data-driven-styling?ref=blog.afi.io#DatasetFeature.datasetAttributes)) by calling `feature.datasetAttributes.Description`.
So in the click listener, we register a handler that fires whenever the user clicks anywhere on the bike rack feature layer with `layer.addListener("click", (event) => {});`. Then, because we know that the click handler on a `FeatureLayer` receives a `FeatureMouseEvent`, and that interface is defined to have a `features` property ([docs](https://developers.google.com/maps/documentation/javascript/reference/data-driven-styling?ref=blog.afi.io#FeatureMouseEvent)), we can retrieve the feature with `const feature = event.features?.[0];`. Finally, we save `event.latLng` (the position of the click) and `feature.datasetAttributes` (all the data columns for that rack e.g. `Name` and `Description` \- [see the full list on data.gov.sg](https://data.gov.sg/datasets/d%5F937424cca6d1617288a82a7aeb89f76d/view?ref=blog.afi.io)) to React state using:
```
setPopup({ position: event.latLng, attributes: feature.datasetAttributes });
```
The full code for the click listener is shown below.
```
const [popup, setPopup] = useState(null); // { position, attributes }
const clickListener = layer.addListener("click", (event) => {
const feature = event.features?.[0];
if (!feature) return;
setPopup({ position: event.latLng, attributes: feature.datasetAttributes });
});
```
The click listener ends with `setPopup({ position: event.latLng, attributes: feature.datasetAttributes })`. That call does two things: it saves the click location and the feature's data in state, which triggers a re-render.
The render half of the same interaction happens in the return statement (below), which displays an `InfoWindow` component from `@vis.gl/react-google-maps`.
```
return (
setPopup(null)}>
);
```
The `Description` field contains a bunch of HTML. To display it inside ``, we use the aptly named [dangerouslySetInnerHTML](https://blog.afi.io/blog/create-a-heatmap-in-google-maps-with-data-driven-styling/) method which renders the contents as actual markup. The result is a table showing details about the bike rack, including its type (`TYP_CD` single or double rack) and rack count (`RACK_CNT`).
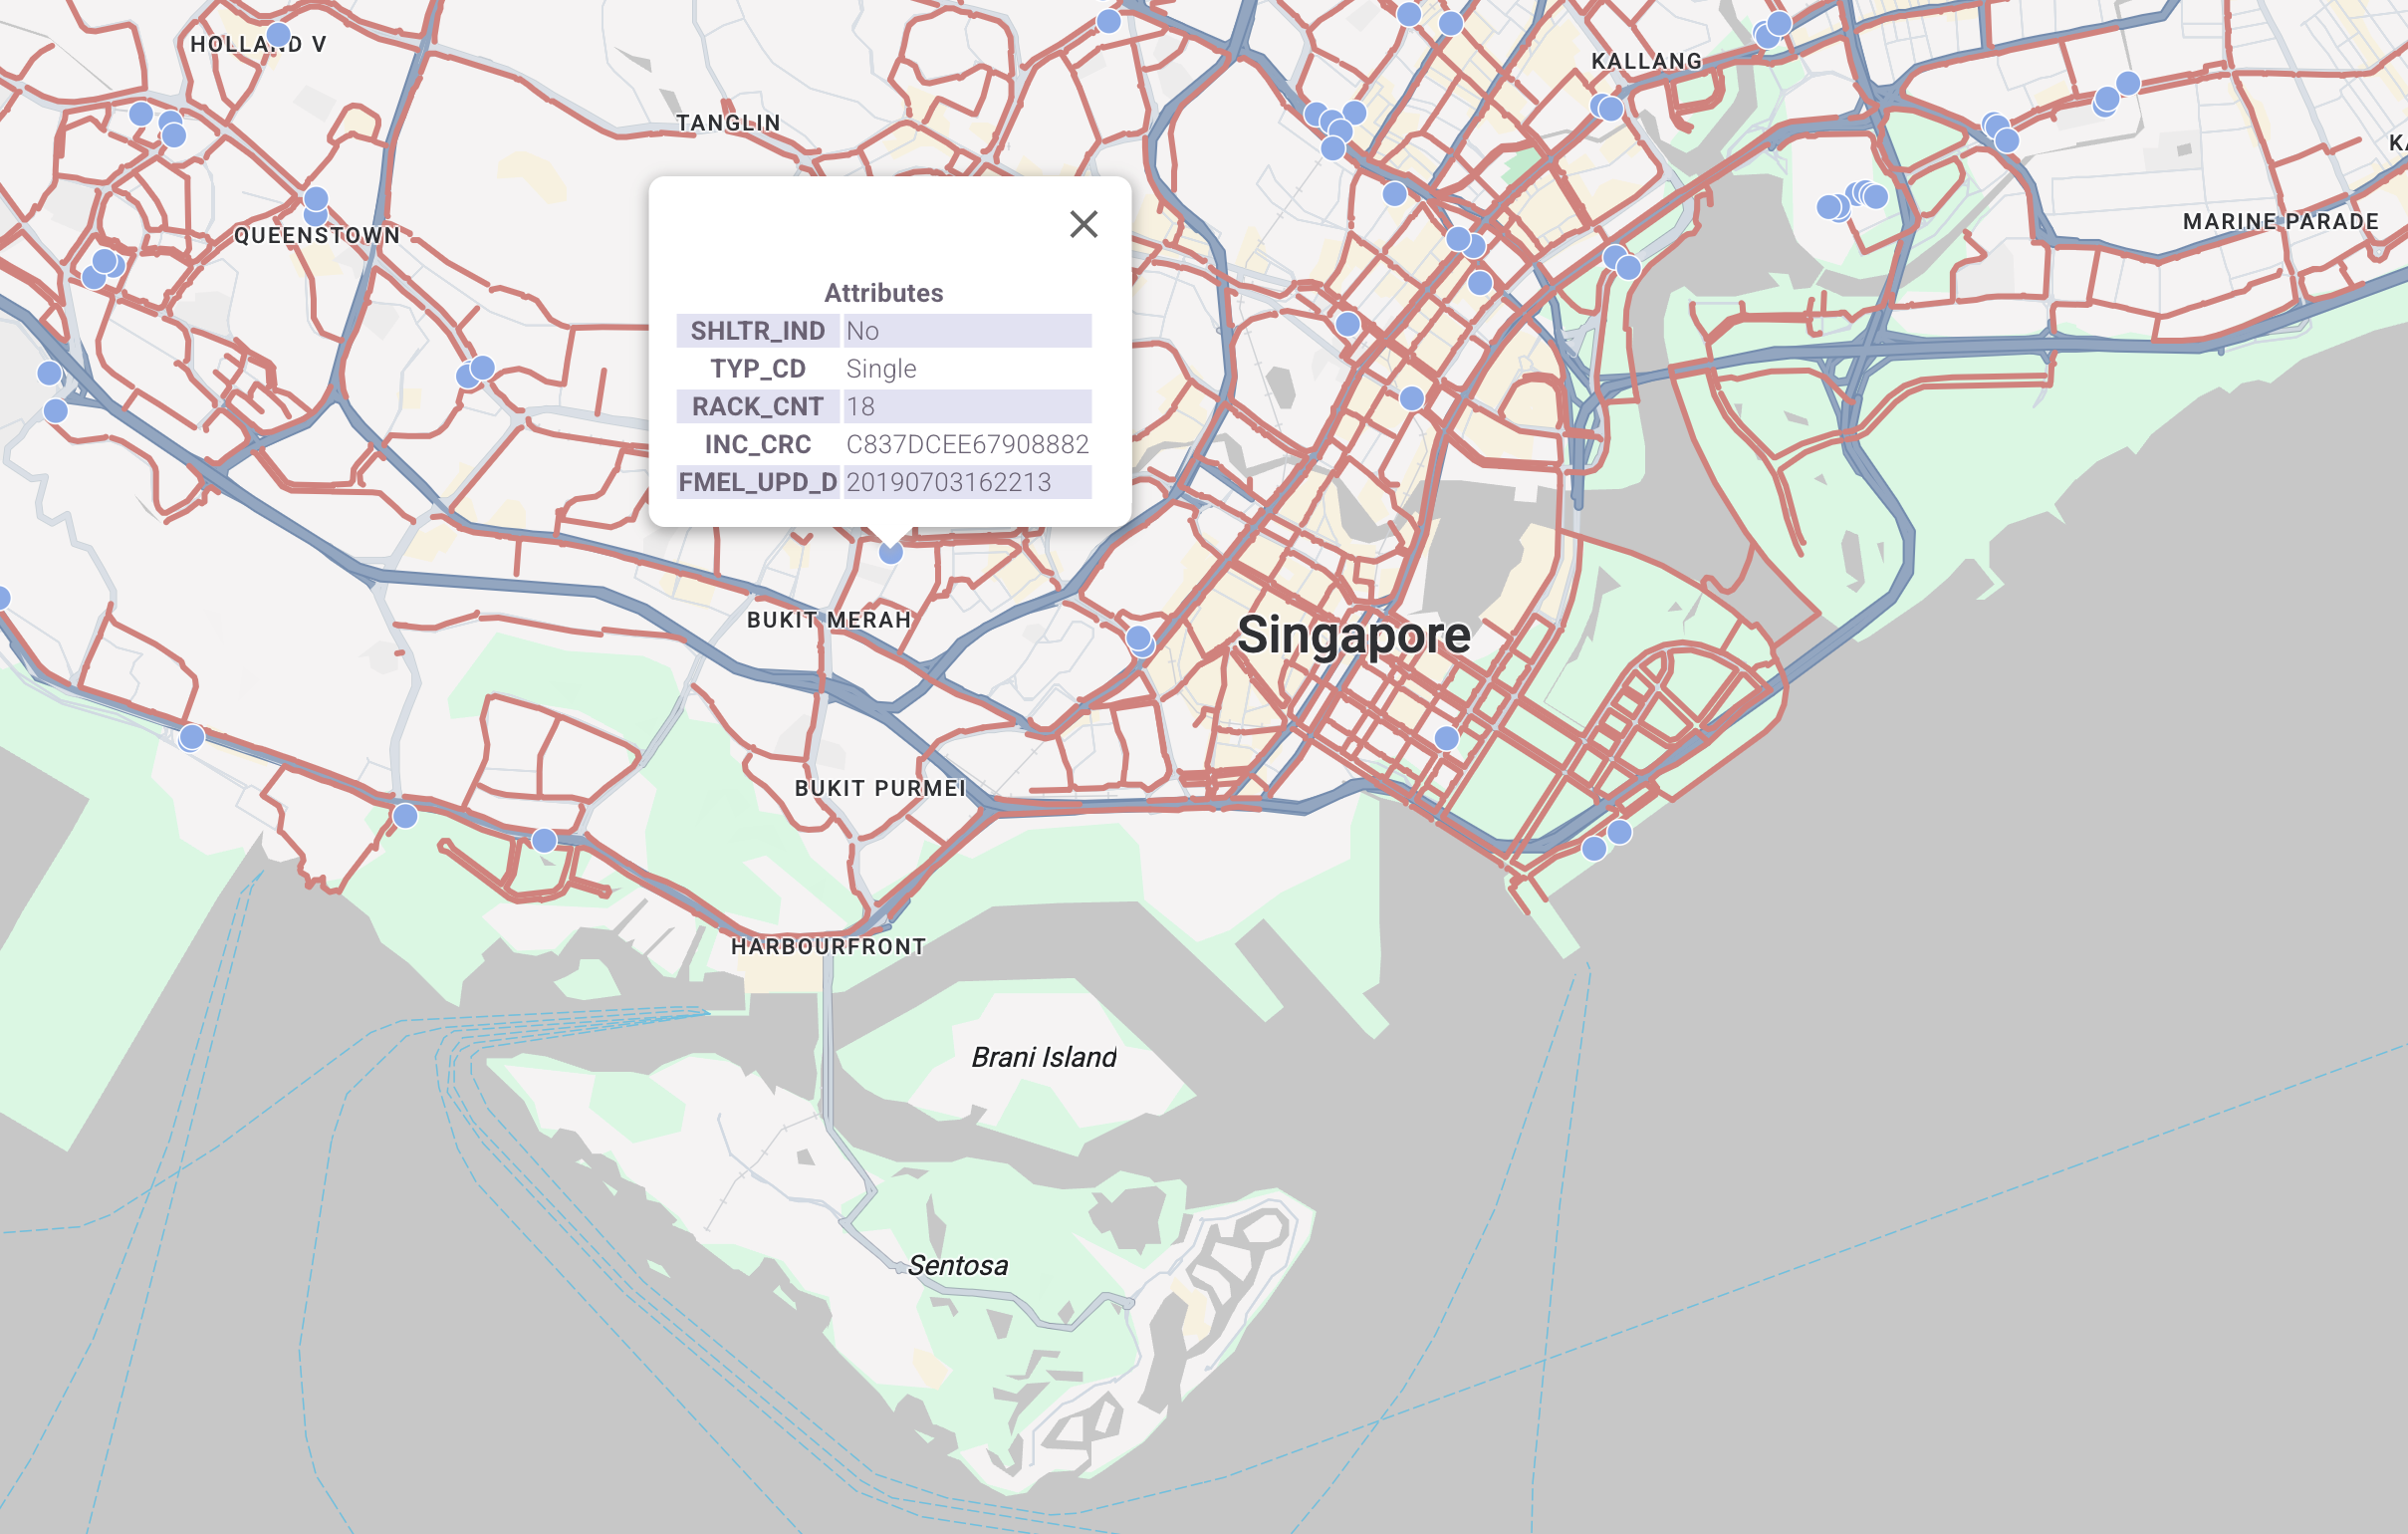
Embedding an info window to display more information about a feature
### Styling features based on their attributes
Technically, a feature style function only earns its name when it returns different styles for different features. The functions in `BikeRackDatasetLayer.jsx` and `CyclingPathDatasetLayer.jsx` don't do that. Every bike rack and bike lane gets the same style object, regardless of the data behind it. Let's change this.
I was in Singapore recently, and since I was writing this post, I paid close attention to the bike lanes I passed while driving. There were nowhere near as many as the [Cycling in Singapore](https://cycling-in-singapore.afi.dev/?ref=blog.afi.io) map shows. So what's going on?
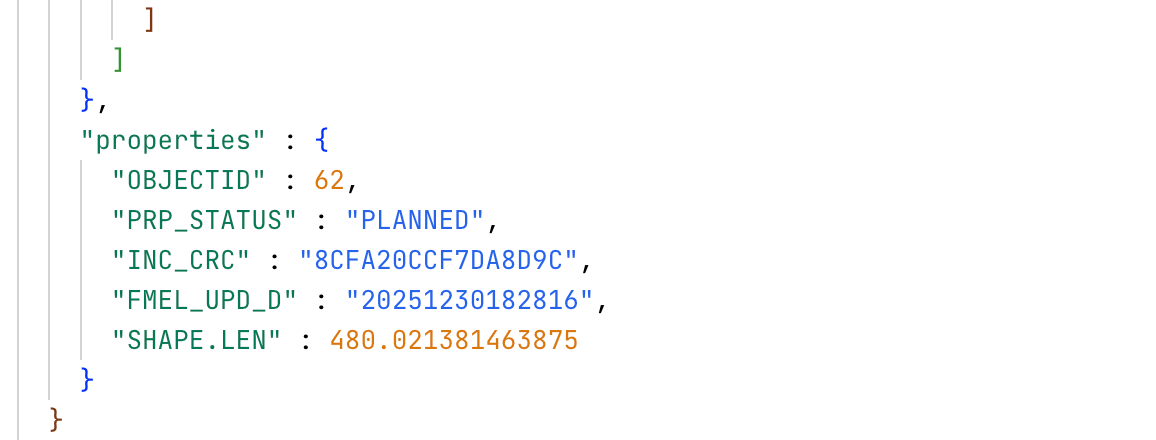
It turns out most of the bike lanes in the `ura-cycling-paths` dataset have a `PRP_STATUS` of "PLANNED", which means they don't exist yet. They're proposed routes, not built ones. How can we show this on the map?
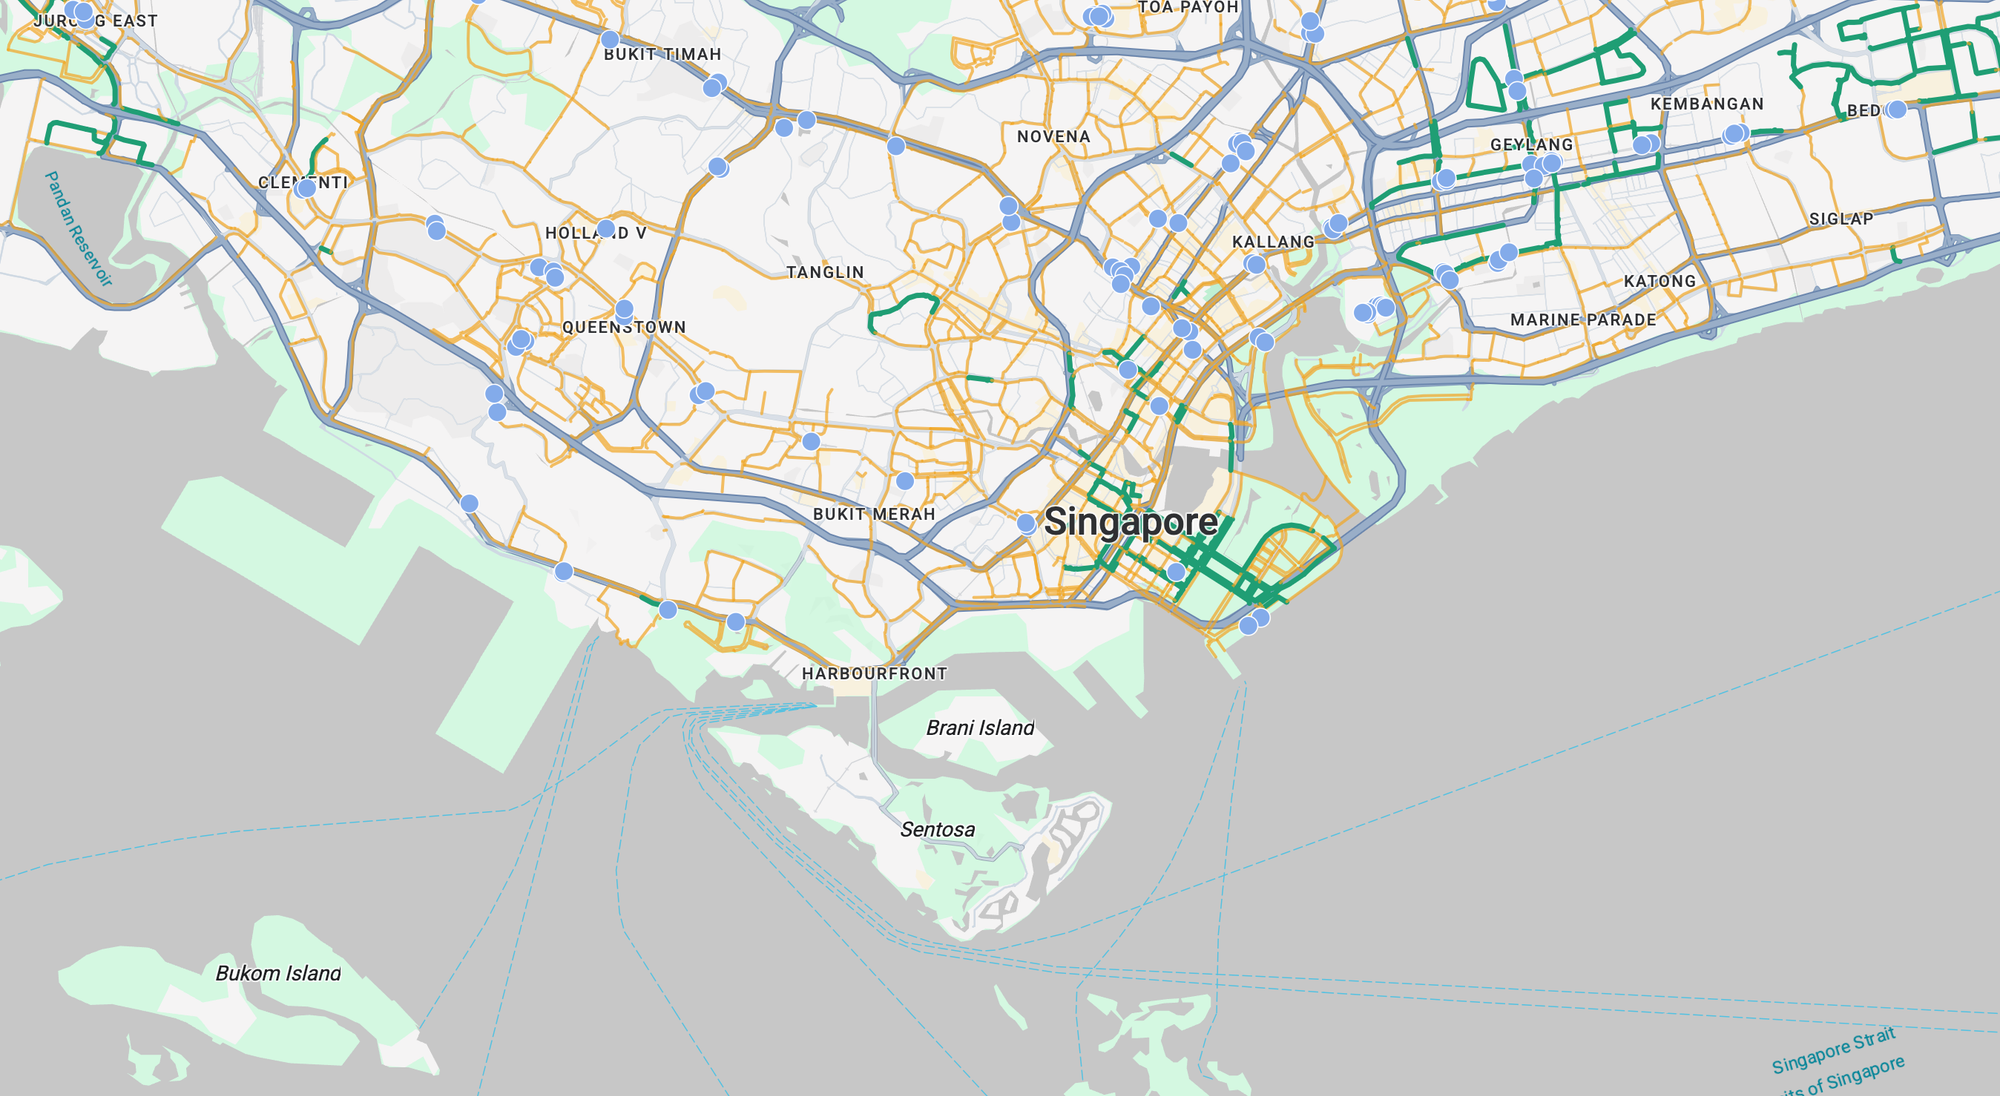
Using different colors to visualize planned vs built bike racks in Singapore
The best way to do this is to check whether a given bike lane is "PLANNED" and style it accordingly. The code below renders built paths as solid, heavy green lines and planned paths as thinner, semi transparent amber ones. The result is a map a reader can scan at a glance to tell which routes they can ride today and which are still just proposals.
```
layer.style = (params) => {
const attrs = params.feature.datasetAttributes;
const isPlanned = attrs.PRP_STATUS === "PLANNED";
return {
strokeColor: isPlanned ? "#F2A623" : "#1D9E75", // planned = amber, built = green
strokeWeight: isPlanned ? 2.0 : 3.5, // built reads heavier
strokeOpacity: isPlanned ? 0.7 : 1.0,
};
};
```
Finally, no good map is complete without a legend. Once features carry meaning through color, the reader needs a key to decode it, otherwise a green line and an amber one are just for show. A couple of labeled swatches near the map are enough, and they're the difference between a map people can read and one they have to guess at. To keep things tidy, we'll define the legend in its own file and import it.
**Legend.jsx**
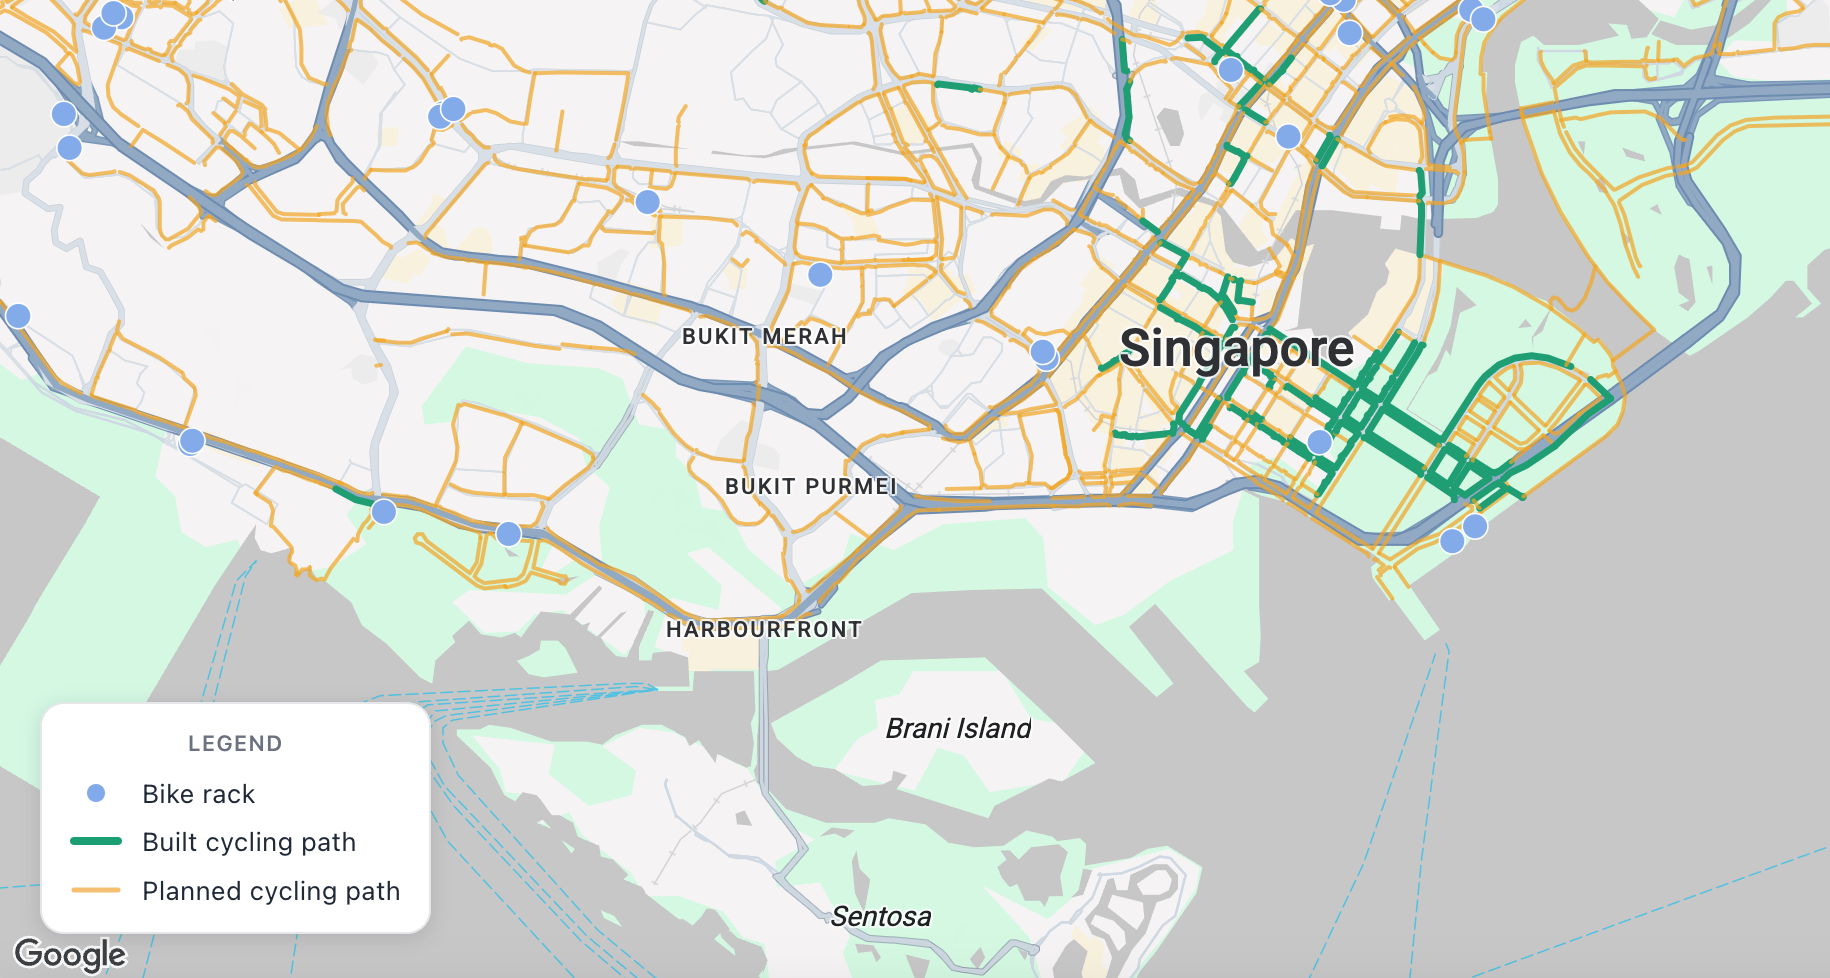
Adding a legend to our Cycling in Singapore map
The legend swatches are driven by a single `LEGEND_ITEMS` array whose colors and weights mirror the feature style functions we used - blue for bike racks, heavy solid green for built paths, thinner faded amber for planned.
```
/*** Legend.jsx ***/
const LEGEND_ITEMS = [
{ label: "Bike rack", kind: "point", color: "#83ABEB", stroke: "#ffffff" },
{ label: "Built cycling path", kind: "line", color: "#1D9E75", weight: 4, opacity: 1.0 },
{ label: "Planned cycling path", kind: "line", color: "#F2A623", weight: 2.5, opacity: 0.7 },
];
function Swatch({ item }) {
if (item.kind === "point") {
return (
);
}
return (
);
}
export default function Legend() {
return (
Legend
{LEGEND_ITEMS.map((item) => (
{item.label}
))}
);
}
const styles = {
legend: {
position: "absolute",
bottom: "24px",
left: "24px",
zIndex: 10,
background: "#ffffff",
border: "1px solid #e5e7eb",
borderRadius: "12px",
padding: "12px 14px",
boxShadow: "0 2px 10px rgba(0, 0, 0, 0.12)",
font: "13px/1.4 system-ui, -apple-system, sans-serif",
color: "#1f2937",
userSelect: "none",
},
title: {
fontSize: "11px",
fontWeight: 600,
letterSpacing: "0.04em",
textTransform: "uppercase",
color: "#6b7280",
marginBottom: "8px",
},
list: {
listStyle: "none",
margin: 0,
padding: 0,
display: "flex",
flexDirection: "column",
gap: "6px",
},
row: {
display: "flex",
alignItems: "center",
gap: "10px",
},
label: {
whiteSpace: "nowrap",
},
};
```
Inside `App.jsx`, the `` component is sibling of ``. Because the legend is a plain HTML overlay (not a map feature), it lives beside the map in the DOM and floats on top via `z-index`, while the wrapper's `position: relative` is what anchors it to the map's corner rather than the page.
```
/*** return statement of App.jsx ***/
return (
);
```
### Deploy and run
To run Cycling in Singapore locally, fork the [google\_maps\_data\_styling\_datasets](https://github.com/afilabs/google%5Fmaps%5Fdata%5Fstyling%5Fdatasets/?ref=blog.afi.io) repo, then run `npm install` and `npm run dev`. Before it'll work, set `VITE_GOOGLE_MAPS_API_KEY` and `VITE_GOOGLE_MAPS_MAP_ID` to your own API key and Map ID - and make sure that Map ID points to a style with the datasets uploaded and associated, as covered earlier.
### That's a wrap!
For me, the planned versus built distinction turned out to be the most interesting find. The [Cycling in Singapore](https://cycling-in-singapore.afi.dev/?ref=blog.afi.io) map looked richer than reality because it included bike lanes that don't exist yet. And styling that difference well isn't just a nice visual, it's the whole point of good data driven styling.
Part 1: [Style a Google Map any way you want](https://blog.afi.io/blog/style-a-google-map-any-way-you-want/)
Part 2: [Apply styles for Google Maps using JSON style arrays](https://blog.afi.io/blog/apply-styles-for-google-maps-using-json-style-arrays/)
Part 3: [Cloud based map styling for Google Maps](https://blog.afi.io/blog/cloud-based-map-styling-for-google-maps/)
Part 4: [Google Maps data driven styling for boundaries](https://blog.afi.io/blog/google-maps-data-driven-styling-for-boundaries/)
Part 5: [Create a heatmap in Google Maps with data driven styling](https://www.afi.io/blog/create-a-heatmap-in-google-maps-with-data-driven-styling/?ref=blog.afi.io)
Part 6: [Upload and style datasets using the Maps Datasets API](https://www.afi.io/blog/upload-and-style-datasets-using-the-maps-datasets-api/?ref=blog.afi.io)
Part 7: [Add data to Google Maps with data driven styling](https://afi.io/blog/add-data-to-google-maps-with-data-driven-styling/?ref=blog.afi.io)
**This article was written by** [**Afi Labs**](https://afi.io/?ref=blog.afi.io)**, a** [**Google Maps Premier Partner**](https://www.afi.io/?ref=blog.afi.io) **and reseller. We build route optimization, navigation, and fleet tracking software on Google Maps, and offer volume pricing on GMP licensing.** [**Talk to an engineer**](https://www.afi.io/contact%5Fus?ref=blog.afi.io) **or** [**follow Afian on LinkedIn**](https://www.linkedin.com/in/afian-anwar/?ref=blog.afi.io)**.**