> ## Content Index
> Fetch the complete content index at: https://blog.afi.io/llms.txt
> Use this file to discover other available public pages before exploring further.
# Create a heatmap in Google Maps with data driven styling
- URL: https://blog.afi.io/blog/create-a-heatmap-in-google-maps-with-data-driven-styling/
- Published: 2026-06-12T02:01:13.000Z
- Updated: 2026-08-21T05:09:14.000Z
- Description: Learn how to build an interactive heatmap in Google Maps with data driven styling and React.
- Author: Afian Anwar
- Tags: googlemaps
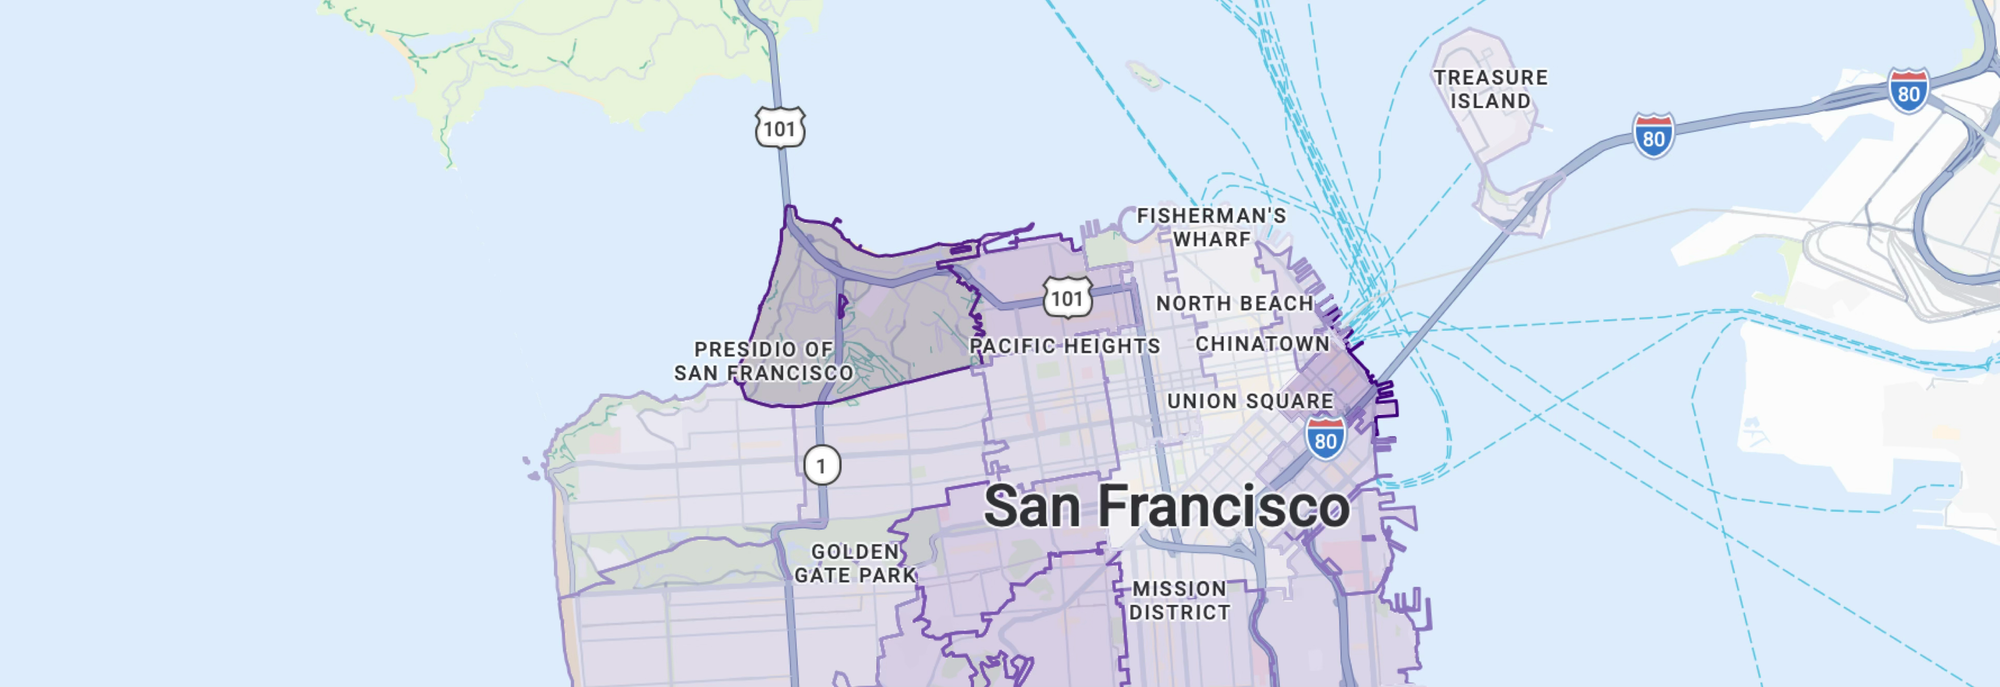
In this post, I'll show you how to use [data driven styling for boundaries](https://developers.google.com/maps/documentation/javascript/dds-boundaries/overview?ref=blog.afi.io) to build a heatmap in Google Maps that shades San Francisco postal codes by median household income. We'll build on the map from the [last section](https://blog.afi.io/blog/google-maps-data-driven-styling-for-boundaries/), layering household income data from the US Census Bureau onto Google's built-in postal code boundaries.
Part 1: [Style a Google Map any way you want](https://blog.afi.io/blog/style-a-google-map-any-way-you-want/)
Part 2: [Apply styles for Google Maps using JSON style arrays](https://blog.afi.io/blog/apply-styles-for-google-maps-using-json-style-arrays/)
Part 3: [Cloud based map styling for Google Maps](https://blog.afi.io/blog/cloud-based-map-styling-for-google-maps/)
Part 4: [Google Maps data driven styling for boundaries](https://blog.afi.io/blog/google-maps-data-driven-styling-for-boundaries/)
**Part 5: Create a heatmap in Google Maps with data driven styling (this article)**
Part 6: [Upload and style datasets using the Maps Datasets API](https://www.afi.io/blog/upload-and-style-datasets-using-the-maps-datasets-api/?ref=blog.afi.io)
Part 7: [Add data to Google Maps with data driven styling](https://afi.io/blog/add-data-to-google-maps-with-data-driven-styling/?ref=blog.afi.io)
### Income inequality in San Francisco
San Francisco consistently ranks among the most unequal US cities, and it's unusual in being both very wealthy and highly unequal at once. In 2024 its median household income was about $139,800, second only to neighboring San Jose among large US cities. It was also one of the fastest rising, up 10.3% in a single year, the third largest jump among the 50 biggest cities.
That growth came even as [Bay Area tech companies shed tens of thousands of jobs](https://sfstandard.com/2026/01/28/ai-booming-tech-jobs-san-francisco/?ref=blog.afi.io). The rising median isn't broad based prosperity. A small, extraordinarily well paid cohort pulled the top of the distribution upward while the broader job market contracted. The boom is concentrated among AI workers rather than the wider economy, which only deepens the city's inequality.
A table of incomes by postal code tells you inequality exists. A map shows you where it lives. In this tutorial, I'll show you how to use [data driven styling for boundaries](https://developers.google.com/maps/documentation/javascript/dds-boundaries/overview?ref=blog.afi.io) to color each San Francisco postal code by median household income, turning the city's economic divide into something that you can see. Hover and click events make the map interactive, inviting users to explore the data directly.
### Google Maps heatmap worked example
This tutorial uses two files. `App.jsx` is the entry point. It uses [@vis.gl/react-google-maps](https://visgl.github.io/react-google-maps/?ref=blog.afi.io) to display a Google map while `SFMedianHHIncomeHeatmap.jsx` contains all the heat map code. To follow along, paste the code snippets from the end of this post into a new React project and run it locally. Then experiment. Change the heatmap colors or swap in a different dataset, and watch how the map responds.
### Choosing a good heatmap color scale
Selecting an appropriate color scheme for our heatmap can help users quickly interpret the data and patterns represented in the heat map. Best practice is to pick a sequential color scale that runs from light to dark along a single hue (or a smooth transition between two related hues). For this project, I've chosen the Color [Brewer 9-class Purples](https://colorbrewer2.org/?ref=blog.afi.io#type=sequential&scheme=Purples&n=9) palette. Others palettes work well too, but I like purple 😀.
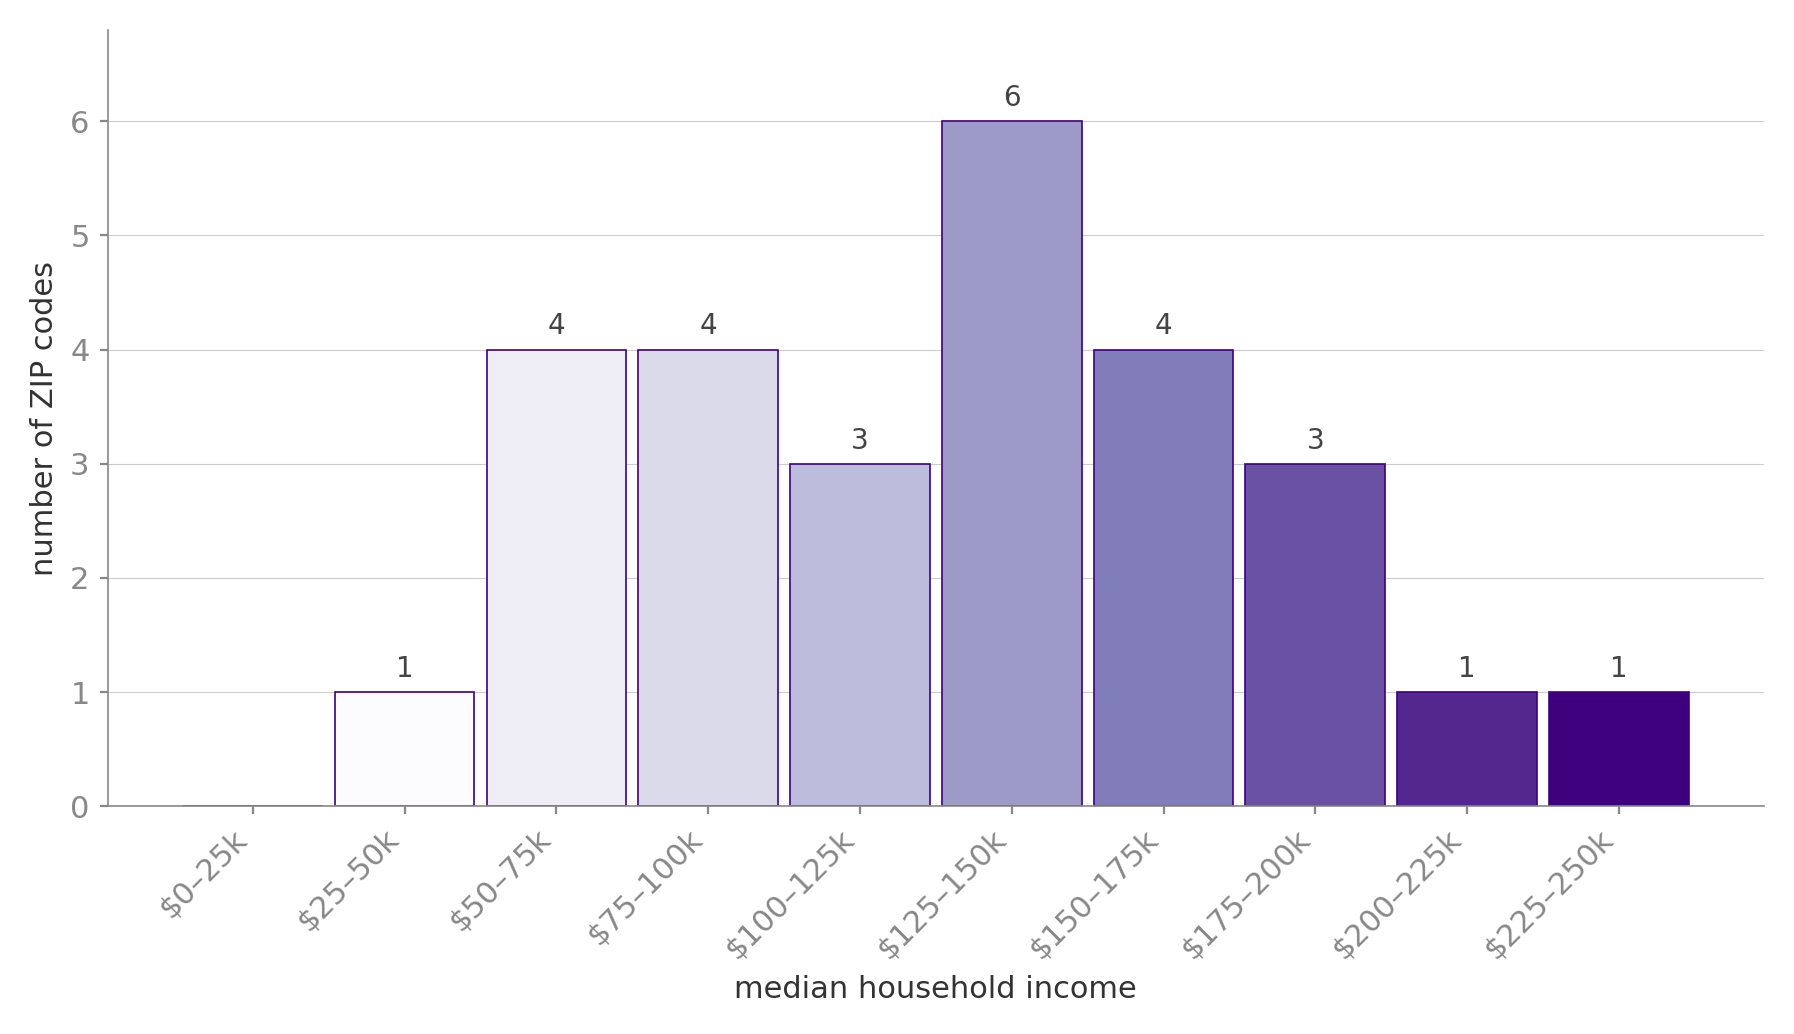
Looking at the data when binned into intervals of $25,000, we see a peak at the $125 - $150k interval and gradual fall off on both sides. Choosing a heatmap color scheme is more art than science to be honest, but we'll go with this for now and see how it looks like on a map.
### How to create a heatmap in Google Maps
These are the five steps to create a heatmap in Google Maps with data driven styling.
1. **Collect data.** Luckily, US household income data is easy to come by. The Census Bureau's [American Community Survey](https://www.census.gov/programs-surveys/acs.html?ref=blog.afi.io) collects detailed demographic, social, economic, and housing data on the American population every year, and table B19013 covers median household income specifically. They even have an API! For this exercise, we'll use data from the 2024 5-year estimates.
**Endpoint:** `GET`
```
https://api.census.gov/data/2024/acs/acs5?get=NAME,B19013_001E&for=zip%20code%20tabulation%20area:94102,94103,94104,94105,94107,94108,94109,94110,94111,94112,94114,94115,94116,94117,94118,94121,94122,94123,94124,94127,94129,94130,94131,94132,94133,94134,94158
```
We then map the postal codes to the median household income values like this:
```
const medianIncomeByZip = {
"94102": 55888,
"94103": 93143,
"94104": 42591,
"94105": 244662,
"94107": 164289,
"94108": 65392,
"94109": 104476,
"94110": 143938,
"94111": 135735,
"94112": 112795,
"94114": 169459,
"94115": 138023,
"94116": 134652,
"94117": 174419,
"94118": 139043,
"94121": 116970,
"94122": 130708,
"94123": 194098,
"94124": 66618,
"94127": 180768,
"94129": 218717,
"94130": 83077,
"94131": 181329,
"94132": 93995,
"94133": 71063,
"94134": 93068,
"94158": 161391
};
```
1. **Define boundaries**. Since we're using Google Maps [data driven styling for boundaries](https://developers.google.com/maps/documentation/javascript/dds-boundaries/overview?ref=blog.afi.io), this part is easy. Find a list of San Francisco postal codes (OpenDataSF offers a [CSV download](https://data.sfgov.org/-/San-Francisco-ZIP-Codes/srq6-hmpi?ref=blog.afi.io)), then call the [Google Geocoding API](https://blog.afi.io/blog/a-practical-guide-to-the-google-geocoding-api/) to retrieve the `placeId` for each one. We'll use this `placeId` in the postal code layer `FeatureStyleFunction` to automatically draw the postal code boundary on the map.
**Endpoint:** `GET`
```
https://maps.googleapis.com/maps/api/geocode/json?address=San Francisco, CA 94133&key={GOOGLE_MAPS_API_KEY}
```
**Response**
```
{
"results" :
[
{
"address_components" :
[
//... address components
],
"formatted_address" : "San Francisco, CA 94133, USA",
"geometry" :
{
//... geometry data
},
"place_id" : "ChIJ61hhQeGAhYARo_x_aAlCar8",
"types" :
[
"postal_code"
]
}
],
"status" : "OK"
}
```
The `place_id` in the response (`ChIJ61hhQeGAhYARo_x_aAlCar8` in the above example) is what we are after.
1. **Map Place IDs to data.** This one is data driven styling specific. Place IDs are the join key Google's boundary system is built on. With data driven styling, you don't need to supply your own polygon geometry. Google renders its boundary tiles and our code decides how each feature gets painted. For that to work, you need to use Google's representation of each region, the [Place ID](https://developers.google.com/maps/documentation/places/web-service/place-id?ref=blog.afi.io). From the Geocoding API call we have the mapping of postal codes to Place IDs:
```
const zipToPlaceId = {
"94102": "ChIJs88qnZmAhYARk8u-7t1Sc2g",
"94103": "ChIJ09mpM52AhYARm2WOMfyfxhs",
"94104": "ChIJD6M14YmAhYAR5WVbcn7uWPk",
"94105": "ChIJDXK6UmKAhYARfzuOY6DDgeM",
"94107": "ChIJg0__2jN-j4AR479OXNRG7O8",
"94108": "ChIJx5rJUYyAhYARxagLGBVGeFs",
"94109": "ChIJy0ilcOmAhYARCLOo6oZQNxk",
"94110": "ChIJjxQcAEF-j4ARegNFVBwq4vg",
"94111": "ChIJ49w0El-AhYAR9WVSnuOiWM8",
"94112": "ChIJ_wUjuoN-j4ARLYl5YXTu7iQ",
"94114": "ChIJ_dA2rgV-j4ARt3snzTZ80Ds",
"94115": "ChIJzyP3rbeAhYARTmAfNPJZzeY",
"94116": "ChIJddwdf4N9j4ARNjehk8mVCNA",
"94117": "ChIJ773z7quAhYARnGZ-5ZUIkcg",
"94118": "ChIJE8NGljiHhYARnSY8nSgLJkk",
"94121": "ChIJ-6VsK6aHhYARhH00Wvw4WGs",
"94122": "ChIJaZi-WHqHhYARP44d5B8lUhI",
"94123": "ChIJrYrvSdeAhYARtJlHJMWNQzY",
"94124": "ChIJe7_iURF_j4ARlf3H78H0YTk",
"94127": "ChIJK9xbjZR9j4ARBsVPOdGWHs8",
"94129": "ChIJ80PrL8OGhYARiuhtoI_sR0s",
"94130": "ChIJTyCM6zGAhYARWkaPBK60p6Q",
"94131": "ChIJ22y0JQt-j4ARCs3ThPYOWpc",
"94132": "ChIJSbCANq99j4ARVMl6KzrGk9c",
"94133": "ChIJ61hhQeGAhYARo_x_aAlCar8",
"94134": "ChIJJ3mtweZ-j4AR2LF94NUnNKI",
"94158": "ChIJTayi3tN_j4ARIwuQJy7-etE",
};
```
What we need now is a way to use the postal code as a foreign key to join the `placeId` with the `zipIncome` (median income in a particular postal code). The code snippet below does exactly that by building a lookup table that can be used by our `FeatureStyleFunction`.
```
const incomeByPlaceId = Object.fromEntries(
Object.entries(zipToPlaceId).map(([zip, placeId]) => [placeId, medianIncomeByZip[zip]])
);
```
Here's how it works:
`Object.entries(zipToPlaceId)` turns the object into an array of `[zip, placeId]` pairs: `[["94102", "ChIJs88q…"], ["94103", "ChIJ09mp…"], …]`.
`.map(([zip, placeId]) => [placeId, medianIncomeByZip[zip]])` transforms each pair: it destructures the ZIP and place ID, looks up that ZIP's income, and returns a new pair with the `placeId` as the key and the income as the value: `[["ChIJs88q…", 55888], …]`
`Object.fromEntries(...)` reassembles those pairs back into an object that looks like this:
```
{
"ChIJs88qnZmAhYARk8u-7t1Sc2g": 55888, // was 94102
"ChIJ09mpM52AhYARm2WOMfyfxhs": 93143, // was 94103
// ...
}
```
1. **Map income to color.** Next, we map each postal code's median income to a color. A color scale (`PURPLES`) takes the income range (roughly $43k–$245k) as its input domain and outputs a fill color, so higher income postal codes render in darker shades of purple.
```
const BIN_THRESHOLDS = [50000, 75000, 100000, 125000, 150000, 175000, 200000, 225000];
// 9 colors, 8 thresholds → under $50k = PURPLES[0]; $50–75k = PURPLES[1]; … $225k+ = PURPLES[8]
const incomeColorForPlaceId = (placeId) => {
const income = incomeByPlaceId[placeId];
if (income == null) return null;
const i = BIN_THRESHOLDS.findIndex((t) => income < t);
return PURPLES[i === -1 ? PURPLES.length - 1 : i];
};
```
The `incomeColorForPlaceId()` method uses an explicit array of bin thresholds and a simple lookup to determine the color for a given postal code. The method relies on a single`findIndex` call: it walks the thresholds and returns the index of the first one the income falls below. A postal code at $42,591 falls below `$50,000` and gets `PURPLES[0]`; a postal code at $244,662 doesn't fall below any threshold, so `findIndex` returns `-1`, and the ternary catches that case to clamp the result to the darkest shade.
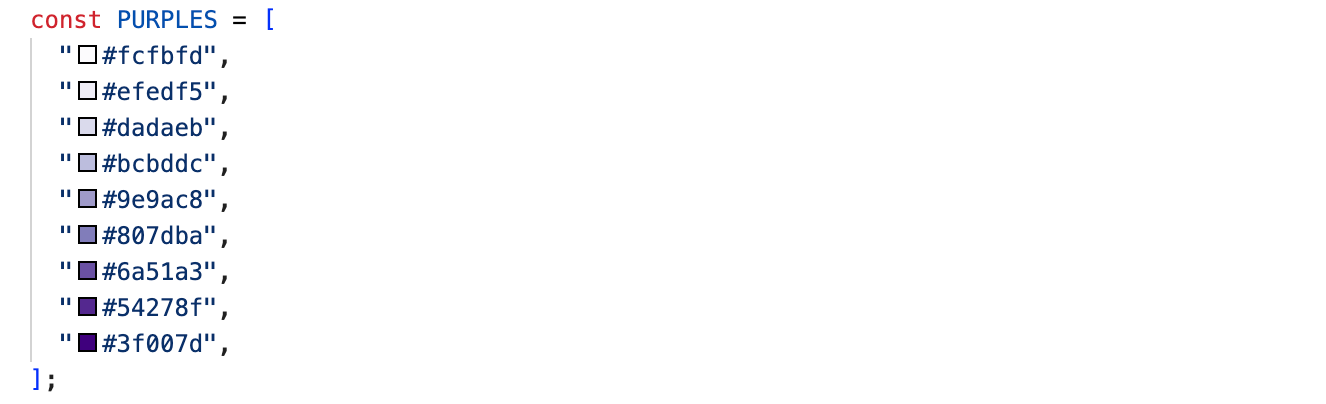
Lower income postal codes get lighter shades; higher income ones get darker. The number of entries in `PURPLES` controls the granularity: more shades mean finer income distinctions on the map.
1. **Define the style function.** Finally, in our `FeatureStyleFunction`, we call `incomeColorForPlaceId` and style the postal code boundary polygon accordingly.
```
const makeHeatmapStyle = (placeId) => ({
strokeColor: incomeColorForPlaceId(placeId),
strokeOpacity: 1,
strokeWeight: 1.5,
fillColor: incomeColorForPlaceId(placeId),
fillOpacity: 0.25,
});
```
The end result is a choropleth of San Francisco built directly on Google Maps postal code boundaries. All 27 SF ZIP codes are shaded along a ten step purple ramp keyed to median household income.
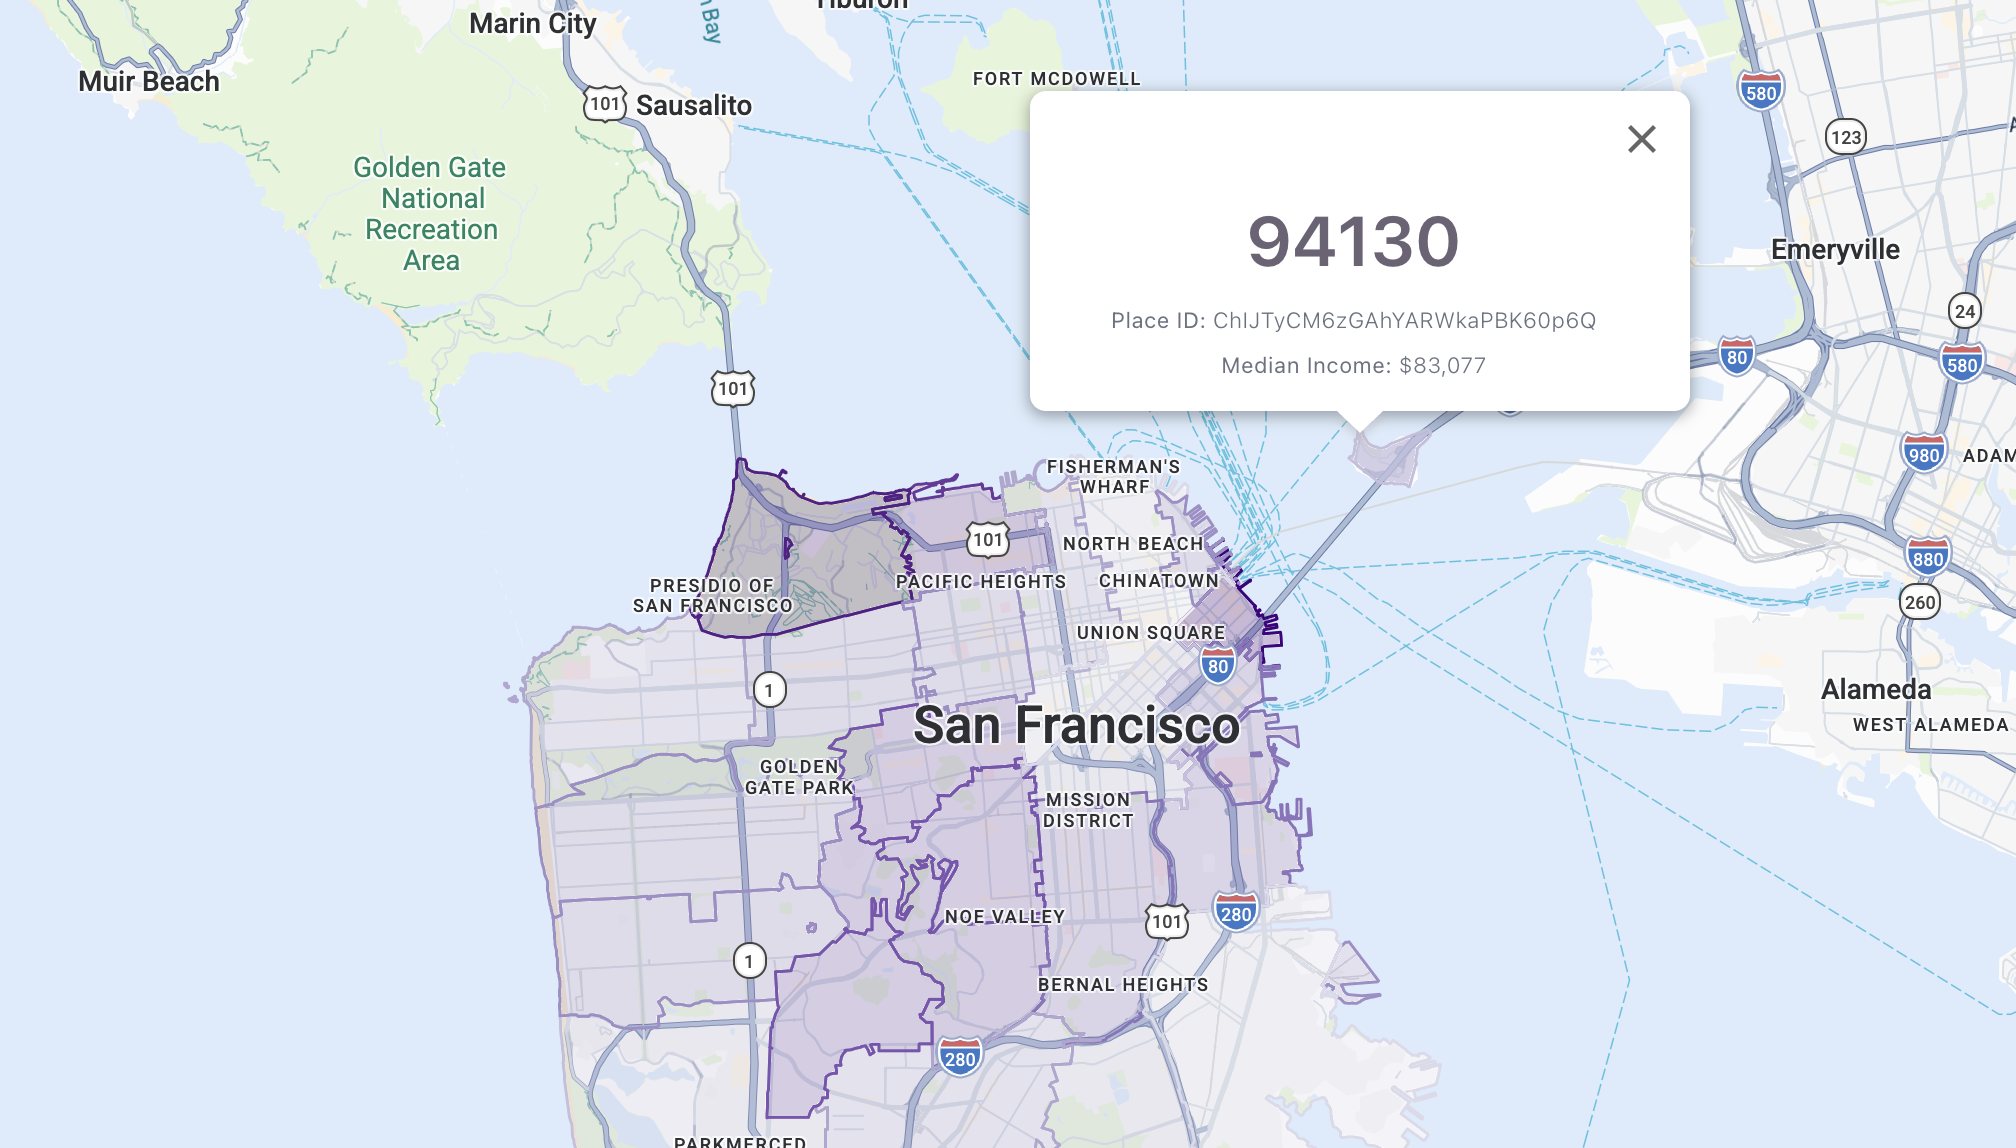
The map is fully interactive (read my [previous tutorial](https://blog.afi.io/blog/google-maps-data-driven-styling-for-boundaries/) to learn how to add interactivity to your map). Hover over a postal code and its outline gets thicker (plus you get a pointer cursor so you know it's clickable). Click one and it darkens to show it's selected, and an info window pops up right where you clicked. The info window shows the postal code's five digit number (retrieved using`fetchPlace()`), its Place ID, and the median household income. Click the same ZIP again or close the window, and everything goes back to as it was.
###
### Deploy and run
The full source code for `App.jsx` and `SFMedianHHIncomeHeatmap.jsx` (which contains code for the heat map) is provided below. To see the heatmap in action, spin up a simple React app in [Vite](https://vite.dev/?ref=blog.afi.io) ([follow these instructions](https://blog.afi.io/blog/google-maps-with-react-add-a-google-map-and-style-it/) from a previous tutorial) and add the `App.jsx` `SFMedianHHIncomeHeatmap.jsx` to the project. Run `npm install` to install the dependencies followed by `npm run dev`. Point your browser to [http://localhost:5173](http://localhost:5173/?ref=blog.afi.io) to open the app.
**App.jsx**
```
/*** App.jsx ***/
import {APIProvider} from '@vis.gl/react-google-maps';
import {Map} from '@vis.gl/react-google-maps';
import { useCallback } from 'react';
import SFMedianHHIncomeHeatmap from './SFMedianHHIncomeHeatmap';
function App() {
return (
)
}
export default App
```
**SFMedianHHIncomeHeatmap.jsx**
```
/*** SFMedianHHIncomeHeatmap.jsx ***/
import { useEffect, useRef, useState } from "react";
import { useMap, InfoWindow } from "@vis.gl/react-google-maps";
const SF_ZIP_PLACEIDS = new Set([
"ChIJs88qnZmAhYARk8u-7t1Sc2g",
"ChIJ09mpM52AhYARm2WOMfyfxhs",
"ChIJD6M14YmAhYAR5WVbcn7uWPk",
"ChIJDXK6UmKAhYARfzuOY6DDgeM",
"ChIJg0__2jN-j4AR479OXNRG7O8",
"ChIJx5rJUYyAhYARxagLGBVGeFs",
"ChIJy0ilcOmAhYARCLOo6oZQNxk",
"ChIJjxQcAEF-j4ARegNFVBwq4vg",
"ChIJ49w0El-AhYAR9WVSnuOiWM8",
"ChIJ_wUjuoN-j4ARLYl5YXTu7iQ",
"ChIJ_dA2rgV-j4ARt3snzTZ80Ds",
"ChIJzyP3rbeAhYARTmAfNPJZzeY",
"ChIJddwdf4N9j4ARNjehk8mVCNA",
"ChIJ773z7quAhYARnGZ-5ZUIkcg",
"ChIJE8NGljiHhYARnSY8nSgLJkk",
"ChIJ-6VsK6aHhYARhH00Wvw4WGs",
"ChIJaZi-WHqHhYARP44d5B8lUhI",
"ChIJrYrvSdeAhYARtJlHJMWNQzY",
"ChIJe7_iURF_j4ARlf3H78H0YTk",
"ChIJK9xbjZR9j4ARBsVPOdGWHs8",
"ChIJ80PrL8OGhYARiuhtoI_sR0s",
"ChIJTyCM6zGAhYARWkaPBK60p6Q",
"ChIJ22y0JQt-j4ARCs3ThPYOWpc",
"ChIJSbCANq99j4ARVMl6KzrGk9c",
"ChIJ61hhQeGAhYARo_x_aAlCar8",
"ChIJJ3mtweZ-j4AR2LF94NUnNKI",
"ChIJTayi3tN_j4ARIwuQJy7-etE",
]);
const zipToPlaceId = {
"94102": "ChIJs88qnZmAhYARk8u-7t1Sc2g",
"94103": "ChIJ09mpM52AhYARm2WOMfyfxhs",
"94104": "ChIJD6M14YmAhYAR5WVbcn7uWPk",
"94105": "ChIJDXK6UmKAhYARfzuOY6DDgeM",
"94107": "ChIJg0__2jN-j4AR479OXNRG7O8",
"94108": "ChIJx5rJUYyAhYARxagLGBVGeFs",
"94109": "ChIJy0ilcOmAhYARCLOo6oZQNxk",
"94110": "ChIJjxQcAEF-j4ARegNFVBwq4vg",
"94111": "ChIJ49w0El-AhYAR9WVSnuOiWM8",
"94112": "ChIJ_wUjuoN-j4ARLYl5YXTu7iQ",
"94114": "ChIJ_dA2rgV-j4ARt3snzTZ80Ds",
"94115": "ChIJzyP3rbeAhYARTmAfNPJZzeY",
"94116": "ChIJddwdf4N9j4ARNjehk8mVCNA",
"94117": "ChIJ773z7quAhYARnGZ-5ZUIkcg",
"94118": "ChIJE8NGljiHhYARnSY8nSgLJkk",
"94121": "ChIJ-6VsK6aHhYARhH00Wvw4WGs",
"94122": "ChIJaZi-WHqHhYARP44d5B8lUhI",
"94123": "ChIJrYrvSdeAhYARtJlHJMWNQzY",
"94124": "ChIJe7_iURF_j4ARlf3H78H0YTk",
"94127": "ChIJK9xbjZR9j4ARBsVPOdGWHs8",
"94129": "ChIJ80PrL8OGhYARiuhtoI_sR0s",
"94130": "ChIJTyCM6zGAhYARWkaPBK60p6Q",
"94131": "ChIJ22y0JQt-j4ARCs3ThPYOWpc",
"94132": "ChIJSbCANq99j4ARVMl6KzrGk9c",
"94133": "ChIJ61hhQeGAhYARo_x_aAlCar8",
"94134": "ChIJJ3mtweZ-j4AR2LF94NUnNKI",
"94158": "ChIJTayi3tN_j4ARIwuQJy7-etE",
};
const medianIncomeByZip = {
"94102": 55888,
"94103": 93143,
"94104": 42591,
"94105": 244662,
"94107": 164289,
"94108": 65392,
"94109": 104476,
"94110": 143938,
"94111": 135735,
"94112": 112795,
"94114": 169459,
"94115": 138023,
"94116": 134652,
"94117": 174419,
"94118": 139043,
"94121": 116970,
"94122": 130708,
"94123": 194098,
"94124": 66618,
"94127": 180768,
"94129": 218717,
"94130": 83077,
"94131": 181329,
"94132": 93995,
"94133": 71063,
"94134": 93068,
"94158": 161391
};
const incomeByPlaceId = Object.fromEntries(
Object.entries(zipToPlaceId).map(([zip, placeId]) => [placeId, medianIncomeByZip[zip]])
);
const PURPLES = [
"#fcfbfd",
"#efedf5",
"#dadaeb",
"#bcbddc",
"#9e9ac8",
"#807dba",
"#6a51a3",
"#54278f",
"#3f007d",
];
const makeHeatmapStyle = (placeId) => ({
strokeColor: incomeColorForPlaceId(placeId),
strokeOpacity: 1,
strokeWeight: 1.5,
fillColor: incomeColorForPlaceId(placeId),
fillOpacity: 0.25,
});
const incomeColorForPlaceId = (placeId) => {
// 9 colors, 8 thresholds → under $50k = PURPLES[0]; $50–75k = PURPLES[1]; … $225k+ = PURPLES[8]
const BIN_THRESHOLDS = [50000, 75000, 100000, 125000, 150000, 175000, 200000, 225000];
const income = incomeByPlaceId[placeId];
if (income == null) return null;
const i = BIN_THRESHOLDS.findIndex((t) => income < t);
return PURPLES[i === -1 ? PURPLES.length - 1 : i];
};
const formatCurrency = (value) =>
new Intl.NumberFormat("en-US", {
style: "currency",
currency: "USD",
maximumFractionDigits: 0,
}).format(value);
export default function SFMedianHHIncomeHeatmap() {
const map = useMap();
const hoveredIdRef = useRef(null);
const clickedIdRef = useRef(null);
const [selected, setSelected] = useState(null);
useEffect(() => {
if (!map) return;
const layer = map.getFeatureLayer("POSTAL_CODE");
if (!layer) {
console.warn(
"POSTAL_CODE feature layer not available. " +
"Check that your Map ID has the Postal Code layer enabled.",
);
return;
}
const applyStyles = () => {
layer.style = (params) => {
const placeId = params.feature.placeId;
if (!SF_ZIP_PLACEIDS.has(placeId)) return null;
const base = makeHeatmapStyle(placeId);
if (placeId === clickedIdRef.current) return { ...base, fillOpacity: 0.75 };
if (placeId === hoveredIdRef.current) return { ...base, strokeWeight: 2.5 };
return base;
};
};
applyStyles();
const moveListener = layer.addListener("mousemove", (e) => {
const placeId = e.features[0]?.placeId;
const next = SF_ZIP_PLACEIDS.has(placeId) ? placeId : null;
if (next !== hoveredIdRef.current) {
hoveredIdRef.current = next;
applyStyles();
map.getDiv().style.cursor = next ? "pointer" : "";
}
});
const mapMoveListener = map.addListener("mousemove", () => {
if (hoveredIdRef.current !== null) {
hoveredIdRef.current = null;
applyStyles();
map.getDiv().style.cursor = "";
}
});
const clickListener = layer.addListener("click", async (e) => {
const feature = e.features[0];
const placeId = feature?.placeId;
if (!SF_ZIP_PLACEIDS.has(placeId)) return;
const isDeselecting = placeId === clickedIdRef.current;
clickedIdRef.current = isDeselecting ? null : placeId;
applyStyles();
if (isDeselecting) {
setSelected(null);
return;
}
const position = { lat: e.latLng.lat(), lng: e.latLng.lng() };
setSelected({ placeId, position, place: null });
try {
const place = await feature.fetchPlace({
fields: ["displayName", "formattedAddress", "types"],
});
if (clickedIdRef.current !== placeId) return;
setSelected({ placeId, position, place });
} catch (err) {
console.error("fetchPlace failed:", err);
}
});
return () => {
layer.style = null;
moveListener.remove();
mapMoveListener.remove();
clickListener.remove();
map.getDiv().style.cursor = "";
};
}, [map]);
return selected ? (
{
clickedIdRef.current = null;
setSelected(null);
}}
>
{selected.place ? (
<>
{selected.place.displayName ?? "Unknown"}
Place ID: {selected.placeId}
Median Income: {formatCurrency(incomeByPlaceId[selected.placeId])}
) : (
<>
Place ID: {selected.placeId}
Loading details…
)}
) : null;
}
```
### What's next in data driven styling
What makes using [data driven styling for boundaries](https://developers.google.com/maps/documentation/javascript/dds-boundaries/overview?ref=blog.afi.io) to create a heatmap in Google Maps special is that there's no GeoJSON anywhere. The polygons come from Google's own `POSTAL_CODE` feature layer, so the boundaries are always current and the entire visualization is a style function plus a 27 row lookup table mapping Place IDs to median household income figures. But what if you want to visualize data on boundaries Google doesn't have? That's where [data driven styling for datasets](https://developers.google.com/maps/tt/dds/maps-datasets?ref=blog.afi.io) comes in.
**This article was written by** [**Afi Labs**](https://afi.io/?ref=blog.afi.io)**, a** [**Google Maps Premier Partner**](https://www.afi.io/?ref=blog.afi.io) **and reseller. We build route optimization, navigation, and fleet tracking software on Google Maps, and offer volume pricing on GMP licensing.** [**Talk to an engineer**](https://www.afi.io/contact%5Fus?ref=blog.afi.io) **or** [**follow Afian on LinkedIn**](https://www.linkedin.com/in/afian-anwar/?ref=blog.afi.io)**.**
Next: [Part 6: Upload and style datasets using the Maps Datasets API](https://www.afi.io/blog/upload-and-style-datasets-using-the-maps-datasets-api/?ref=blog.afi.io)