> ## Content Index
> Fetch the complete content index at: https://blog.afi.io/llms.txt
> Use this file to discover other available public pages before exploring further.
# Draw a Google Maps polyline in React
- URL: https://blog.afi.io/blog/draw-a-google-maps-polyline-in-react/
- Published: 2026-04-15T05:55:58.000Z
- Updated: 2026-08-21T05:10:34.000Z
- Description: Draw routes, paths or boundaries using Google Maps polylines in React with the @vis.gl/react-google-maps library.
- Author: Afian Anwar
- Tags: googlemaps
Markers are great for showing *where* something is. But to show *how* to get there, you need polylines. In this post, we'll cover what polylines are, how to draw them on a Google Map in React, which Google Maps APIs return them, and how to color individual segments to show traffic congestion on a route.
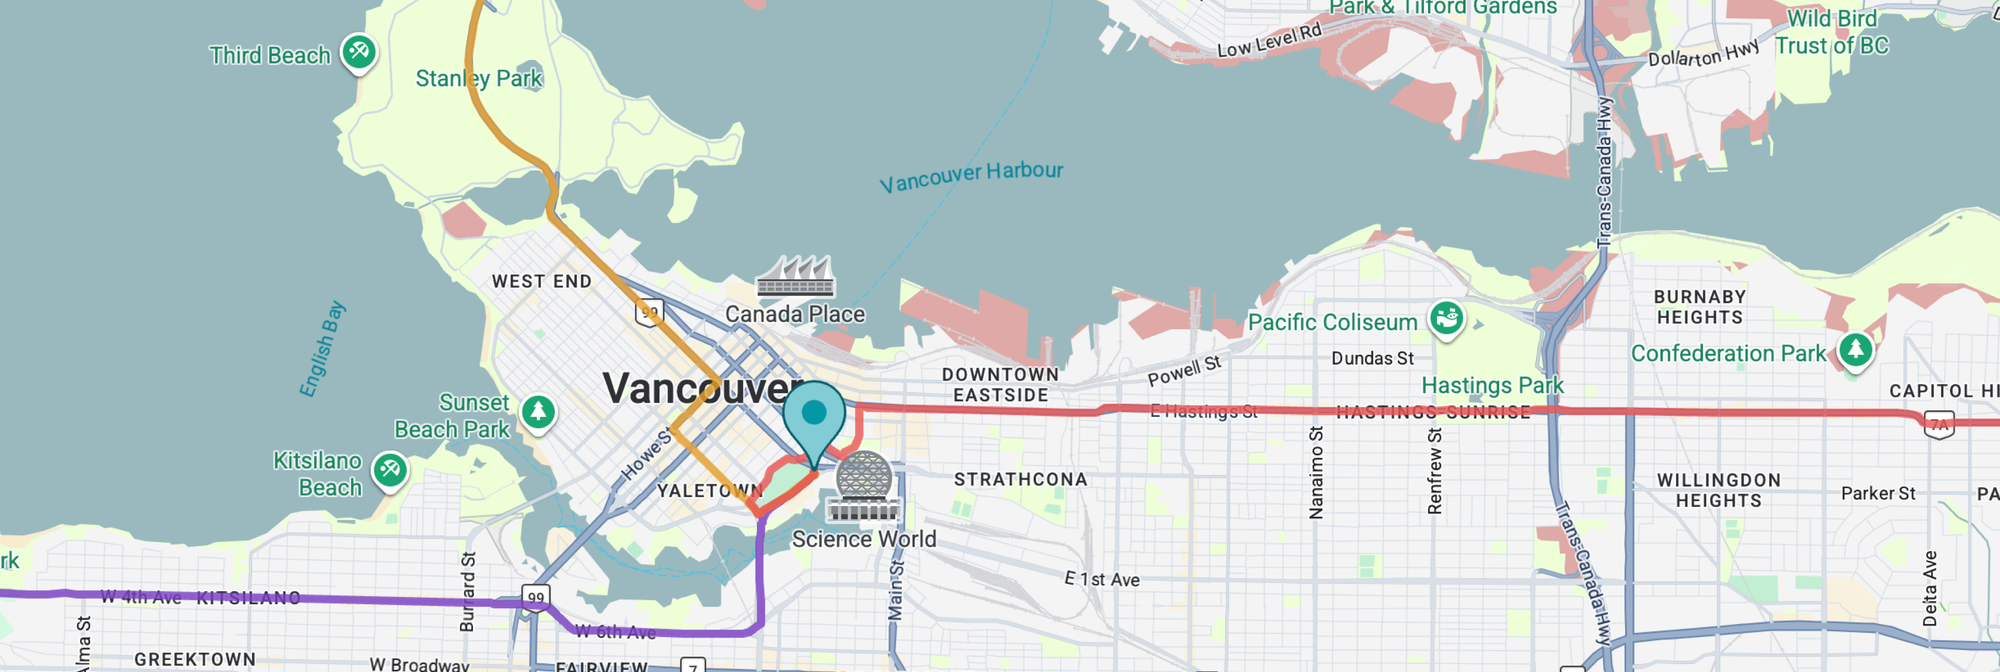
Part 1: [React Google Maps: Build with Google Maps using React](https://blog.afi.io/blog/react-google-maps-build-with-google-maps-using-react/)
Part 2: [Google Maps with React: Add a Google Map and style it](https://blog.afi.io/blog/react-google-maps-build-with-google-maps-using-react/)
Part 3: [Work with Google Maps React map markers and info windows](https://blog.afi.io/blog/work-with-google-maps-react-map-markers-and-info-windows/)
**Part 4: Draw a Google Maps polyline in React (this article)**
Part 5: [Three ways to add Google Autocomplete to your React app](https://blog.afi.io/blog/three-ways-to-add-google-autocomplete-to-your-react-app/)
[Routes API DemoUse the Google Routes API to find the shortest route between an origin and destination](https://routes-api-demo.afi.dev/?ref=blog.afi.io)
### What is a Google Maps polyline?
A polyline is a sequence of connected line segments rendered as an overlay on a map. Any route or set of driving directions displayed in Google Maps is drawn using one.
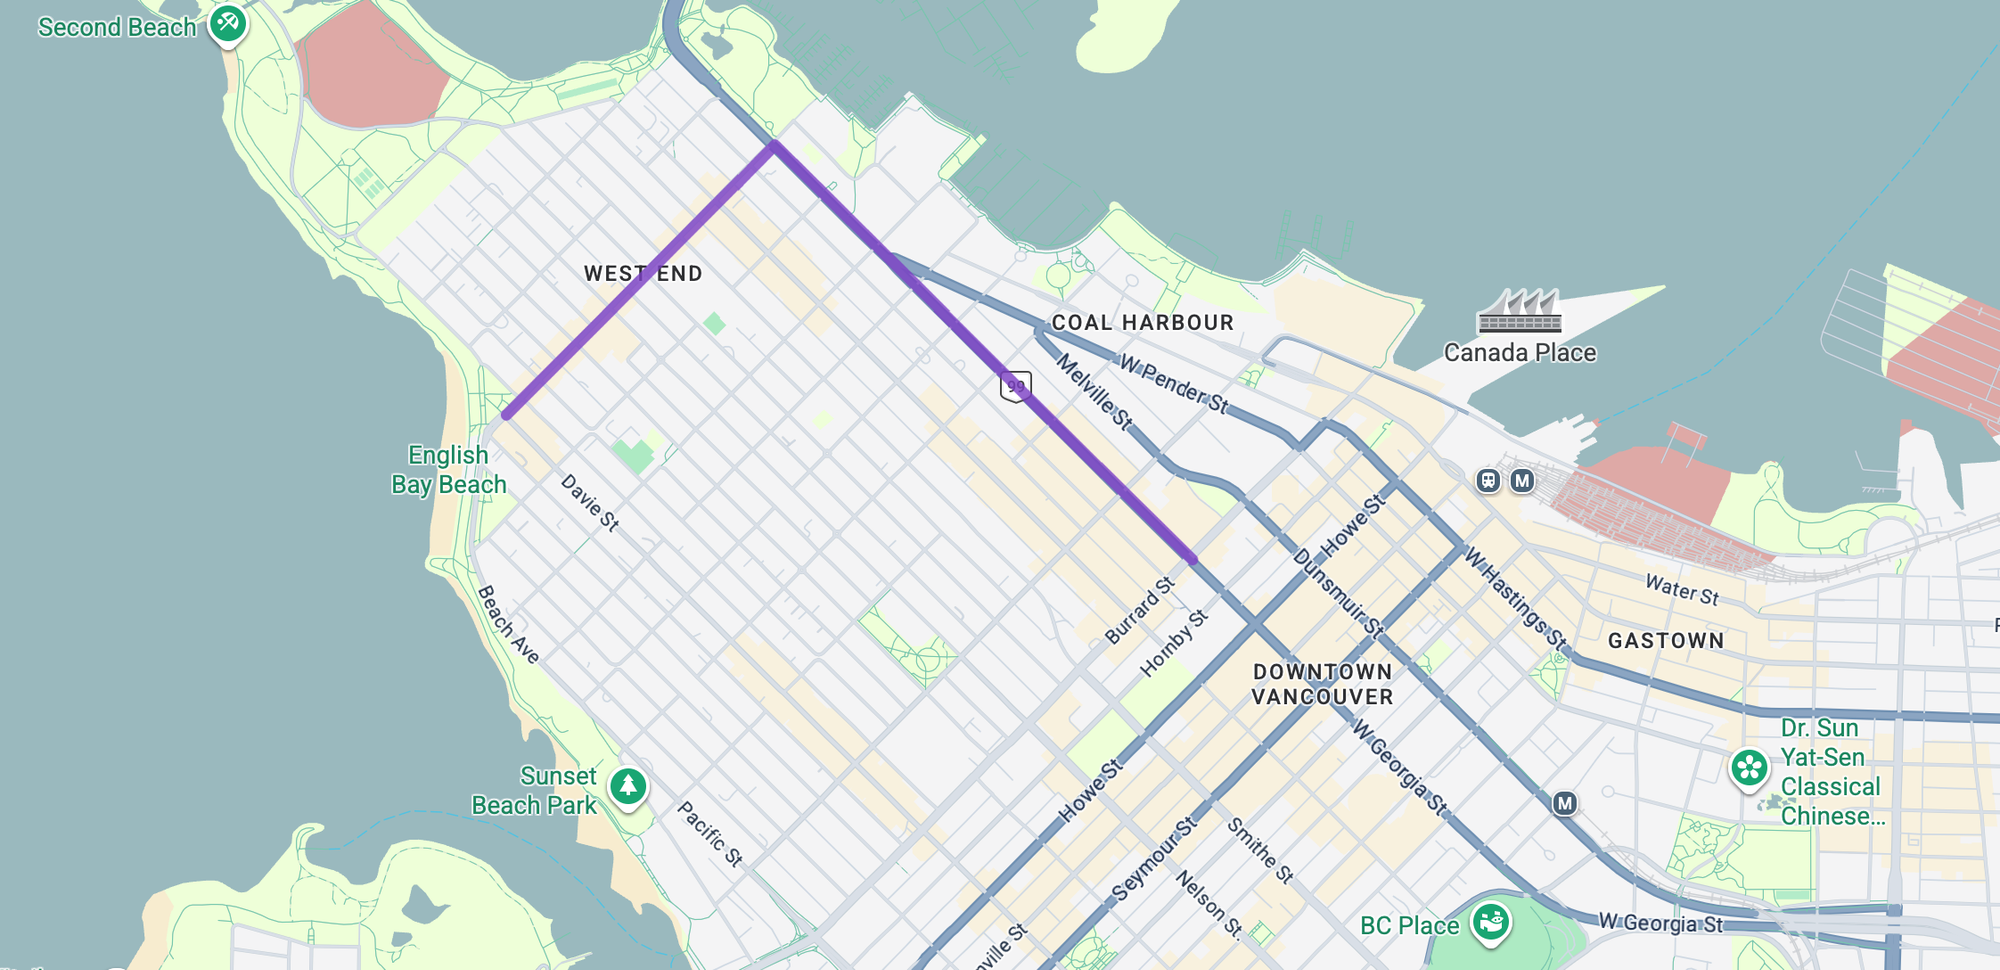
A simple Google Maps polyline added to the map layer
For developers, a Google Maps polyline is an instance of the `google.maps.Polyline` class ([docs](https://developers.google.com/maps/documentation/javascript/reference/polygon?ref=blog.afi.io#Polyline)). It takes a `path` (an ordered sequence of coordinates) along with styling options like color, weight, and opacity e.g. if using the `` component ([docs](https://visgl.github.io/react-google-maps/docs/api-reference/components/polyline?ref=blog.afi.io)) of the component from the [@vis.gl/react-google-maps](https://visgl.github.io/react-google-maps/?ref=blog.afi.io) library:
```
```
For brevity, a polyline can also be represented using an [encoded polyline](https://developers.google.com/maps/documentation/utilities/polylinealgorithm?ref=blog.afi.io) string e.g.
```
```
Unlike a polygon, polylines have a start and end point that doesn't close back on itself.
### How do you get a Google Maps polyline?
There are three main ways to get data to create a polyline:
**By collecting GPS coordinates using telematics**
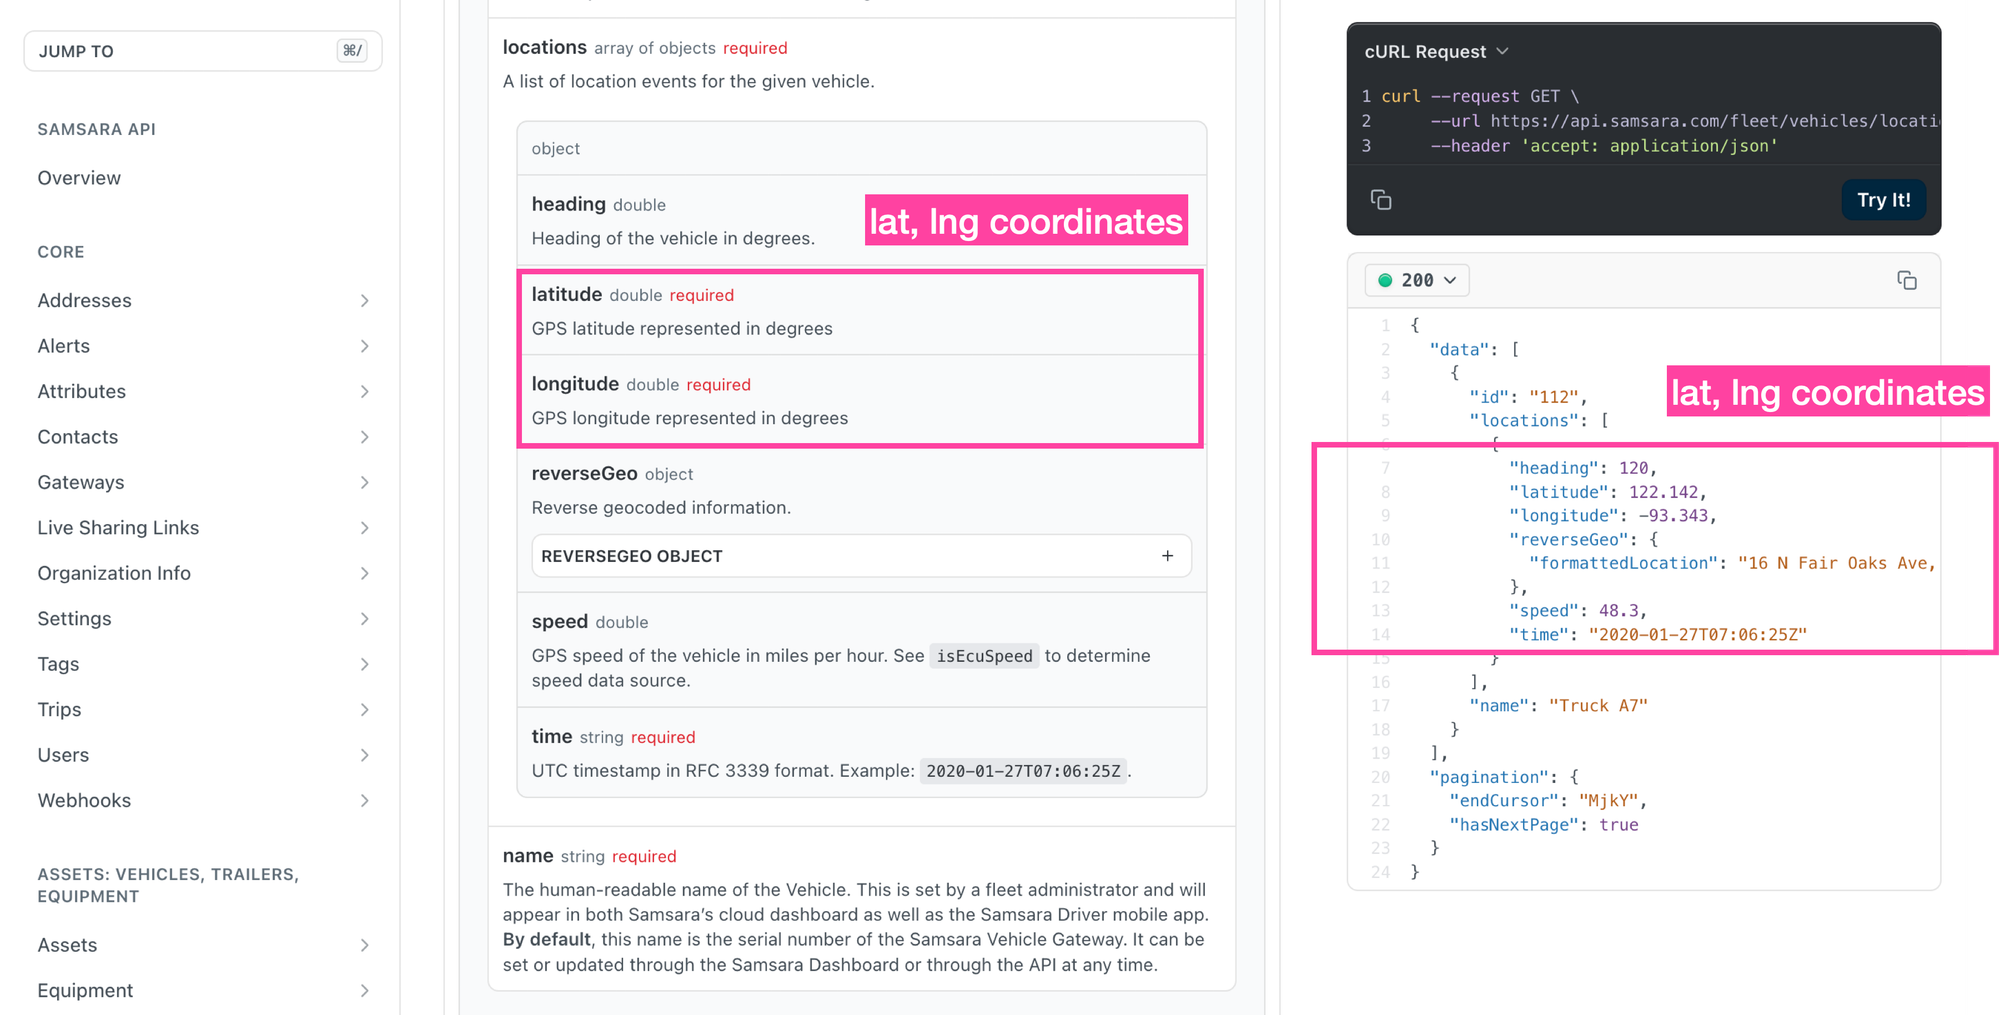
Retrieving GPS coordinates using the Samsara API
Telematics and fleet management platforms like [Geotab](https://www.geotab.com/?ref=blog.afi.io), [Samsara](https://www.samsara.com/?ref=blog.afi.io) or [Verizon Connect](https://www.verizonconnect.com/?ref=blog.afi.io) collect vehicle location data and expose it via export or API. To render a route polyline from this data, you extract the GPS coordinates into an array, convert each coordinate pair into a `google.maps.LatLng` object, and pass the resulting array to the `path` prop of ``.
**From known points on a route**
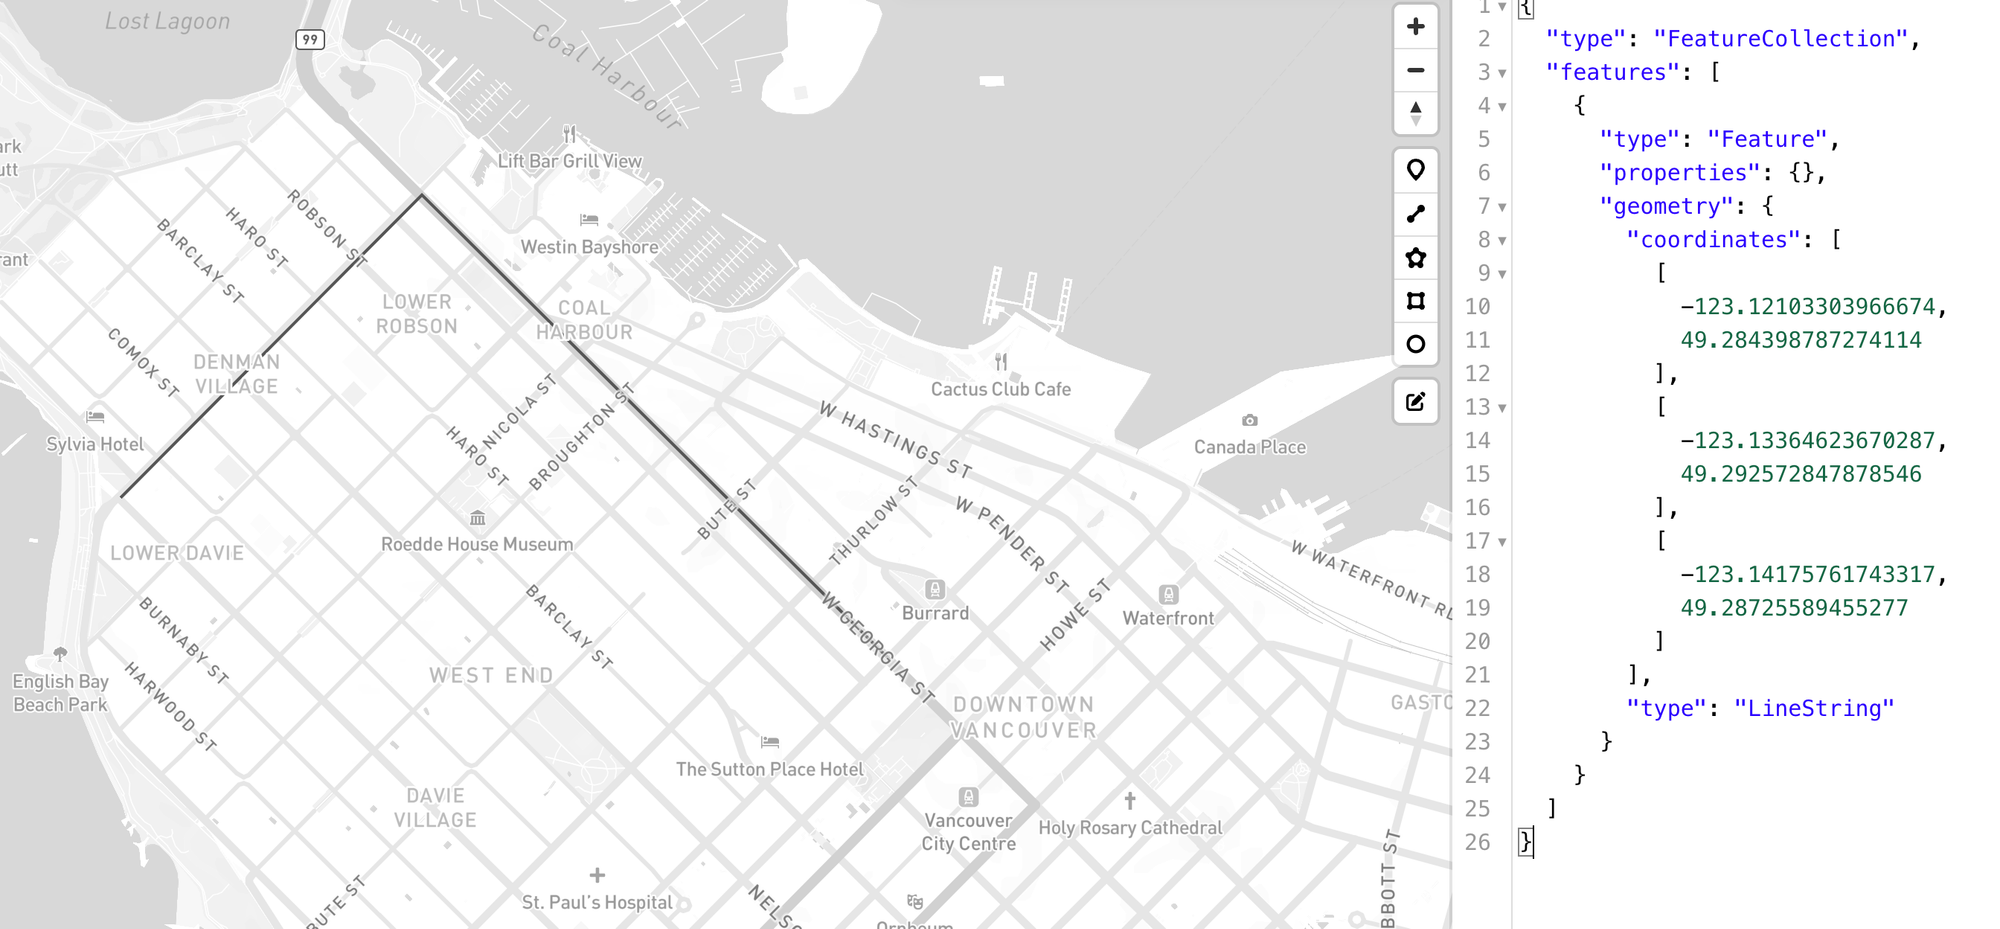
Building a route polyline manually using geojson.io
You can easily use free and open source tools like [geojson.io](https://geojson.io/?ref=blog.afi.io) to draw points, lines, and routes directly on a map and generate the corresponding [GeoJSON](https://en.wikipedia.org/wiki/GeoJSON?ref=blog.afi.io). With that, you can extract the latitude and longitude pairs from the `coordinates` array (take note that GeoJSON format uses longitude, latitude, so you will need to switch the order up when converting into a `LatLng` object which uses latitude, longitude) and pass the resulting array to the `path` prop of ``.
You can also use a tool like [geojson.io](https://geojson.io/?ref=blog.afi.io) to draw a route directly on a map and export it as [GeoJSON](https://en.wikipedia.org/wiki/GeoJSON?ref=blog.afi.io). To use it with Google Maps, extract the coordinate pairs from the `coordinates` array and convert them into `google.maps.LatLng` objects, then pass the resulting array to the `path` prop of ``.
⚠️
GeoJSON orders coordinates as `[longitude, latitude]` \- the reverse of Google Maps `LatLng(latitude, longitude)`, so make sure to swap the order during conversion.
**By calling the Google Maps Route API or GMPRO**
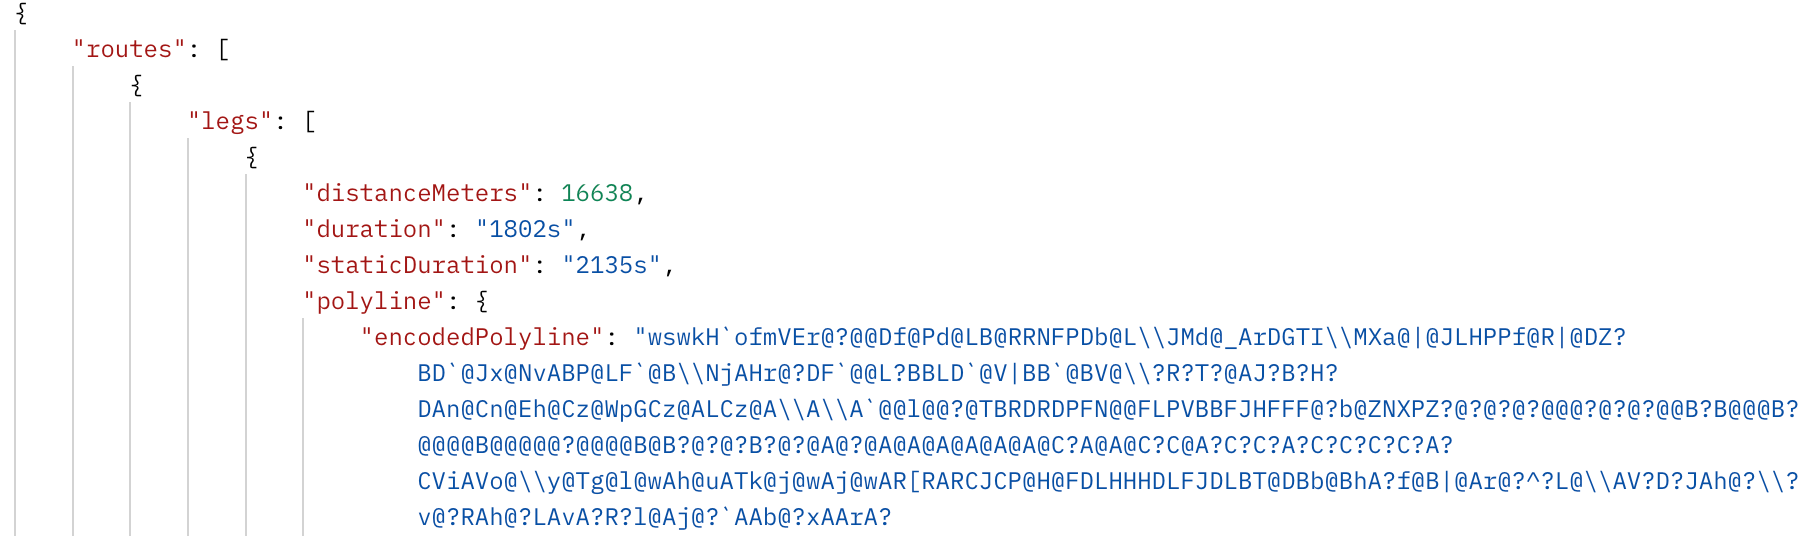
The response from the Routes API includes an encoded polyline string
Both the Google Maps [Routes API](https://blog.afi.io/blog/a-developers-guide-to-the-google-routes-api/) and [Route Optimization API](https://blog.afi.io/blog/gmpro-google-maps-platform-route-optimization-api/) return an encoded polyline string in their response, which you can pass directly to the `encodedPath` prop of `` to render the route.
### Adding a Google Maps polyline to a map and styling it
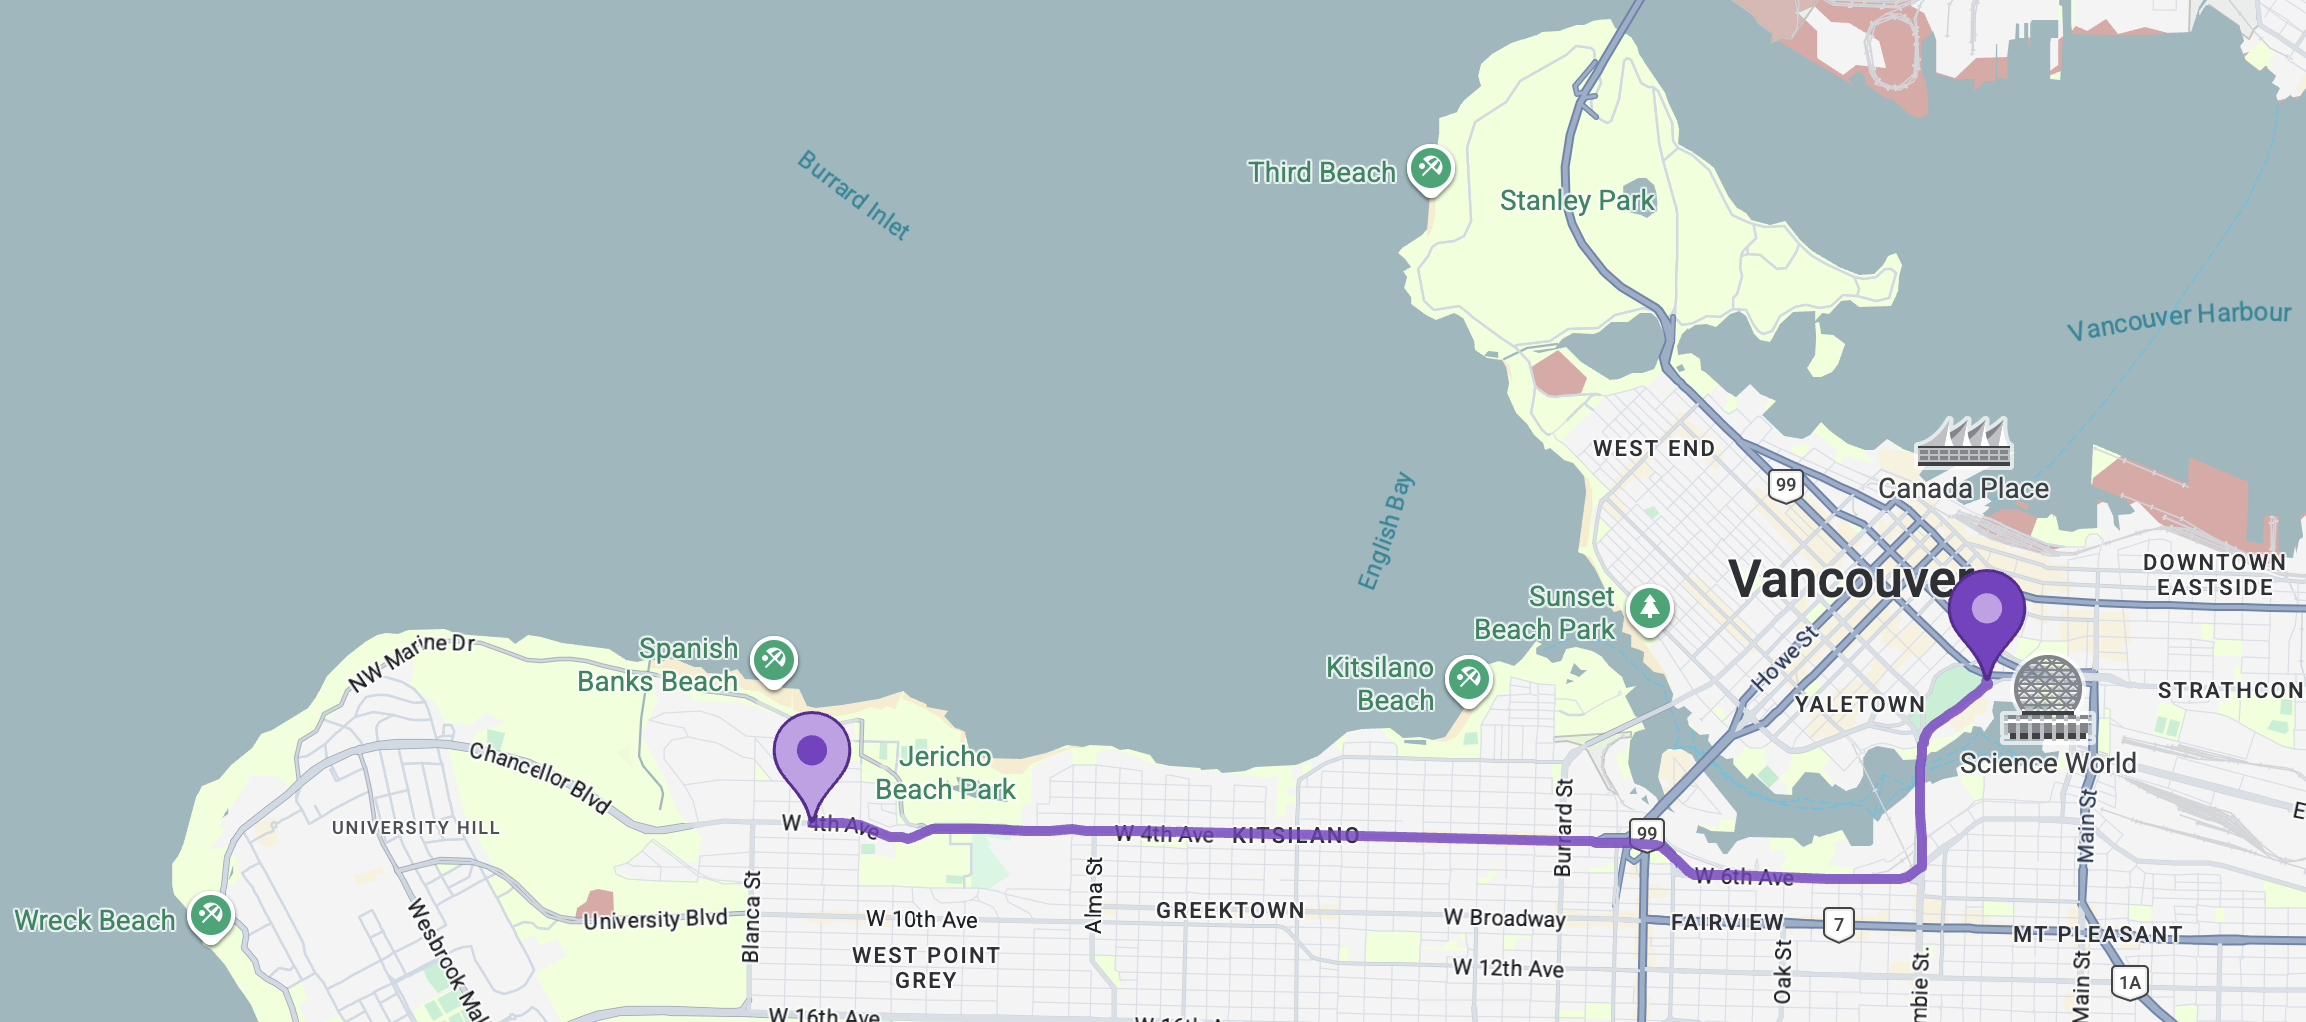
A styled Google Maps polyline (purple) with two markers
Once you have coordinate data, either as a `LatLng` array or an encoded polyline string, adding a polyline to a Google Map is straightforward. The following example renders a route using an encoded polyline string saved to the `routePolyline` constant:
```
/*** App.jsx **/
import { APIProvider } from "@vis.gl/react-google-maps";
import { Map } from "@vis.gl/react-google-maps";
import { AdvancedMarker, Pin } from "@vis.gl/react-google-maps";
import { Polyline } from "@vis.gl/react-google-maps";
import "./App.css";
const routePolyline =
"ozukHjm_oV@uA?iA@w@@qB?g@@W?_A@q@D_C?[?cA?Q@M?OBMB[XoBTuANeARuAZqB?ADYDW@S@CB_@@a@?C@I@gA?e@?ADY@OAo@Cc@Ea@COCKCOEUUmAOw@?A[eBESCUCUAYASAU?Q?e@@Q?u@?w@@k@@eD?M@kA@_@@aABaG@[@iCDyBCUDiE@oA@o@?i@?S@}B?o@?a@?o@?UA}@C}@AgA?m@Ee@?sE?[@m@?Y@gC?q@?aBBaCB{G@wA@oA@aE?]BgE@yB@mADmK?WBmI@[?U@eD@gD@_@@{I@M@{DBeI@_A@_D@qB?}A@{DDkJ?Q?u@BiI@w@?W@qB@gC@kC?A@u@@{B?sABuE@y@FsM@kDBkHDaK?aB@w@BiI@_B@_A?{@B{DBgC?e@@qABuI?a@?k@D_@@M@O@K@wD@mC?[@m@?m@?o@?]@c@?c@?CBkA@yA@w@?O?_@@W?W?_@?U@Y@Q?K@I@E?C@IBOBI@IBIDOFOZm@n@oAd@}@JY?ABERc@P_@\\m@\\o@LWLYVi@Ni@?CF[DU?yA@cA@mB?w@@gA@iDCUFgMDsG?u@BuCDqL?w@@{E?e@D]@E?G?m@@iB?e@BgE@}A@aA?uG?E?EAG?Q@yC@q@Co@?UC_@C_@CQEW?ASiAIWUk@i@wAEIQe@M]KUW@_A@m@@q@@[@G?Q?a@FU@G?G?w@BwABE@wADU@G@QDsDGeAE_@?q@?E?w@AsBCYAW?i@Ag@E]?]AWMMEMAIAMAA?OACAKAIAEAEAKESKMGKKKKEEACACIKMWGMEKEOGQCGW_AY_AKWEOEMCICKGMGMGEMKq@mBIUIUACGQGM?AIQi@wAEIKU_@aAEMGOUi@O_@k@wAMa@Si@QEGAG?A?E@G@G@?@";
function App() {
return (
);
}
export default App;
```
By default the polyline renders as a blue line. You can customize its appearance using the following props (see the [PolylineOptions interface](https://developers.google.com/maps/documentation/javascript/reference/polygon?ref=blog.afi.io#PolylineOptions) for a full list):
`strokeColor` is the color of the polyline.
`strokeOpacity` a number between 0 and 1.0 that determines the opacity (0 is fully transparent, 1 is fully opaque) of the polyline.
`strokeWeight` is the thickness of the polyline.
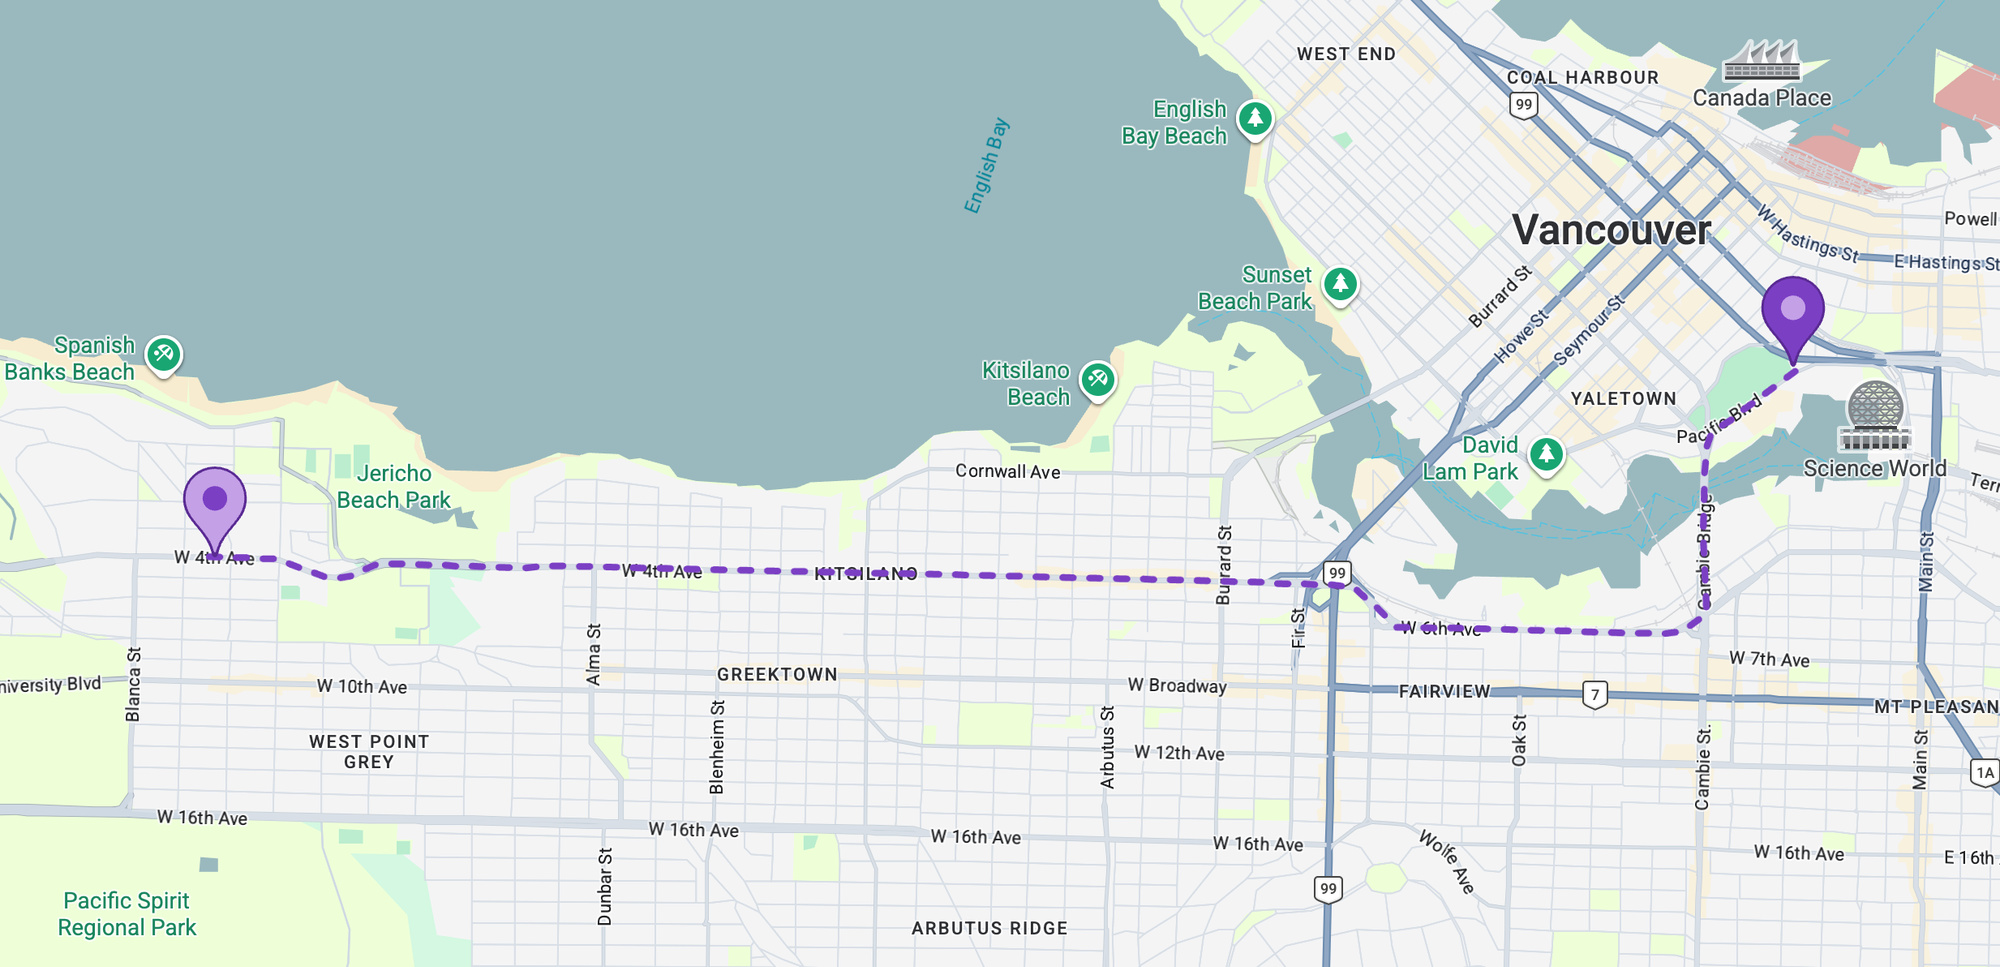
The Google Maps polyline rendered as a dashed line
If you want to render the polyline as a dashed or dotted line, you can use the `icons` prop, which lets you repeat a symbol (or an inline SVG) along the path at a set interval.
```
```
Two key things to note: `strokeOpacity={0}` hides the underlying solid line, and `repeat` controls the spacing between dots.
### Showing real time traffic on a Google Maps polyline
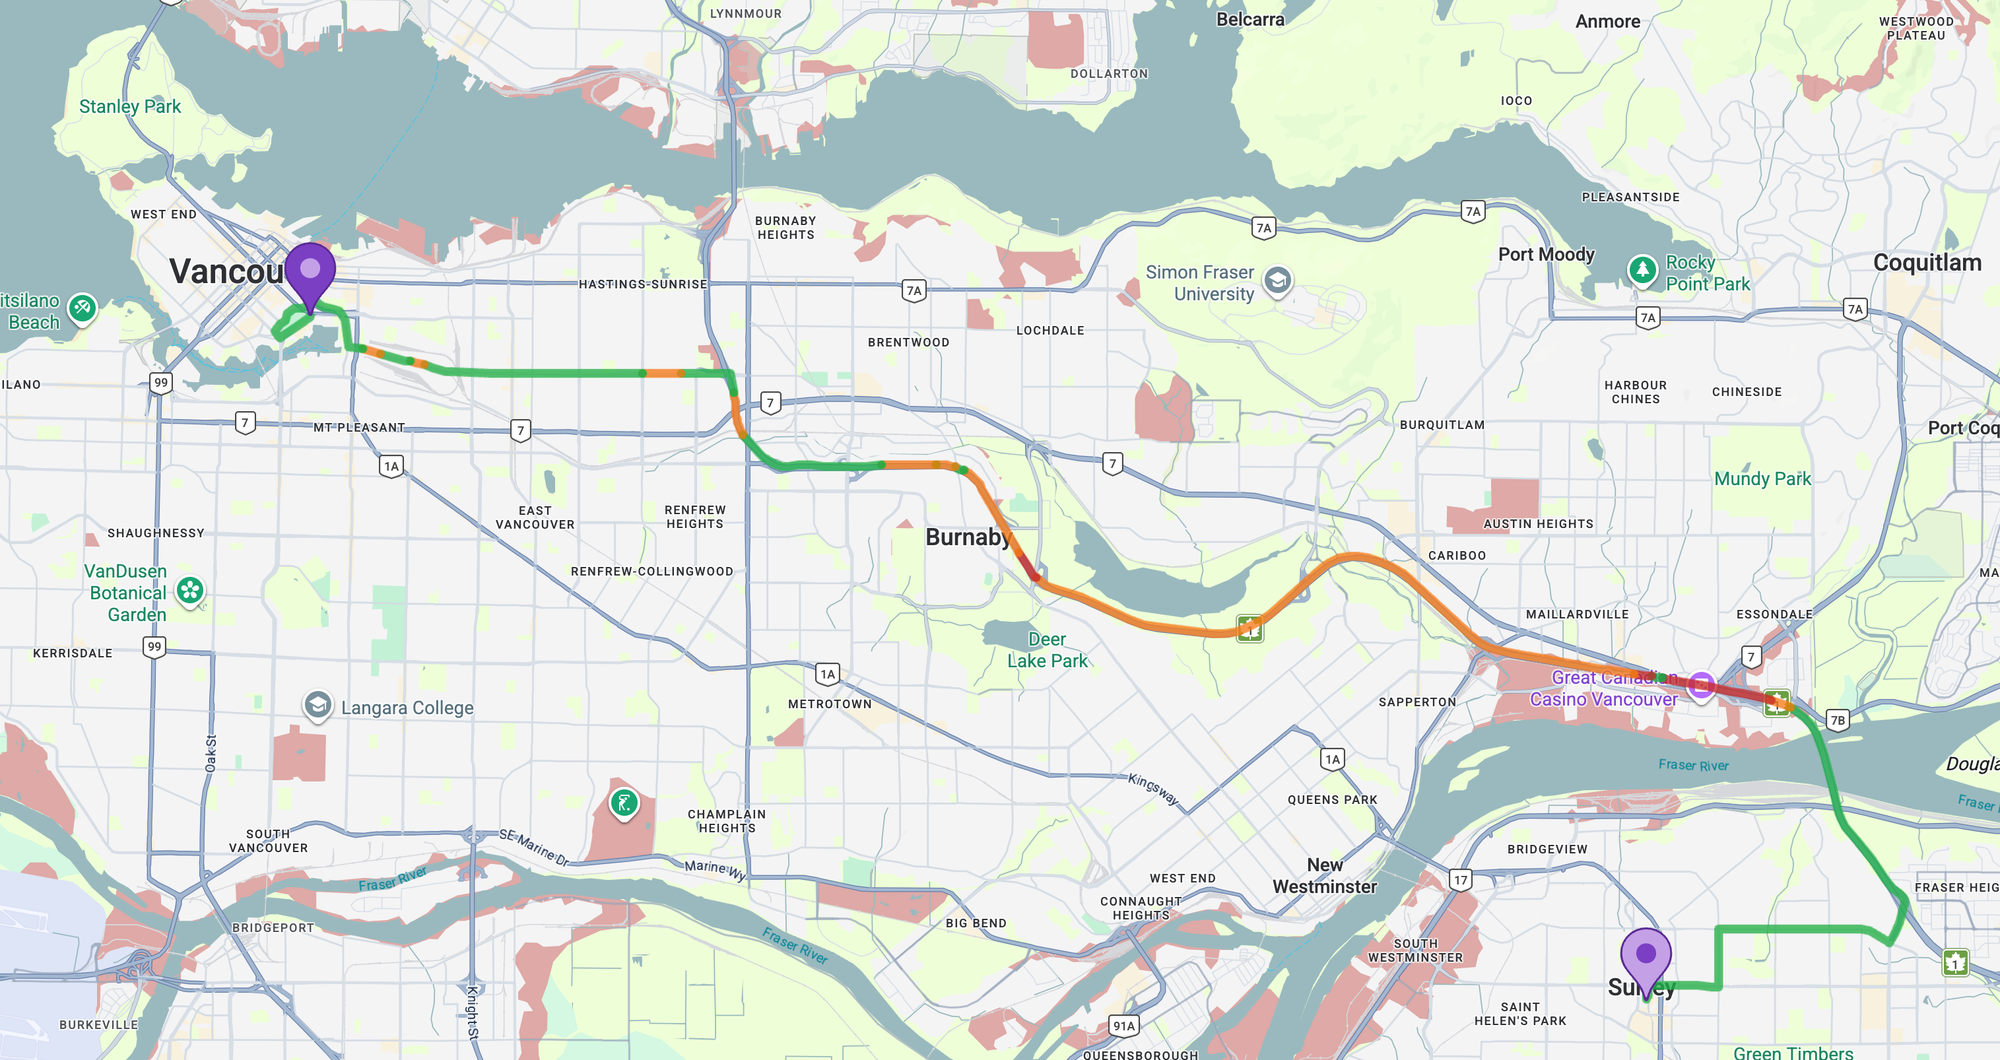
Real time traffic data added to a Google Maps polyline
To display real time traffic congestion on your polylines just like in the [Google Maps app](https://www.google.com/maps?ref=blog.afi.io), here's what you need to do:
1. Request driving directions from the Google Maps [Routes API](https://developers.google.com/maps/documentation/routes?ref=blog.afi.io) (not the older Directions API) with `"extraComputations": "TRAFFIC_ON_POLYLINE"` and `"routingPreference": "TRAFFIC_AWARE"`.
2. The response will include a `travelAdvisory.speedReadingIntervals` array, where each interval has a `startPolylinePointIndex`, `endPolylinePointIndex`, and a `speed` value (`NORMAL`, `SLOW`, or `TRAFFIC_JAM`).
```
{
"speedReadingIntervals": [
{
"startPolylinePointIndex": 0,
"endPolylinePointIndex": 84,
"speed": "NORMAL"
},
{
"startPolylinePointIndex": 84,
"endPolylinePointIndex": 87,
"speed": "SLOW"
},
{
"startPolylinePointIndex": 87,
"endPolylinePointIndex": 95,
"speed": "TRAFFIC_JAM"
}]
}
```
1. Decode the full polyline into a `LatLng` array.
```
const decodePath = (encodedPath) => {
return geometryLibrary.encoding.decodePath(encodedPath).map((point) => ({
lat: point.lat(),
lng: point.lng(),
}));
};
```
1. Split the polyline into segments by using the start and end indices from each speed interval to slice the decoded coordinate array into separate sub arrays.
```
const newPolylines = route.travelAdvisory.speedReadingIntervals.map(
(interval) => {
const newPoints = polylinePoints.slice(
interval.startPolylinePointIndex,
interval.endPolylinePointIndex + 1,
);
//... return statement (in step 5 below goes here)
},
);
```
1. Re-encode each coordinate segment back into an encoded polyline string and assign a color based on its `speed` value.
```
const SPEED_COLORS = {
SLOW: "#F57C00",
NORMAL: "#00B248",
TRAFFIC_JAM: "#C62828",
};
return {
path: geometryLibrary.encoding.encodePath(newPoints),
options: {
strokeColor: SPEED_COLORS[interval.speed] || SPEED_COLORS.NORMAL,
strokeWeight: 6,
},
};
```
1. Render a separate `` for each segment. Each segment gets its own `` with its encoded sub-polyline passed to the `encodedPath` prop and its corresponding color as `strokeColor`.
```
{
polylines.map((polyline, index) => (
));
}
```
Full source code for the steps above can be found at [react\_google\_maps\_demo](https://github.com/afilabs/react%5Fgoogle%5Fmaps%5Fdemo?ref=blog.afi.io). If you want to see how traffic aware polylines are implemented in a production app, check out [https://routes-api-demo.afi.dev/](https://routes-api-demo.afi.dev/?ref=blog.afi.io) and its corresponding GitHub repository, [routes\_api\_demo](https://github.com/afilabs/routes%5Fapi%5Fdemo?ref=blog.afi.io).
### The best way to learn React
It's tempting to let AI write your code, but you won't learn much that way. A better approach is to study examples (whether AI generated or from the code samples on this blog) and then build the app yourself. If you're learning to build Google Maps apps with React specifically, the [example library](https://visgl.github.io/react-google-maps/examples?ref=blog.afi.io) from [@vis.gl/react-google-maps](https://visgl.github.io/react-google-maps/?ref=blog.afi.io) is an excellent starting point.
In the next section, I'll show you how to add a simple [address autocomplete](https://blog.afi.io/blog/work-with-google-maps-react-map-markers-and-info-windows/) text box to your Google Map.
**This article was written by** [**Afi Labs**](https://afi.io/?ref=blog.afi.io)**, a** [**Google Maps Premier Partner**](https://www.afi.io/?ref=blog.afi.io) **and reseller. We build route optimization, navigation, and fleet tracking software on Google Maps, and offer volume pricing on GMP licensing.** [**Talk to an engineer**](https://www.afi.io/contact%5Fus?ref=blog.afi.io) **or** [**follow Afian on LinkedIn**](https://www.linkedin.com/in/afian-anwar/?ref=blog.afi.io)**.**
Next: [Part 5: Three ways to add Google Autocomplete to your React app](https://blog.afi.io/blog/three-ways-to-add-google-autocomplete-to-your-react-app/)