> ## Content Index
> Fetch the complete content index at: https://blog.afi.io/llms.txt
> Use this file to discover other available public pages before exploring further.

# How to draw and view boundary data with OpenStreetMap OSM
- URL: https://blog.afi.io/blog/how-to-draw-and-view-boundary-data-with-openstreetmap-osm/
- Published: 2024-05-19T00:09:03.000Z
- Updated: 2025-08-15T15:10:38.000Z
- Description: Boundary mapping with OSM - drawing neighborhood and administrative boundaries on a map.
- Author: Afian Anwar
- Tags: osm

For my last post in our OpenStreetMap (OSM) and [OSM Nominatim API](https://nominatim.org/?ref=blog.afi.io) tutorial series, I'll show you how to use OSM to draw and view boundaries on a map. 

![](https://storage.ghost.io/c/c6/4d/c64da7e8-63a6-4cff-acdc-2782a6ebc377/content/images/2024/05/osm_nominatim_boundary_data_viewer.png)

Boundary data for Vancouver, BC, Canada drawn using OSM

Part 1: [OpenStreetMap OSM Nominatim API tutorial ](https://afi.io/blog/openstreetmap-osm-nominatim-api-tutorial/?ref=blog.afi.io)  
Part 2: [Run a free geocoder with Nominatim Docker](https://afi.io/blog/run-a-free-geocoder-with-nominatim-docker/?ref=blog.afi.io)  
Part 3: [Building a free geocoding and reverse geocoding service with OpenStreetMap](https://www.afi.io/blog/building-a-free-geocoding-and-reverse-geocoding-service-with-openstreetmap/?ref=blog.afi.io)   
**Part 4: How to draw and view boundary data with OpenStreetMap OSM (this article)**

In the first part of this blog post, I will explain how to use Nominatim's [search](https://nominatim.org/release-docs/latest/api/Search/?ref=blog.afi.io) and [lookup](https://nominatim.org/release-docs/latest/api/Lookup/?ref=blog.afi.io) endpoints to find and retrieve boundary data. In the second, I'll demonstrate how to build a simple web application that uses this data to draw boundaries on a map.

As with the other tutorials on this blog, full source code for this project, [openstreetmap-boundaries](https://github.com/afilabs/openstreetmap-boundaries?ref=blog.afi.io), can be found on GitHub.

### Why draw boundaries on a map?

Mapping out boundaries and territories on a map is beneficial for several reasons. For example, during the COVID-19 pandemic, the Centers for Disease Control and Prevention (CDC) in the United States managed a real-time heat map that displayed the rates and severity of COVID-19 infections, broken down by each county.

![The US CDC used boundary data to visualize the spread of the COVID-19 pandemic](https://storage.ghost.io/c/c6/4d/c64da7e8-63a6-4cff-acdc-2782a6ebc377/content/images/2024/05/Screen-Shot-2024-05-18-at-10.17.00-PM.png)

The US CDC used boundary data to visualize the spread of the COVID-19 pandemic

Field services e.g. utility companies, use boundary mapping to ensure that they are operating in the right areas while logistics companies often map out territories to prevent overlaps in service areas and ensure that each area is adequately serviced without redundancy.

### How do I view boundary data on a map?

The easiest way to view boundary data is to open [Google Maps](https://www.google.com/maps?ref=blog.afi.io) and type in the name of the area you want see. For example, searching for "Vancouver" brings up the territorial boundaries for the city of Vancouver, outlined in red dots.

![Boundary data shown on Google Maps](https://storage.ghost.io/c/c6/4d/c64da7e8-63a6-4cff-acdc-2782a6ebc377/content/images/2024/05/Screen-Shot-2024-05-17-at-12.24.28-AM.png)

Boundary data shown on Google Maps

However, if you want to use this data in your own mapping application, you're out of luck. Google Maps does not make this information available via API or in their search results.

### Retrieving Boundary Data from the OSM Nominatim API

Luckily, the [OSM Nominatim API](https://nominatim.org/?ref=blog.afi.io) comes to the rescue. Recall from my [last post ](https://www.afi.io/blog/building-a-free-geocoding-and-reverse-geocoding-service-with-openstreetmap?ref=blog.afi.io)that the [search endpoint](https://nominatim.org/release-docs/latest/api/Search/?ref=blog.afi.io) of the Nominatim API returns an array of objects, each representing a location. For example, the API call:

Method: `GET`

```
https://nominatim.openstreetmap.org/search?q=vancouver&format=jsonv2
```

returns three `place` objects matching the search string "Vancouver":

```JSON
[
    {
        "place_id": 330527268,
        "licence": "Data © OpenStreetMap contributors, ODbL 1.0. http://osm.org/copyright",
        "osm_type": "relation",
        "osm_id": 1852574,
        "lat": "49.2608724",
        "lon": "-123.113952",
        "category": "boundary",
        "type": "administrative",
        "place_rank": 16,
        "importance": 0.6869679506485442,
        "addresstype": "city",
        "name": "Vancouver",
        "display_name": "Vancouver, Metro Vancouver Regional District, British Columbia, Canada",
        "boundingbox": [
            "49.1989306",
            "49.3161714",
            "-123.2249611",
            "-123.0232419"
        ]
    },
    {
        "place_id": 329699655,
        "licence": "Data © OpenStreetMap contributors, ODbL 1.0. http://osm.org/copyright",
        "osm_type": "relation",
        "osm_id": 2249770,
        "lat": "49.592949450000006",
        "lon": "-125.70255696124094",
        "category": "place",
        "type": "island",
        "place_rank": 17,
        "importance": 0.5462423036464551,
        "addresstype": "island",
        "name": "Vancouver Island",
        "display_name": "Vancouver Island, British Columbia, Canada",
        "boundingbox": [
            "48.3088833",
            "50.8768322",
            "-128.4329230",
            "-123.2647607"
        ]
    },
    {
        "place_id": 284004308,
        "licence": "Data © OpenStreetMap contributors, ODbL 1.0. http://osm.org/copyright",
        "osm_type": "relation",
        "osm_id": 237278,
        "lat": "45.6306954",
        "lon": "-122.6744557",
        "category": "boundary",
        "type": "administrative",
        "place_rank": 16,
        "importance": 0.5264689419276137,
        "addresstype": "city",
        "name": "Vancouver",
        "display_name": "Vancouver, Clark County, Washington, United States",
        "boundingbox": [
            "45.5773887",
            "45.6980040",
            "-122.7745635",
            "-122.4645600"
        ]
    }
]
```

Two out of three of the returned items (`osm_id` 1852574 and 237278) are tagged with {"category": "boundary"}, indicating that these `place` objects represent administrative boundaries, not specific addresses or locations.

### OSM Nominatim API Lookup API

So how do we retrieve the boundary data associated with each location? The results returned above give us a `boundingbox` object but this is not enough to draw boundaries on a map. We need an ordered array of coordinates that we can connect together from start to end. Here's where the [Lookup endpoint](https://nominatim.org/release-docs/latest/api/Lookup/?ref=blog.afi.io) comes in handy. 

**Endpoint** `GET` [https://nominatim.openstreetmap.org/lookup?osm\_ids={\[N|W|R\] + osm\_id}&format={output\_format}&polygon\_geojson=1](https://nominatim.openstreetmap.org/search?q=999+canada+place&format=jsonv2&ref=blog.afi.io)

**{\[N|W|R\] + osm\_id}** is a comma-separated list of OSM ids each prefixed with its type, one of node (N), way (W) or relation (R). For example, to use the `place` object with `osm_id` 1852574, you would have to first check its type (it's a "relation") and then append the prefix ("R") to the `osm_id` like so: "R1852574".

**{output\_format}** determines the structure of the response and must be one of `xml`, `json`, `jsonv2`, `geojson`, `geocodejson`, the most common being `jsonv2`.

**polygon\_geojson=1** forces Nominatim to return the coordinates of the `place` object's boundary.

Here's a worked example of the Lookup API for `osm_id` 1852574 (Vancouver, Metro Vancouver Regional District, British Columbia, Canada):

Method: `GET`

```
https://nominatim.openstreetmap.org/lookup?osm_ids=R1852574&format=jsonv2&polygon_geojson=1
```

**Output**

```
[
    {
        "place_id": 330527268,
        "licence": "Data © OpenStreetMap contributors, ODbL 1.0. http://osm.org/copyright",
        "osm_type": "relation",
        "osm_id": 1852574,
        "lat": "49.2608724",
        "lon": "-123.113952",
        "category": "boundary",
        "type": "administrative",
        "place_rank": 16,
        "importance": 0.6869679506485442,
        "addresstype": "city",
        "name": "Vancouver",
        "display_name": "Vancouver, Metro Vancouver Regional District, British Columbia, Canada",
        "address": {
            "city": "Vancouver",
            "county": "Metro Vancouver Regional District",
            "state": "British Columbia",
            "ISO3166-2-lvl4": "CA-BC",
            "country": "Canada",
            "country_code": "ca"
        },
        "boundingbox": [
            "49.1989306",
            "49.3161714",
            "-123.2249611",
            "-123.0232419"
        ],
        "geojson": {
            "type": "Polygon",
            "coordinates": [
                [
                    [
                        -123.2249611,
                        49.2746236
                    ],
                    ... // 126 entries
                    [
                        -123.2249611,
                        49.2746236
                    ]
                ]
            ]
        }
    }
```

At last! We now have a `geojson` object with the boundary coordinates:

```
"geojson": {
            "type": "Polygon",
            "coordinates": [
                [
                    [
                        -123.2249611,
                        49.2746236
                    ],
                    ... // 126 entries
                    [
                        -123.2249611,
                        49.2746236
                    ]
                ]
            ]
        }
```

### Viewing boundary data on a map

To check that the boundary is correct, copy and paste the `geojson` object (above) into a new file (or download the gvrd-geojson.json file below), save it, and upload it to a geojson viewer such as [geojson.io](https://geojson.io/?ref=blog.afi.io). Here's what the map boundary from the Vancouver example above looks like:

![Polygon GeoJSON boundary data viewed on geojsion.io](https://storage.ghost.io/c/c6/4d/c64da7e8-63a6-4cff-acdc-2782a6ebc377/content/images/2024/05/Screen-Shot-2024-05-19-at-12.16.31-AM.png)

Polygon GeoJSON boundary data viewed on geojsion.io

[gvrd-geojsongvrd-geojson.json21 KBdownload-circle](https://blog.afi.io/content/files/2024/05/gvrd-geojson.json "Download")

### Building a boundary mapping tool with OpenStreetMap

Now that we know how to retrieve map boundary data from OSM Nominatim, the next step is to develop a web-based mapping tool to view the selected boundary (screenshot below).

![We are going to build this mapping tool to draw and view boundary data from OSM](https://storage.ghost.io/c/c6/4d/c64da7e8-63a6-4cff-acdc-2782a6ebc377/content/images/2024/05/osm_nominatim_boundary_data_viewer.png)

We are going to build this mapping tool to draw and view boundary data from OSM

[openstreetmap-boundaries](https://github.com/afilabs/openstreetmap-boundaries?ref=blog.afi.io) is a simple React app scaffolded with the [Create React App](https://create-react-app.dev/?ref=blog.afi.io) build kit. It only has two main components - a search bar in the top left corner and a full screen interactive map layer.

To set up the project on your local machine, follow these steps:

1. Clone the repository to your local system.
2. Open your terminal, navigate to the project directory, and execute `npm install` to install the necessary dependencies.
3. After the installation is complete, run `npm start` to launch the application.
4. You need to create a `.env` file in the root of your project directory. Add the following line to this file: `REACT_APP_MAPBOX_ACCESS_TOKEN={MAPBOX_ACCESS_TOKEN}`, replacing `{MAPBOX_ACCESS_TOKEN}` with your actual Mapbox API key, which you can [obtain from your Mapbox account](https://docs.mapbox.com/help/getting-started/access-tokens/?ref=blog.afi.io).
5. This Mapbox API key is used to display map tiles in the application.

### How our project is structured

I've designed [openstreetmap-boundaries](https://github.com/afilabs/openstreetmap-boundaries?ref=blog.afi.io) as a single page React app with one parent component (`App.jsx`) containing two child components (`CitySearch.jsx` and `MapBox.jsx`). The CitySearch component is responsible for letting users type in a search string and matching it with a valid city (or area) boundary e.g. "Vancouver", while `MapBox.jsx` renders a full page map and displays the city boundary based on the boundary coordinates retrieved from the Nominatim API.

![React parent and child components used in our OSM boundary data viewer](https://storage.ghost.io/c/c6/4d/c64da7e8-63a6-4cff-acdc-2782a6ebc377/content/images/2024/05/Screen-Shot-2024-05-21-at-5.55.34-PM.png)

React parent and child components used in our OSM boundary data viewer

In the parent component, `App.jsx`, we start with `const [coordinates, setCoordinates] = useState([]);` , which is a React hook that declares the `coordinates` global variable and a function to update it, called `setCoordinates`. `coordinates` is an array of latitude and longitude pairs that make up the city boundary.

```
/* components/App.jsx */
function App() {
  const [coordinates, setCoordinates] = useState([]);

  return (
    <div className="App">
      <div className="search">
        <CitySelect setCoordinates={setCoordinates} />
      </div>
      <div className="wrapper-map">
        <MapBox coordinates={coordinates} />
      </div>
    </div>
  );
}

export default App;
```

After that, we return JSX with the child <CitySelect/> and <MapBox/> components nested with in the parent <App/> component.

### Autocomplete search bar

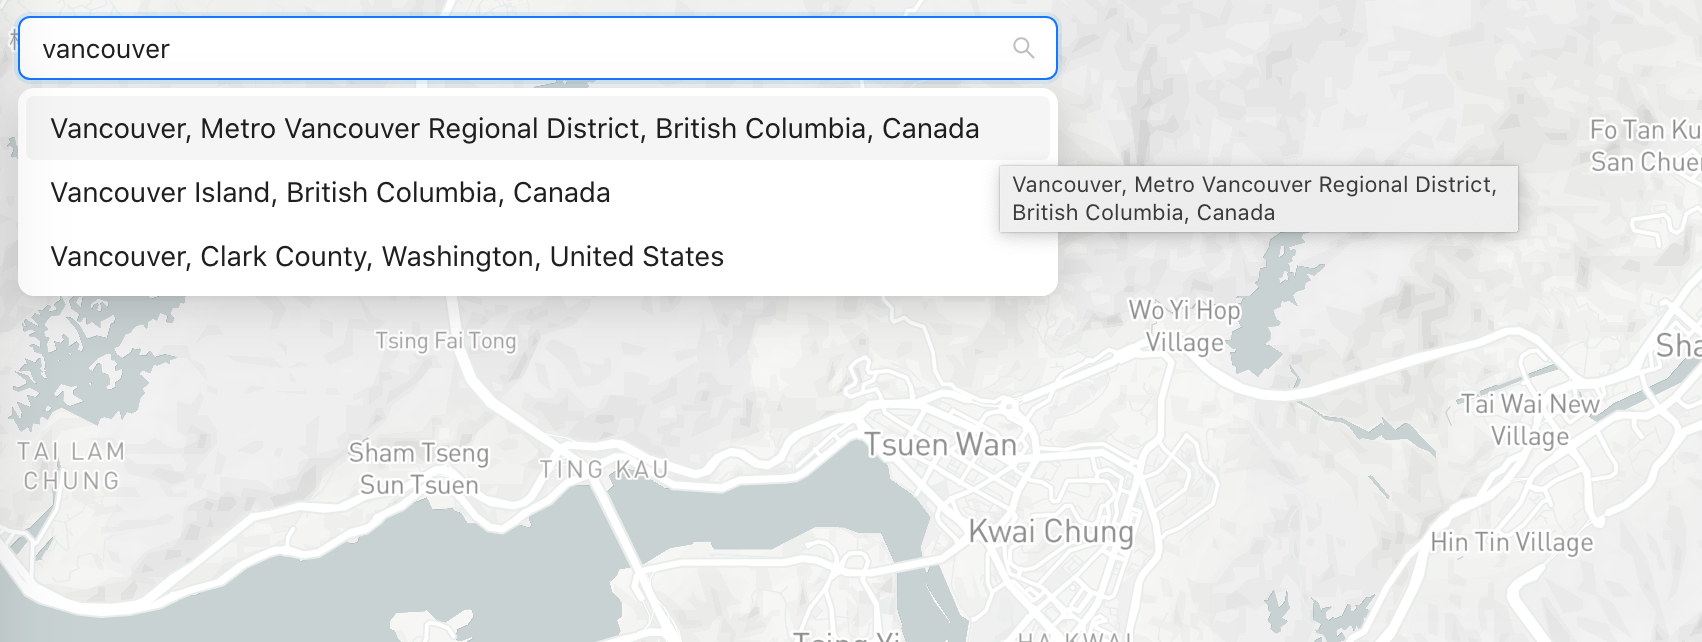
The <CitySearch/> search bar, located in the top left corner, allows users to search for and select administrative boundaries from the Nominatim database. It is built on top of the `<Select/>` component from the Ant Design UI library ([API reference](https://4x.ant.design/components/select/?ref=blog.afi.io)) and includes an autocomplete feature which provides boundary name suggestions as the user types. For instance, typing "vancouver" will display several matching results.
![Search bar with autocomplete built using the Ant Design <Select/> component](https://storage.ghost.io/c/c6/4d/c64da7e8-63a6-4cff-acdc-2782a6ebc377/content/images/2024/05/Screen-Shot-2024-05-19-at-4.22.02-PM.png)

Search bar with autocomplete built using the Ant Design <Select/> component

To enhance performance and reduce excessive API calls, the search bar features a [debouncing](https://medium.com/@dalibor.nerber/react-essentials-debouncing-requests-to-increase-performance-1413715a00b?ref=blog.afi.io) mechanism that introduces a brief delay after typing, ensuring that the API call to Nominatim is only made once the user has completed entering their search query. This is especially important because our app uses the rate-limited free version ([https://nominatim.openstreetmap.org/search.php](https://nominatim.openstreetmap.org/search.php?ref=blog.afi.io)) of the Nominatim API. If too many API calls are made in a short period, our app could be blocked.

### CitySelect.jsx

Here's a deep dive into what goes on in `CitySelect.jsx`

```
/* components/CitySelect.jsx */
<Select
  showSearch
  filterOption={false}
  value={selectedCity}
  placeholder="Select city"
  onSearch={debounceFetchListCity}
  notFoundContent={fetching ? <Spin size="small" /> : null}
  onChange={setSelectedCity}
  options={options}
  style={{ width: "100%" }}
/>;
```

The code above outlines the main functionality of the <CitySelect> component. Let's explore what happens behind the scenes when a user types in a city name, selects one from the list of matching terms, and clicks to confirm their choice.

`**onSearch={debounceFetchListCity}**` gets called when the user starts typing in the search input text box. The associated `debounceFetchListCity()` method then retrieves a list of cities (areas) that match the search text input. 

```
/* components/CitySelect.jsx */
const debounceFetchListCity = debounce(async (searchValue) => {
  setListCity([]);
  setOptions([]);

  if (searchValue?.length > 5) {
    try {
      setFetching(true);
      const response = await fetch(
        `https://nominatim.openstreetmap.org/search.php?q=${searchValue}&polygon_geojson=1&format=json`,
      );
      const body = await response.json();
      if (Array.isArray(body)) {
        setListCity(body);
        const options = body
          .filter((result) => result.geojson?.type === "Polygon")
          .map((result) => ({
            label: result.display_name,
            value: result.place_id,
          }));
        setOptions(options);
      }
    } catch (error) {
      console.error("Error fetching city list:", error);
    } finally {
      setFetching(false);
    }
  }
}, 800);
```

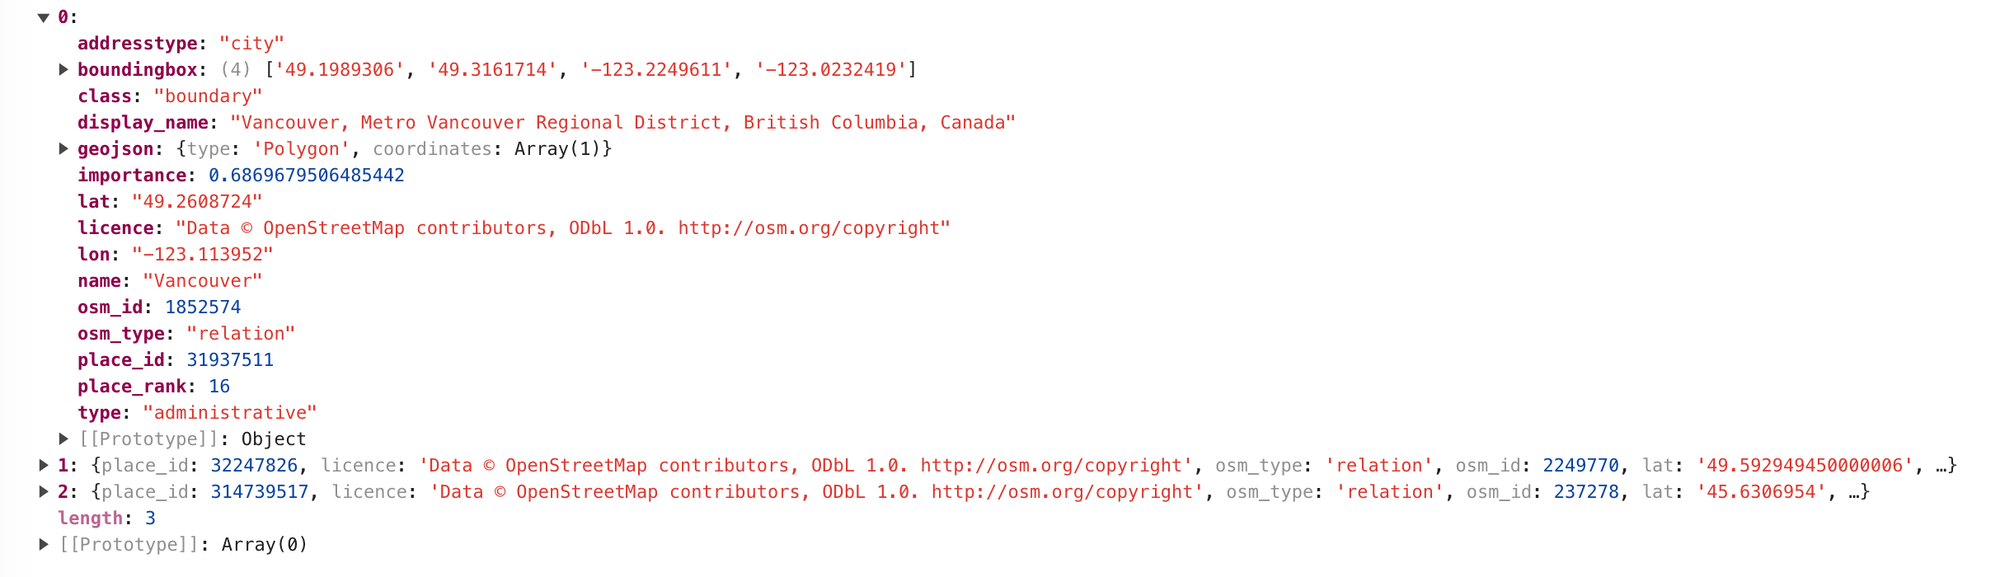
In this method, we first wait for a 800 millisecond (0.8 second) pause in typing before calling the [/search endpoint](https://afi.io/blog/building-a-free-geocoding-and-reverse-geocoding-service-with-openstreetmap/?ref=blog.afi.io) of the Nominatim API. If there's a match, the endpoint returns an array of matching `place` objects. For example, the text string "vancouver" returns an array of three objects:
![Response from the Nominatim API search endpoint for the text string "vancouver"](https://storage.ghost.io/c/c6/4d/c64da7e8-63a6-4cff-acdc-2782a6ebc377/content/images/2024/05/Screen-Shot-2024-05-21-at-10.07.26-PM.png)

Response from the Nominatim API search endpoint for the text string "vancouver"

`**options={options}**` provides the list of options that will be displayed in the dropdown of the search bar. `options` is mapped from the array returned by the Nominatim API. Each `option` object has a `label` and `value` that corresponds to `result.display_name` and `result.place_id` respectively.

![The filtered label - value pair used in the dropdown menu of the autocomplete search bar](https://storage.ghost.io/c/c6/4d/c64da7e8-63a6-4cff-acdc-2782a6ebc377/content/images/2024/05/Screen-Shot-2024-05-21-at-10.15.25-PM.png)

The filtered label - value pair used in the dropdown menu of the autocomplete search bar

`**onChange={setSelectedCity}**` gets called when the user selects a city. If the `selectedCity` variable changes, the `useEffect()` hook is called and this in turn updates the global `coordinates` variable with the latitude and longitude pairs that make up the boundary of newly chosen city.

```
/* components/CitySelect.jsx */
useEffect(() => {
  if (selectedCity) {
    const newCoordinates = listCities.find((el) => el.place_id === selectedCity)
      ?.geojson?.coordinates;
    setCoordinates(newCoordinates || []);
  }
  // console.log("new coords:" + newCoordinates);
}, [selectedCity]);

```

### MapBox.jsx

`MapBox.jsx` handles the map and boundary (polygon) rendering. As with my previous tutorials, I've decided to go with [Mapbox](https://www.mapbox.com/?ref=blog.afi.io) for the map layer used in this project but rather than go with its standard Javascript API, [Mapbox GL JS](https://docs.mapbox.com/mapbox-gl-js/guides/?ref=blog.afi.io), I've chosen to use the third party [react-map-gl](https://visgl.github.io/react-map-gl/?ref=blog.afi.io) wrapper so that I can easily inject data and style our map using [Source](https://visgl.github.io/react-map-gl/docs/api-reference/source?ref=blog.afi.io) and [Layer](https://visgl.github.io/react-map-gl/docs/api-reference/layer?ref=blog.afi.io) components like so:

```JSX
<Map>
  <Source>
    <Layer/>
  </Source>
</Map>
```

When the `coordinates` array is updated (e.g. when the user selects a new city from the search bar `CitySelect.jsx`), the `MapBox.jsx` component is redrawn with new boundary data injected into the <Source/> component as a [GeoJSON](https://datatracker.ietf.org/doc/html/rfc7946?ref=blog.afi.io) polygon, centered at its mid point. 

```
<Source
  type="geojson"
  data={{
    type: "Feature",
    geometry: {
      type: "Polygon",
      coordinates: coordinates,
    },
  }}
>
  <Layer
    {...{
      id: "layer-fill",
      type: "fill",
      paint: {
        "fill-outline-color": "white",
        "fill-color": "#E14C48",
        "fill-opacity": 0.15,
      },
    }}
  />
  <Layer
    {...{
      id: "layer-line",
      type: "line",
      paint: {
        "line-color": "#000",
        "line-width": 3,
      },
    }}
  />
</Source>;

```

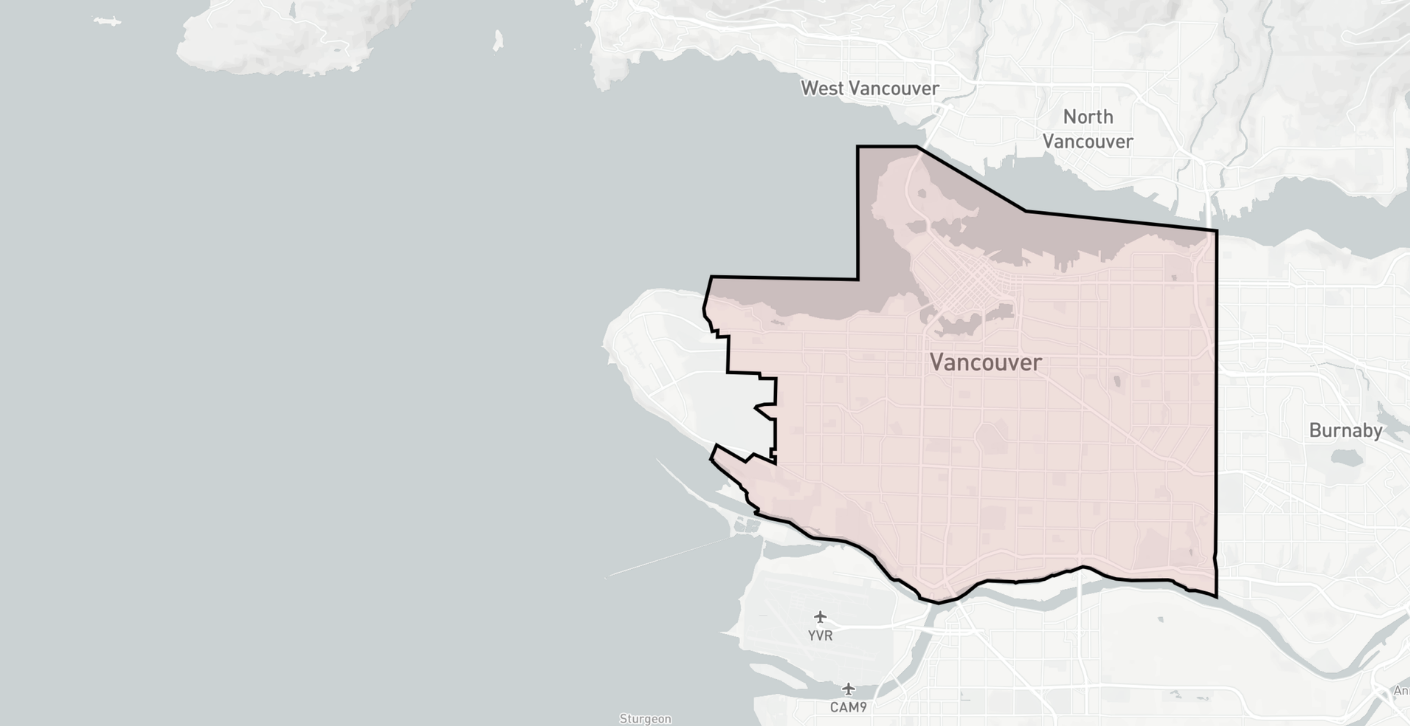
The borders of the polygon are thick ("line-width": 3) black ("line-color": #000) with a light pink ("fill-color": "#E14C48", "fill-opacity": 0.15) fill.
![Borders of the polygon returned by the OSM Nominatim API boundary data](https://storage.ghost.io/c/c6/4d/c64da7e8-63a6-4cff-acdc-2782a6ebc377/content/images/2024/05/Screen-Shot-2024-05-22-at-12.49.00-PM.png)

Borders of the polygon returned by the OSM Nominatim API boundary data

To run this demo locally on your machine, clone this [project's repository](https://github.com/afilabs/openstreetmap-boundaries?ref=blog.afi.io) and in your terminal, run `npm install` to install dependencies followed by `npm start` to run the app. Don't forget to add your Mapbox API key to the .env file.

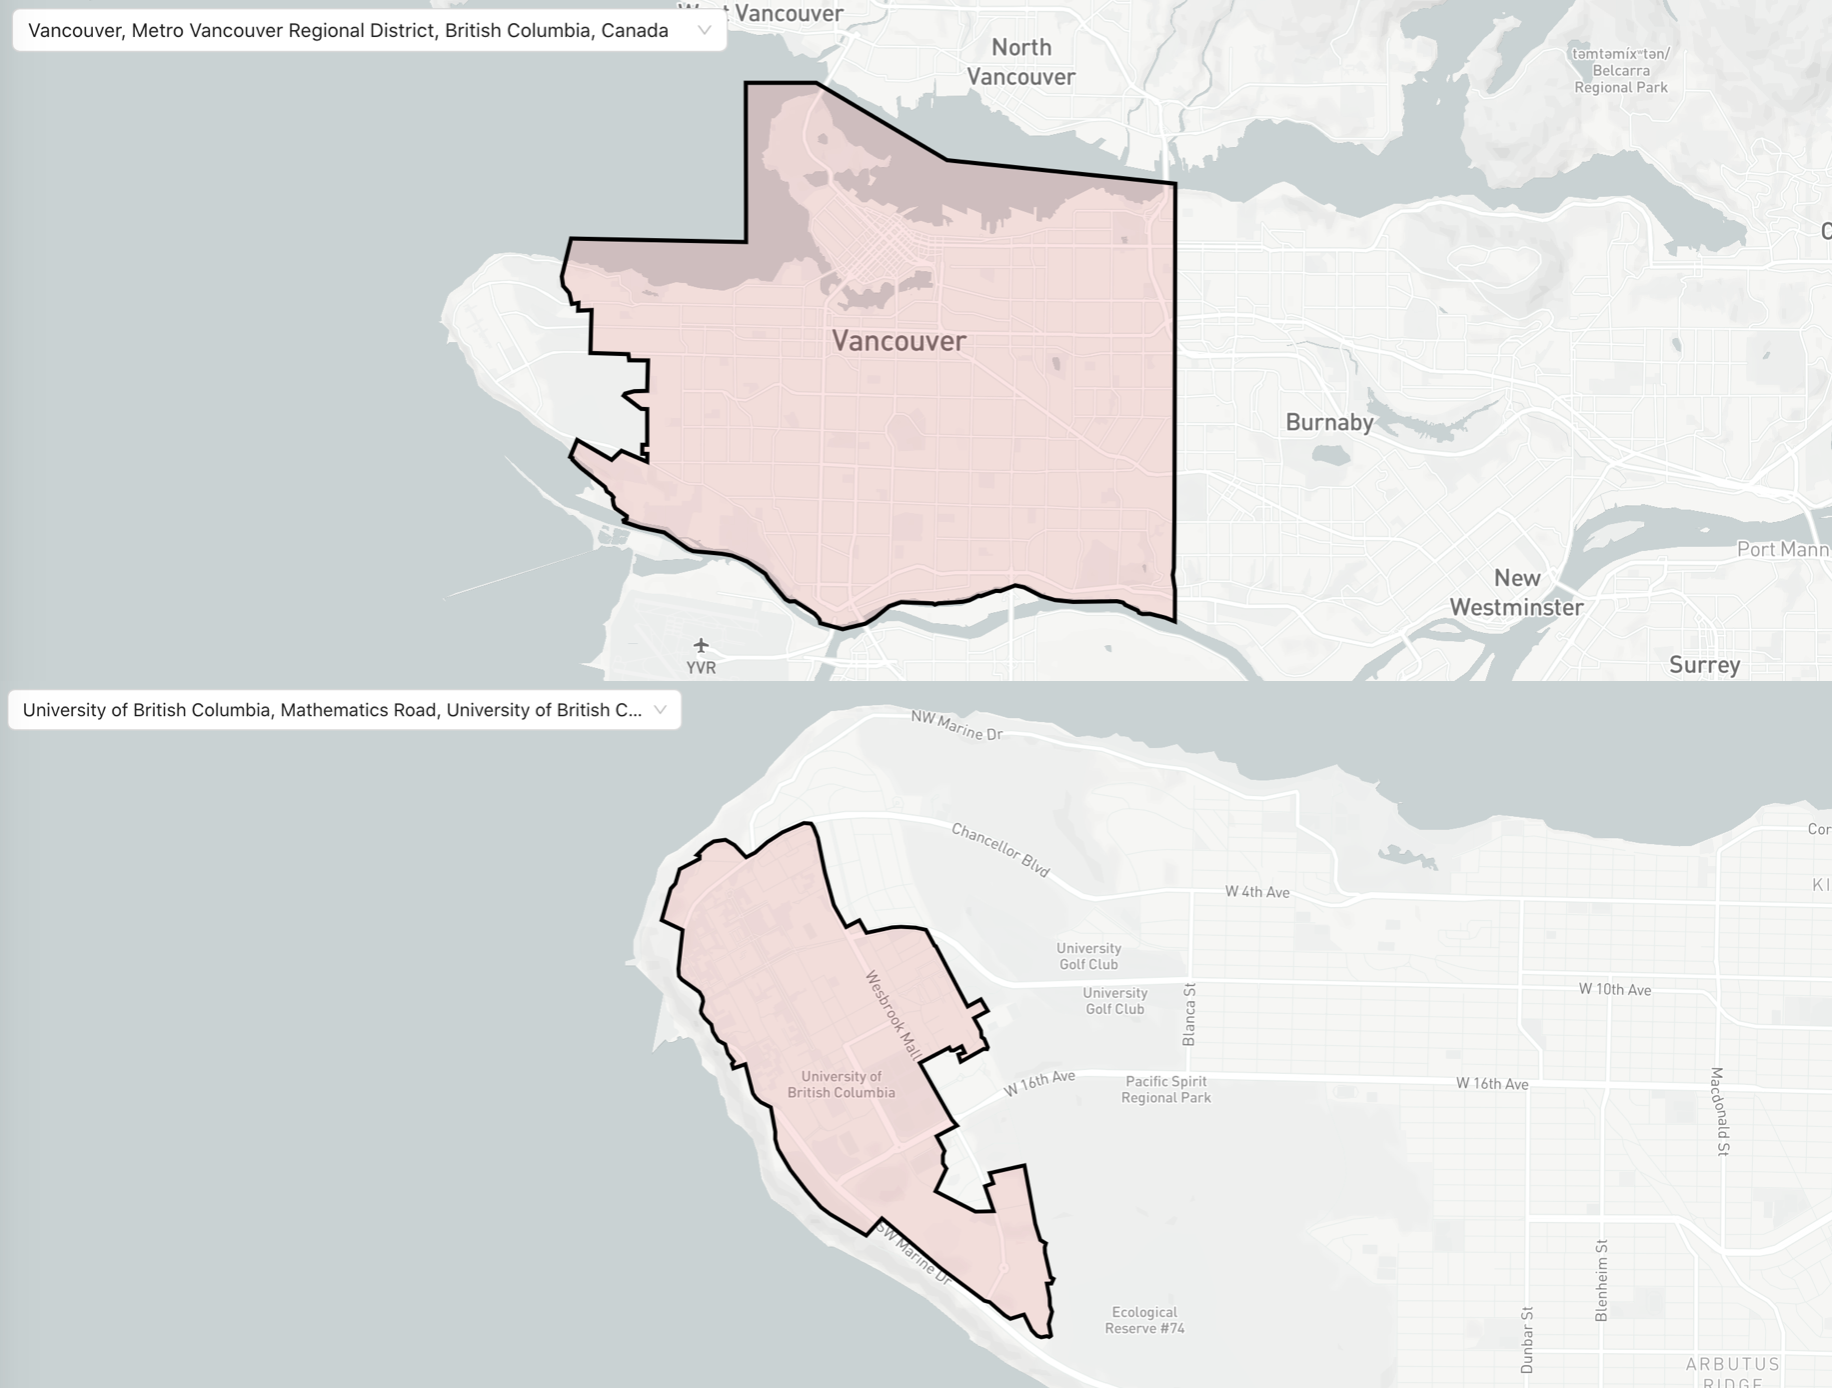
Spin up localhost:3000 on your favorite browser and if everything worked correctly, you should be able to see a map of Singapore. Type in "vancouver" and select the option "Vancouver, Metro Vancouver Regional District, British Columbia, Canada" and the map should show an outline of metro Vancouver in light pink. Type in the name of another city or area e.g. "University of British Columbia" to switch to a different boundary.
![Switching between different city boundaries in our OSM boundary data viewer](https://storage.ghost.io/c/c6/4d/c64da7e8-63a6-4cff-acdc-2782a6ebc377/content/images/2024/05/Screen-Shot-2024-05-22-at-1.12.00-PM.png)

Switching between different city boundaries in our OSM boundary data viewer

If you can't find the city or area that you are looking for, this means that it probably does not exist in the Nominatim database. Nominatim, like all OpenStreetMap projects, relies on volunteer contributions. Missing or incomplete data is quite common.

### Wrap up and next steps

This concludes our tutorial on the [OSM Nominatim API](https://afi.io/blog/openstreetmap-osm-nominatim-api-tutorial/?ref=blog.afi.io). We covered the basics of [setting Nominatim up as a web service](https://afi.io/blog/run-a-free-geocoder-with-nominatim-docker?ref=blog.afi.io), making [geocoding and reverse geocoding requests](https://www.afi.io/blog/building-a-free-geocoding-and-reverse-geocoding-service-with-openstreetmap?ref=blog.afi.io), and in this post, using Nominatim to draw and view boundary data.

There are many mapping services on the market - Google Maps, Mapbox and HERE Maps, just to name a few. The OSM Nominatim API could be a worthwhile, low cost alternative for your project if you are willing to put in the work to run and host it on your own servers, and understand the strengths and limitations of using open source OSM data.

Part 1: [OpenStreetMap OSM Nominatim API tutorial ](https://afi.io/blog/openstreetmap-osm-nominatim-api-tutorial/?ref=blog.afi.io)  
Part 2: [Run a free geocoder with Nominatim Docker](https://afi.io/blog/run-a-free-geocoder-with-nominatim-docker/?ref=blog.afi.io)  
Part 3: [Building a free geocoding and reverse geocoding service with OpenStreetMap](https://www.afi.io/blog/building-a-free-geocoding-and-reverse-geocoding-service-with-openstreetmap/?ref=blog.afi.io)   
Part 4: [How to draw and view boundary data with OpenStreetMap OSM](https://afi.io/blog/how-to-draw-and-view-boundary-data-with-openstreetmap-osm/?ref=blog.afi.io)

👋 **As always, if you have any questions or suggestions for me, please** [**reach out**](https://yourls.afi.io/newcontact?ref=blog.afi.io) **or** [**say hello on LinkedIn**](https://www.linkedin.com/in/afian-anwar-a023b143/?ref=the-afi-labs-blog)**.**