> ## Content Index
> Fetch the complete content index at: https://blog.afi.io/llms.txt
> Use this file to discover other available public pages before exploring further.
# Mapping taxi demand with Uber h3 js and react map gl
- URL: https://blog.afi.io/blog/mapping-taxi-demand-with-uber-h3-js-and-react-map-gl/
- Published: 2023-07-23T18:56:52.000Z
- Updated: 2025-08-15T18:23:29.000Z
- Description: How to build a taxi demand heat map using Uber h3 js and Mapbox react map gl.
- Author: Afian Anwar
- Tags: tech, mapbox
In the [previous article](https://afi.io/blog/uber-h3-js-tutorial-how-to-draw-hexagons-on-a-map/?ref=blog.afi.io), we used the [Uber h3-js library](https://github.com/uber/h3-js?ref=blog.afi.io) to draw a single hexagon on a map. In this article I'm going to show you how to draw a group of hexagons to visualize taxi demand on a [Mapbox](https://www.mapbox.com/?ref=blog.afi.io) map with the React Mapbox library, [react-map-gl](https://visgl.github.io/react-map-gl/?ref=blog.afi.io).
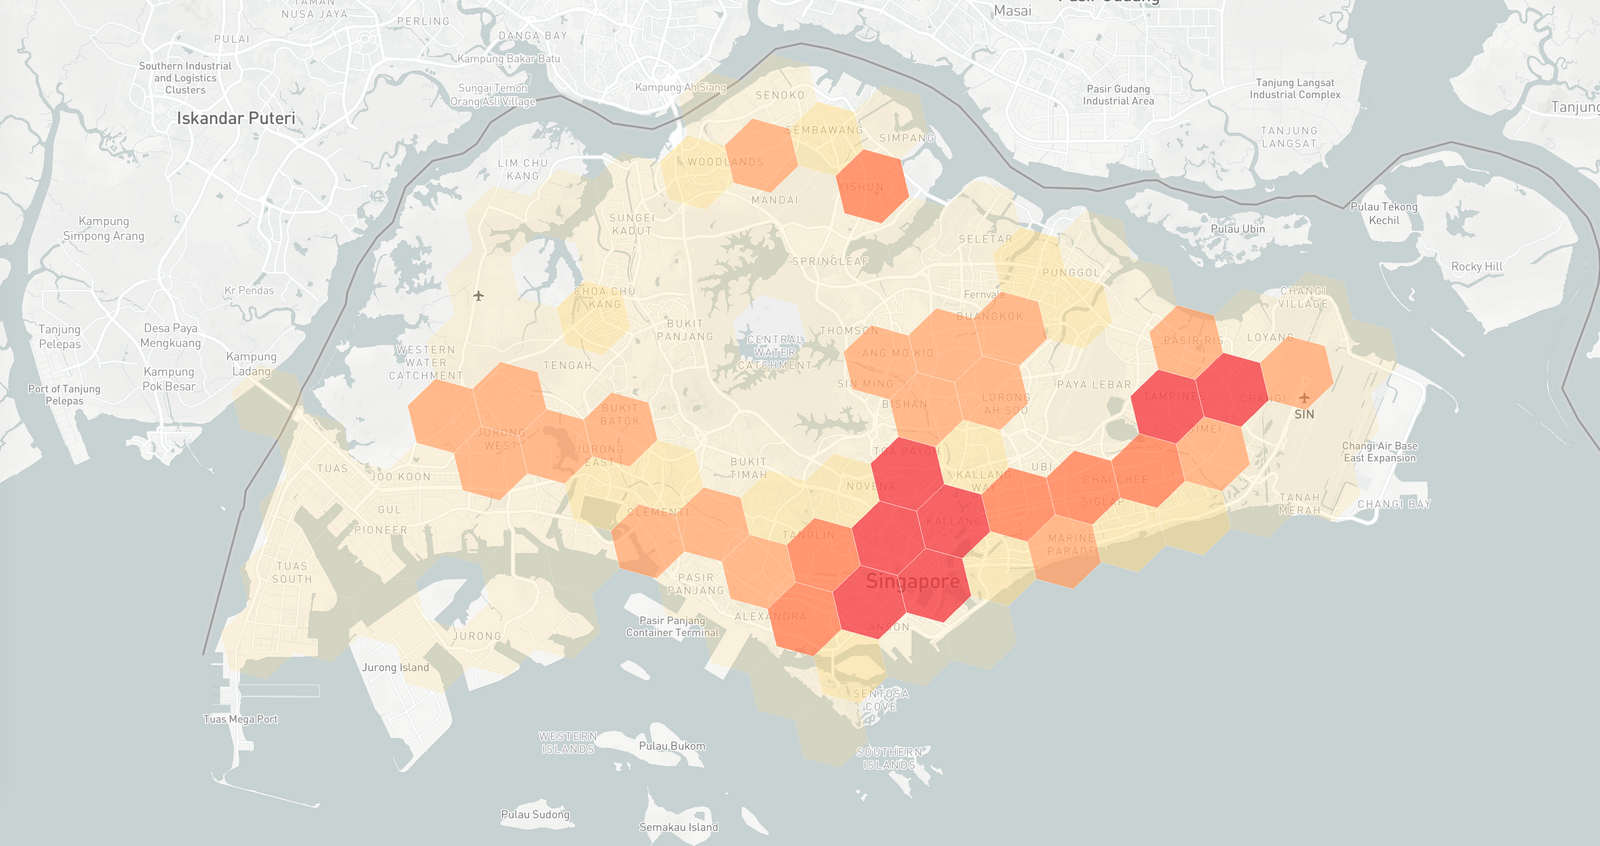
Taxi demand across Singapore from 6 am to 10 am on a weekday
Part 1: [Uber h3 js tutorial: How to draw hexagons on a map](https://afi.io/blog/uber-h3-js-tutorial-how-to-draw-hexagons-on-a-map/?ref=blog.afi.io)
**Part 2: Mapping taxi demand with Uber h3 js and react map gl (this article)**
Part 3: [Visualizing taxi demand over time with Mapbox and React range slider rc slider](https://afi.io/blog/visualizing-taxi-demand-over-time-with-mapbox-and-react-slider-rc-slider/?ref=blog.afi.io)
The solution I'm going to present to you uses [h3-js](https://github.com/uber/h3-js?ref=blog.afi.io) to define the geographic boundaries of each hexagonal cell. We then run a script to detect if a pickup took place within the cell and if so, we increment a counter. These pickup "booking" counts are saved as a key-value pair:
```
{
"876526375ffffff": 158,
"876526acaffffff": 152,
"876526365ffffff": 634,
"876526ac3ffffff": 885,
"876526368ffffff": 70,
"876520cb0ffffff": 201,
... 110 more entries
}
```
that maps the cell's H3 index to the number of bookings that took place inside it. The last step is to load this data into [react-map-gl](https://visgl.github.io/react-map-gl/?ref=blog.afi.io) (a React wrapper for [Mapbox GL](https://docs.mapbox.com/mapbox-gl-js/api/?ref=blog.afi.io)) and color code each hexagon based on the booking count. If you are interested in implementing this solution in one of your own projects, I recommend that you clone the [Github repository](https://github.com/afilabs/h3js%5Fhexagons%5Ftaxi%5Fdemand/?ref=blog.afi.io) and study it carefully to understand the details of my implementation.
### Processing Taxi Demand Data
The data we are using in this project comes from the Singapore Government's open data repository [data.gov.sg](https://beta.data.gov.sg/?ref=blog.afi.io) (note: this data set has since been removed, please [reach out to me](https://blog.afi.io/blog/author/afiananwar/) if you'd like a personal copy). It consists of taxi status and position data from a weekday between 6 am and 10 am saved as a CSV file:
```
date_time,taxi_id,ignore,longitude,latitude,speed,status
03/08/2016 06:00:00, SH6006C, 0110617,103.83272, 1.30534, 0, FREE
03/08/2016 06:00:00, SH6061S, 0227879,103.75754, 1.31769, 81, POB
03/08/2016 06:00:00, SH6220A, ,103.87265, 1.35343, 0, OFFLINE
03/08/2016 06:00:00, SH6395D, 1528378,103.93975, 1.3277, 0, BREAK
03/08/2016 06:00:00, SH6419U, ,103.88155, 1.32256, 0, OFFLINE
...
03/08/2016 06:06:49, SHC0091B, 1645455,103.98955, 1.3579, 0, FREE
03/08/2016 06:06:49, SHC0338R, ,103.94007, 1.34925, 0, OFFLINE
03/08/2016 06:06:49, SHC0647Z, 1741721,103.8199, 1.30721, 0, BUSY
```
Here's what each column represents:
`date_time` : the date and time in DD/MM/YYYY hh:mm:ss format
`taxi_id`: the unique license plate number of the taxi
`longitude`: the longitude coordinate of the taxi
`latitude`: the latitude coordinate of the taxi
`speed`: the spot speed of the taxi in km per hour
`status`: the status of the taxi (FREE - empty and looking for passengers), (POB - passenger on board)
If we monitor a specific taxi by its `taxi_id` and observe a change in its `status` from "FREE" to "POB," it indicates that a passenger pickup, or a booking, has occurred. The `latitude` and `longitude` values will give us the precise location of the booking, while the `date_time` will provide the exact time when the booking took place.
```
/* taxiDataParser.js (not included in repo) */
if (records[i].status === 'FREE' && records[i + 1].status === 'POB') {
taxiData.push({
date_time: records[i + 1].date_time,
taxi_id: records[i + 1].taxi_id,
latitude: records[i + 1].latitude,
longitude: records[i + 1].longitude
})
}
```
With the `latitude` and `longitude` saved, we can use the `latLngToCell()` method run a quick check to see which H3 cell the booking belongs to and increment a counter.
```
/* taxiDataParser.js (not included in repo) */
const bookingHexindex7 = latLngToCell(parseFloat(element.latitude), parseFloat(element.longitude), 7);
// If the booking falls in a specific hexagon, increment the booking count
if (singaporeHexagonsObj.hasOwnProperty(bookingHexindex7)) {
singaporeHexagonsObj[bookingHexindex7]++;
}
```
The final result is [singapore\_hexagons\_count.js](https://github.com/afilabs/h3js%5Fhexagons%5Ftaxi%5Fdemand/blob/main/src/data/singapore%5Fhexagons%5Fcount.json?ref=blog.afi.io), a JavaScript object that pairs the cell's H3 index (we are using resolution level 7, which roughly corresponds to a large neighborhood) to the number of bookings inside it. With this done, we can now write code to visualize our booking data on a map.
### Drawing multiple hexagons with react-map-gl
In this tutorial, I will give a detailed explanation of how to add hexagons to a map and assign them colors based on a predefined value so that by the end of this blog post, you should have a broad based understanding of how to use [h3-js](https://github.com/uber/h3-js?ref=blog.afi.io) and [react-map-gl](https://visgl.github.io/react-map-gl/?ref=blog.afi.io) to create a heat map of taxi demand.
Using [MapBoxSingleHex.jsx](https://github.com/afilabs/h3js%5Fhexagons%5Ftaxi%5Fdemand/blob/main/src/components/MapBoxSingleHex.jsx?ref=blog.afi.io) as a template (you can download the full source code for [afilabs/h3js\_hexagons\_taxi\_demand](https://github.com/afilabs/h3js%5Fhexagons%5Ftaxi%5Fdemand/?ref=blog.afi.io) on GitHub and run it with `npm install` and `npm start`), create a new file `MapBoxMultipleHex.jsx` in the `/src/components` folder and copy/paste the following code outline:
```
/* MapBoxMultipleHex.js */
import "mapbox-gl/dist/mapbox-gl.css";
import Map, { Layer, Source, MapRef, Marker } from "react-map-gl";
import React, {useRef, useState } from "react";
import { cellToBoundary } from "h3-js";
function MapBox() {
const singaporeHexagonsObj = require('../data/singapore_hexagons_count.json');
const [singaporeHexagonsArr, setSingaporeHexagonsArr] = useState([]);
const onLoad = () => {
// onLoad() code here
};
const getRandomStyle = (row) => {
// getRandomStyle() code here
}
const getStyle = (row) => {
// getStyle() code here
};
return (
// JSX code here
);
};
export default MapBox;
```
**Initial setup**
Next, add a `/data` folder to `/src` and save [singapore\_hexagons\_count.js](https://github.com/afilabs/h3js%5Fhexagons%5Ftaxi%5Fdemand/blob/main/src/data/singapore%5Fhexagons%5Fcount.json?ref=blog.afi.io) to it. This is what your `/src` folder should look like now:
```html
h3js_hexagons_taxi_demand/
src/
components/
MapBoxSingleHex.jsx
MapBoxMultipleHex.jsx
data/
singapore_hexagons_count.js
```
In `MapBoxMultipleHex.js` we use the `require` statement to load `singapore_hexagons_count.js` and make it available via `singaporeHexagonsObj` .
```
/* MapBoxMultipleHex.js */
const singaporeHexagonsObj = require('../data/singapore_hexagons_count.json');
```
This is followed by a `useState` hook that allows us to access and change the value of a newly declared variable, `singaporeHexagonsArr` (an array that contains hexagon H3 index ids and booking counts). `singaporeHexagonArr` is initially set to an empty array (`[]`) but its value can be updated by calling the `setSingaporeHexagonsArr()` method.
```
/* MapBoxMultipleHex.js */
const [singaporeHexagonsArr, setSingaporeHexagonsArr] = useState([]);
```
**Return statement**
In a JSX file, the `return` statement is used to define what should be rendered or displayed on the screen when the component is rendered. For `MapBoxMultipleHex.js`, this includes the react-map-gl map layer, .
****
The component initializes our map with the `light-v9` style and centers it at ([1.290270, 103.851959](https://www.google.com/maps/place/1%C2%B017'25.0%22N+103%C2%B051'07.1%22E/@1.29027,103.8493841,17z/data=!3m1!4b1!4m4!3m3!8m2!3d1.29027!4d103.851959?entry=ttu&ref=blog.afi.io)) in downtown Singapore. The `height` and `width` parameters "\`100vh", "100vw" stretch the map to occupy the entire page.
```
/* MapBoxMultipleHex.js */
return (
);
```
Recall from the [last post](https://www.afi.io/blog/uber-h3-js-tutorial-how-to-draw-hexagons-on-a-map/?ref=blog.afi.io) that react-map-gl lets you structure your map layer using [Source](https://visgl.github.io/react-map-gl/docs/api-reference/source?ref=blog.afi.io) and [Layer](https://visgl.github.io/react-map-gl/docs/api-reference/layer?ref=blog.afi.io) components like this:
```html
```
In that post, I used a geojson source of `"type": "Feature"` to load a single H3 cell hexagon onto the map. This time, we'll use `"type": "FeatureCollection"` in to load a collection of H3 cells.
****
```
/* MapBoxMultipleHex.js */
```
The data for the FeatureCollection comes from `singaporeHexagonsArr`, an array that stores the H3 index `hexindex7` of the cell and the associated booking count `bookingCount`. We'll talk about this in detail when we look at the `onLoad()` function.

singaporeHexagonArr
****
The component is used to style the hexagon. Just like in the [previous post](https://www.afi.io/blog/uber-h3-js-tutorial-how-to-draw-hexagons-on-a-map/?ref=blog.afi.io), we use ES6 destructuring ("...") to unpack the [style object](https://docs.mapbox.com/help/glossary/style/?ref=blog.afi.io) and inject it into .
```
/* MapBoxMultipleHex.js */
```
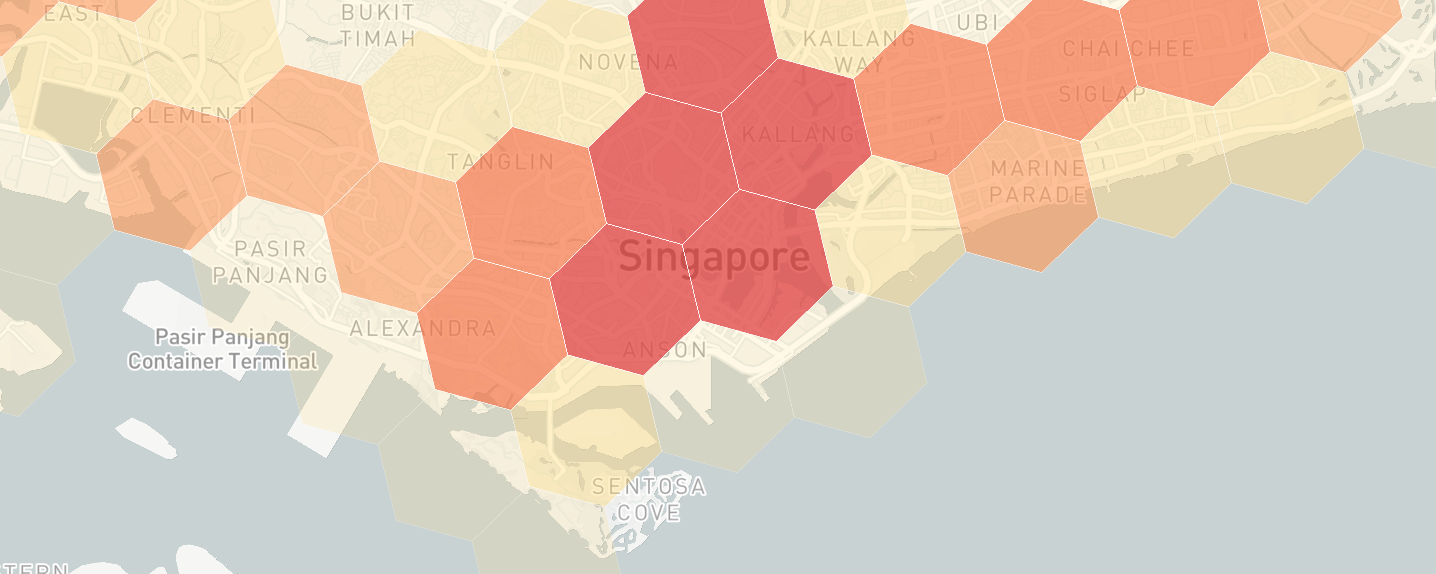
The hexagon is given a `fill-outline-color` of "white" and uses the ['get' data expression](https://docs.mapbox.com/mapbox-gl-js/style-spec/expressions/?ref=blog.afi.io#get) to retrieve the feature's `fill-color` and `fill-opacity` values from the parent component. Data expressions allow a feature's properties to determine its appearance, and can be used to differentiate features within the same layer to create data visualizations. In this example, we use the `bookingCount` value to apply different styles to our hexagons, with higher booking counts resulting in darker colors.
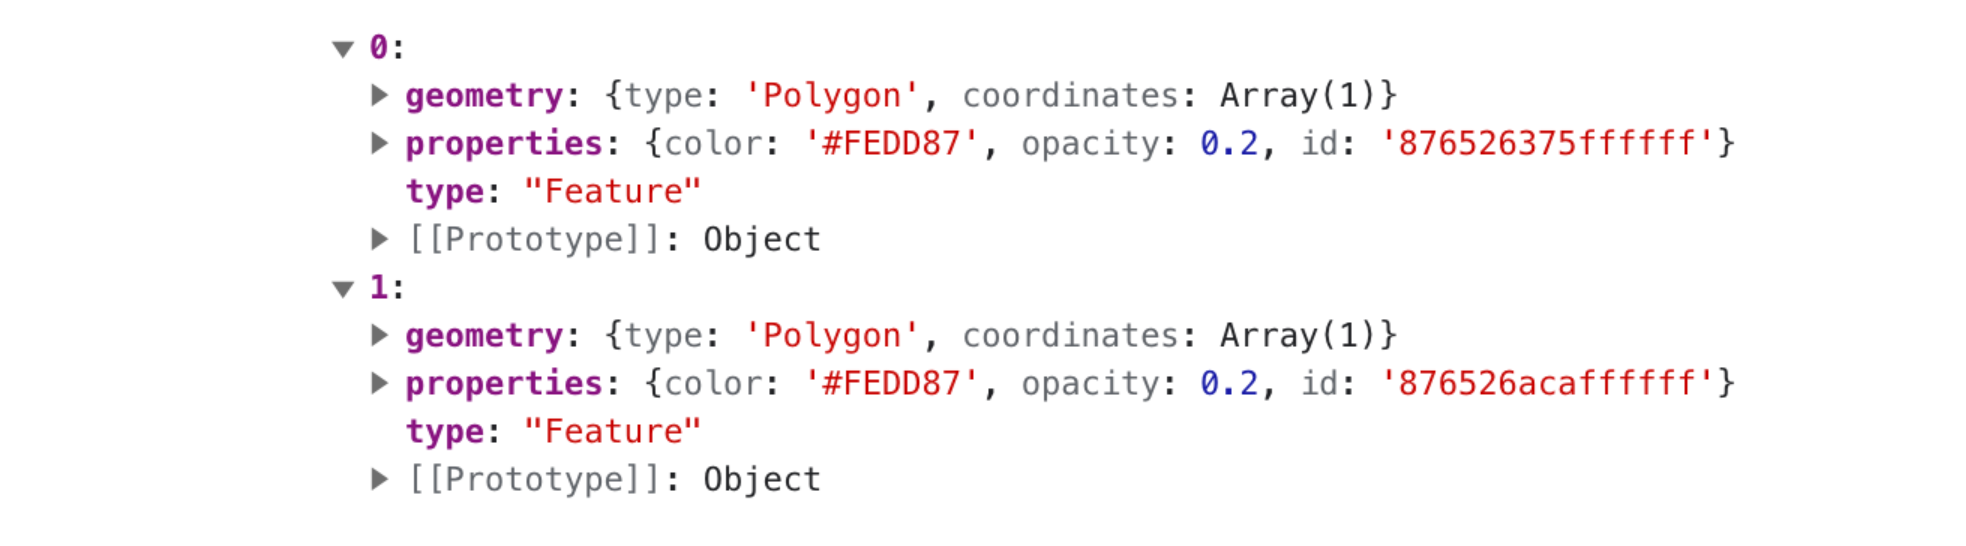
These properties are injected into `singaporeHexagonsArr` in the `onLoad()` method, which we'll get to next.
**onLoad() method**
The `onLoad()` method is called when we set the prop `onLoad={onLoad}` in the component.
```
/* MapBoxMultipleHex.js */
const onLoad = () => {
const sgHexagonsArr = [];
for (const hexagon in singaporeHexagonsObj) {
sgHexagonsArr.push({
hexindex7: hexagon,
bookingCount: singaporeHexagonsObj[hexagon]
});
}
const rs = sgHexagonsArr.map((row) => {
const style = getStyle(row);
return {
type: "Feature",
properties: {
color: style.color,
opacity: style.opacity,
id: row.hexindex7,
},
geometry: {
type: "Polygon",
coordinates: [cellToBoundary(row.hexindex7, true)],
},
};
});
setSingaporeHexagonsArr(rs);
};
```
First, we we initialize an empty array `sgHexagonsArr` and populate it with `hexindex7` and `bookingCount` data from `singaporeHexagonsObj`.
```
/* MapBoxMultipleHex.js onLoad() */
const sgHexagonsArr = [];
for (const hexagon in singaporeHexagonsObj) {
sgHexagonsArr.push({
hexindex7: hexagon,
bookingCount: singaporeHexagonsObj[hexagon]
});
}
```
Second, we map `sgHexagonsArr` to an array `rs` ("row style") of [Mapbox style objects](https://docs.mapbox.com/help/glossary/style/?ref=blog.afi.io), and use the `getStyle()` method to map booking counts to the corresponding `color` and `opacity` values (we'll talk about `getStyle()` in the next section).
```
/* MapBoxMultipleHex.js onLoad() */
const rs = sgHexagonsArr.map((row) => {
const style = getStyle(row);
return {
type: "Feature",
properties: {
color: style.color,
opacity: style.opacity,
id: row.hexindex7,
},
geometry: {
type: "Polygon",
coordinates: [cellToBoundary(row.hexindex7, true)],
},
};
});
setSingaporeHexagonsArr(rs);
```
Third, we copy over `rs` to `singaporeHexagonsArr` by using the `setSingaporeHexagonsArr()` function (part of React's `useState` hook). This way, the new `singaporeHexagonsArr` array and associated data is available to the [react-map-gl](https://visgl.github.io/react-map-gl/?ref=blog.afi.io) and components for rendering.
**getStyle() method**
The last method we'll look at is `getStyle()`, which is responsible for mapping `bookingCount` to a range of colors that we'll use in our taxi demand heat map.
```
/* MapBoxMultipleHex.js getStyle() */
const getStyle = (row) => {
const styles = [{
color: '#FEDD87',
opacity: 0.2
},
{
color: '#FED976',
opacity: 0.4
},
{
color: "#FC9653",
opacity: 0.6,
},
{
color: "#F77645",
opacity: 0.7
},
{
color: "#E14C48",
opacity: 0.8
}
];
if (Number(row.bookingCount) === 0) {
return {
opacity: 0
};
}
if (Number(row.bookingCount) < 250) {
return styles[0];
}
if (Number(row.bookingCount) < 500) {
return styles[1];
}
if (Number(row.bookingCount) < 1000) {
return styles[2];
}
if (Number(row.bookingCount) < 1500) {
return styles[3];
}
return styles[4];
};
```
Choosing an appropriate color scheme for our heat map can help users quickly interpret the data and patterns represented in the heat map - in this case, we want to distinguish high taxi demand areas from low taxi demand areas quickly, at a glance. Looking at the data when binned into intervals of 250, we see that the distribution of bookings is "positively skewed", with the majority of bookings concentrated on the left side, towards lower values e.g. there are 68 H3 cells with less than 250 bookings.
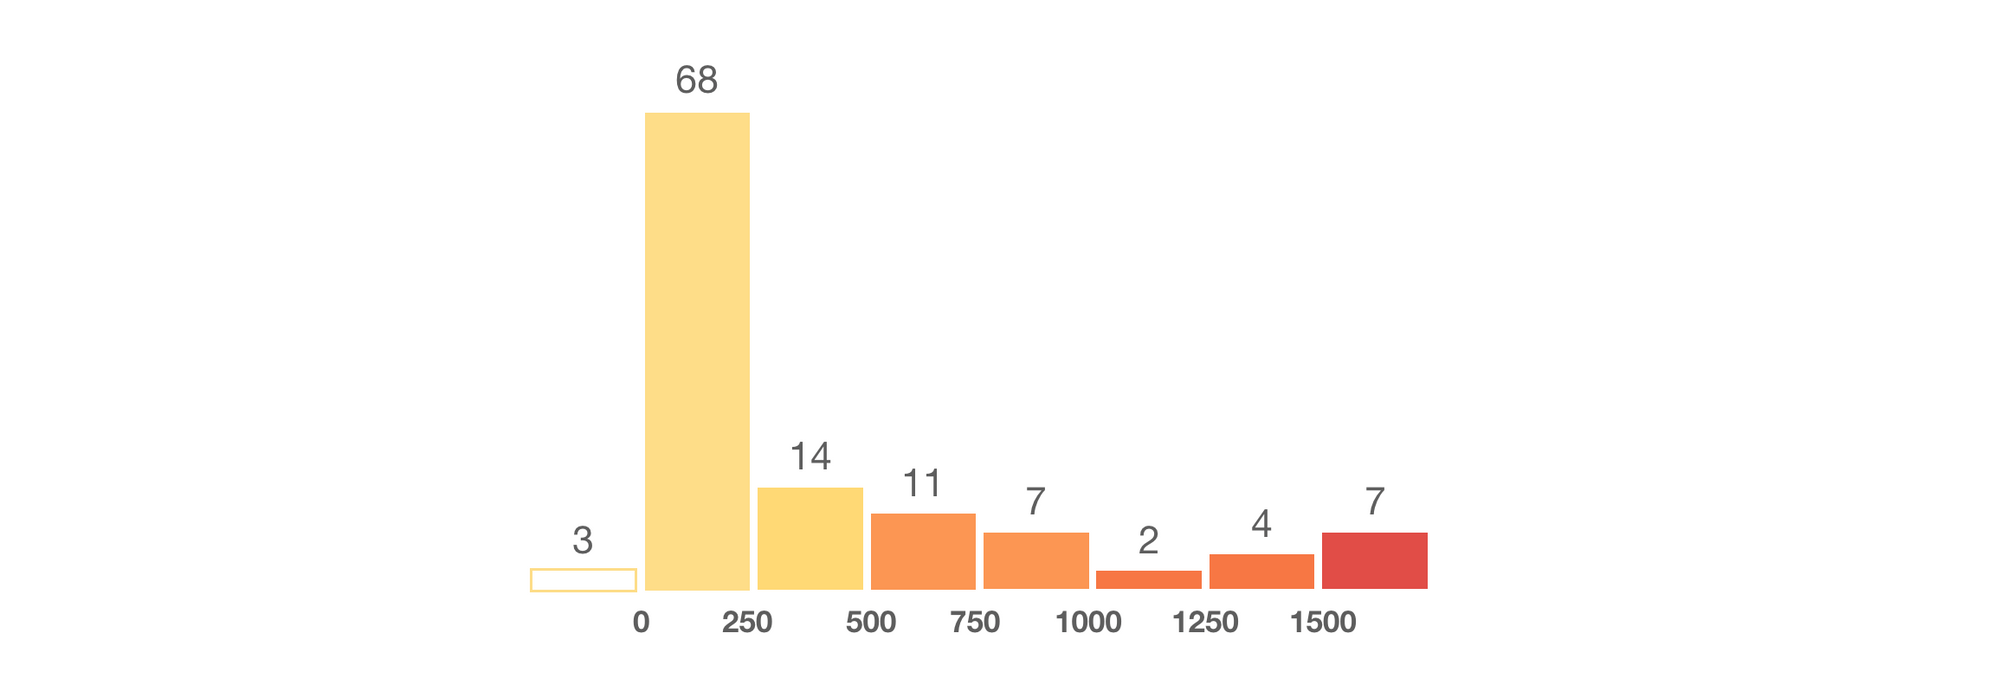
Distribution of taxi demand binned at intervals of 250 bookings
With this in mind, here's one way to map `booking_count` to `color`:
| **booking\_count** | **color** |
| ------------------ | --------- |
| less than 250 | #FEDD87 |
| 250 - 499 | #FED976 |
| 500 - 999 | #FC9653 |
| 1000 - 1499 | #F77645 |
| 1500 or more | #E14C48 |
If there are no bookings detected, we give the hexagon an `opacity` of 0 so that it appears transparent.
### Putting it all together
In your terminal, run `npm install` to install dependencies followed by `npm start` to run the app.

Taxi demand across Singapore from 6 am to 10 am on a weekday
Point your browser to localhost:3000 and if everything worked correctly, you should be able to see the map above. As expected, taxi demand can clearly be seen concentrated in the Central Business District and in dense neighborhoods to the East and West of Singapore. In the next post, we'll make this data visualization even more useful by animating it so that you can see how taxi demand changes over time.
👋 **As always, if you have any questions or suggestions for me, please** [**reach out**](https://yourls.afi.io/newcontact?ref=blog.afi.io) **or** [**say hello on LinkedIn**](https://www.linkedin.com/in/afian-anwar-a023b143/?ref=the-afi-labs-blog)**.**
Next: [Part 3: Visualizing taxi demand over time with Mapbox and React range slider rc slider](https://afi.io/blog/visualizing-taxi-demand-over-time-with-mapbox-and-react-slider-rc-slider/?ref=blog.afi.io)