Uber h3 js tutorial: How to draw hexagons on a map
A gentle introduction to the Uber h3-js library with worked examples.

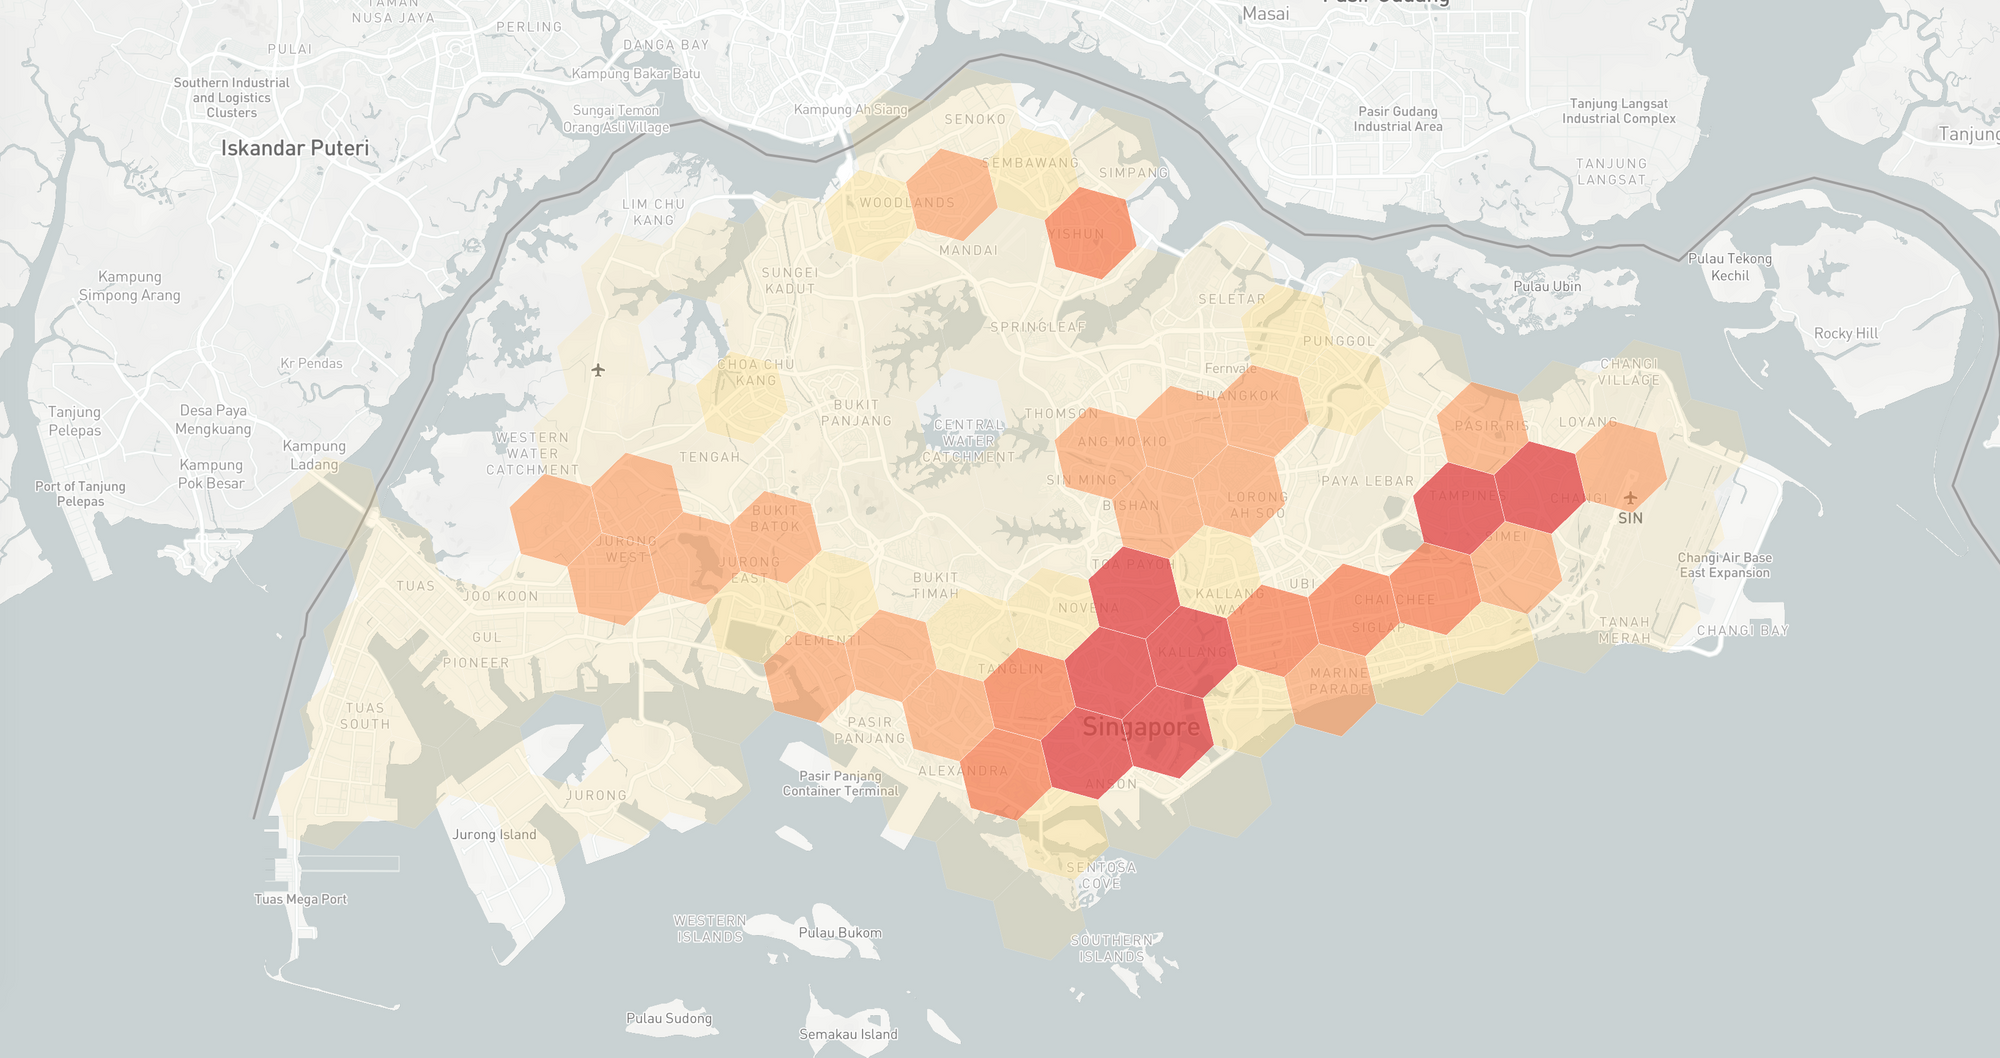
I thought it would be fun to go outside of my comfort zone and write about something completely different and new. So today, I'm going to show you how to use the h3-js library to draw hexagons on a map! Here's what we are going to build by the end of this series - an interactive map of taxi demand across Singapore.
Part 1: Uber h3 js tutorial: How to draw hexagons on a map (this article)
Part 2: Mapping taxi demand with Uber h3 js and react map gl
Part 3: Visualizing taxi demand over time with Mapbox and React range slider rc slider
Recently, I had the opportunity to use h3-js in a data visualization project for a client, and I wanted to share what I've learned. For those of you not familiar with h3-js, it's the JavaScript port of H3, Uber's hexagon-based geospatial indexing system. Hexagons (unlike say, squares or triangles) approximate various shapes like neighborhoods and city blocks more accurately. This flexibility makes H3 perfect for diverse geospatial use cases, including transportation, urban planning, logistics, and location-based services (also - Hexagons are the Bestagons).
Afi Labs delivers custom software to meet your logistics needs. From vehicle routing, live tracking to proof of delivery, we've got you covered!
👋 Say Hello!
I've created a new Github repository with the examples from this post, all based on h3-js. To try them out, clone the repository, run npm install followed by npm start .
To make the most of this tutorial, you need to have basic experience writing applications in JavaScript in general and React, specifically. This is because we'll be using the amazing react-map-gl library to render our Mapbox base map and programmatically add data to it, so in some ways this post doubles up as a React and react-map-gl tutorial as well. Let's get started.
Introduction to the h3-js API
The core of the h3-js library are the functions that provide the H3 index for geographic coordinates and vice versa. A H3 index e.g. "876520c86ffffff" is the unique "id" of the hexagon, which is defined by two pieces of information: a center coordinate and the "size" or resolution. The higher the resolution of the grid, the smaller the hexagons, from res 0 (continental) to res 15 (1 square meter). Res 9 is roughly a city block. For this tutorial, we'll be using res 7 which roughly corresponds to a large neighborhood.
First, import the required methods from h3-js (note: all the demo code listed here can be found in h3ExampleMethods.js in the Github repository:
/* h3ExampleMethods.js */
const { cellToLatLng, latLngToCell, cellToBoundary } = require('h3-js');
cellToLatLng
To convert a H3 index to a latitude and longitude, we use the cellToLatLng() method (API reference) to obtain the center of the hexagon:
cellToLatLng(h3Index) -> CoordPair
Input
For a given h3Index H3IndexInput string:
/* h3ExampleMethods.js */
function cellToLatLngExample() {
  const cell = '876520d95ffffff';
  return cellToLatLng(cell);
}
Output
Returns the center coordinate as a CoordPair [lat, lng] pair:
[ 1.3049570274662716, 103.84333471371895 ]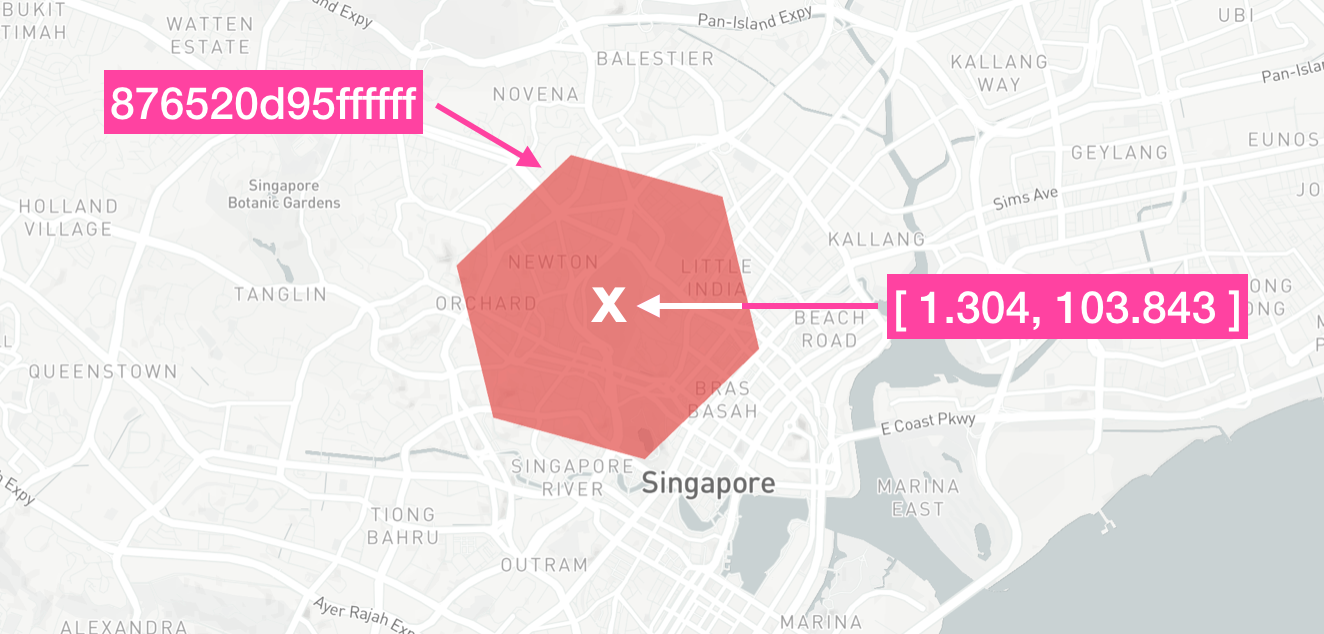
latLngToCell
The inverse of cellLatToLng() is latLngToCell() (API reference) which takes in a latitude and longitude pair together with a specified resolution and returns the H3 index of the hexagon that it belongs to.
latLngToCell(lat, lng, res) -> H3Index
Input
For a lat number (latitude), lng number (longitude) and res number (resolution):
/* h3ExampleMethods.js */
function latLngToCellExample() {
    // Newton Hawker Center
    const lat = 1.3119888;
    const lng = 103.8369993;
    const res = 7;

    return latLngToCell(lat, lng, res);
}
Output
Returns the H3Index string of the containing hexagon.
876520d95ffffff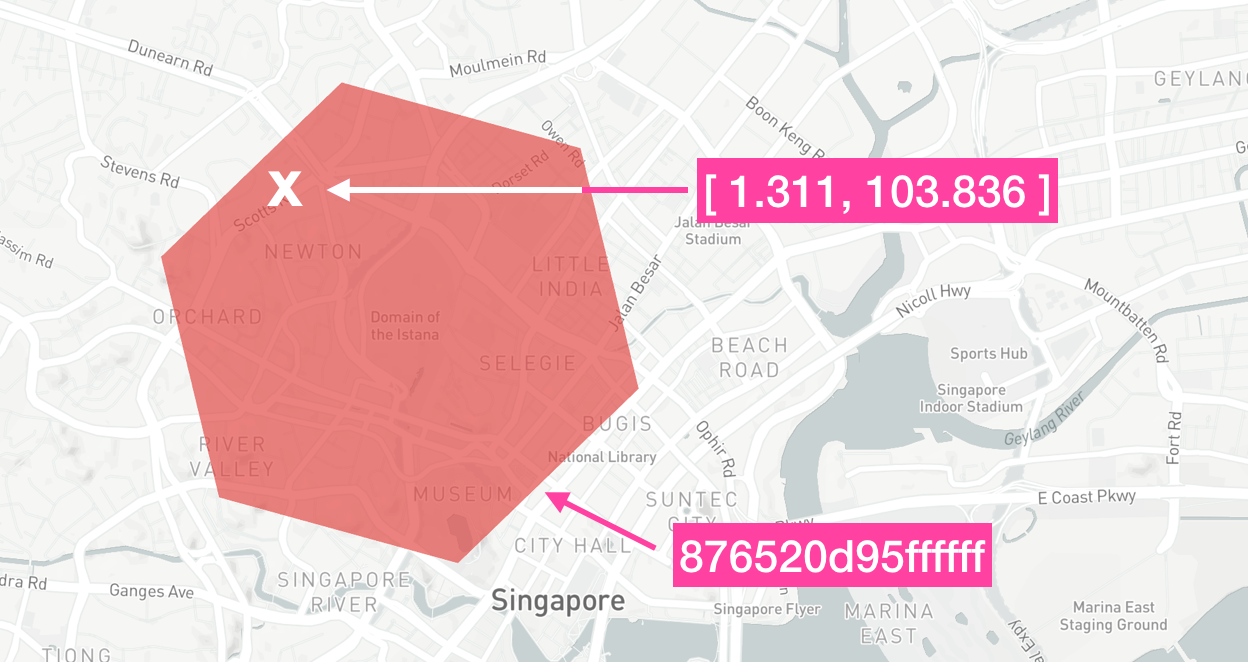
cellToBoundary
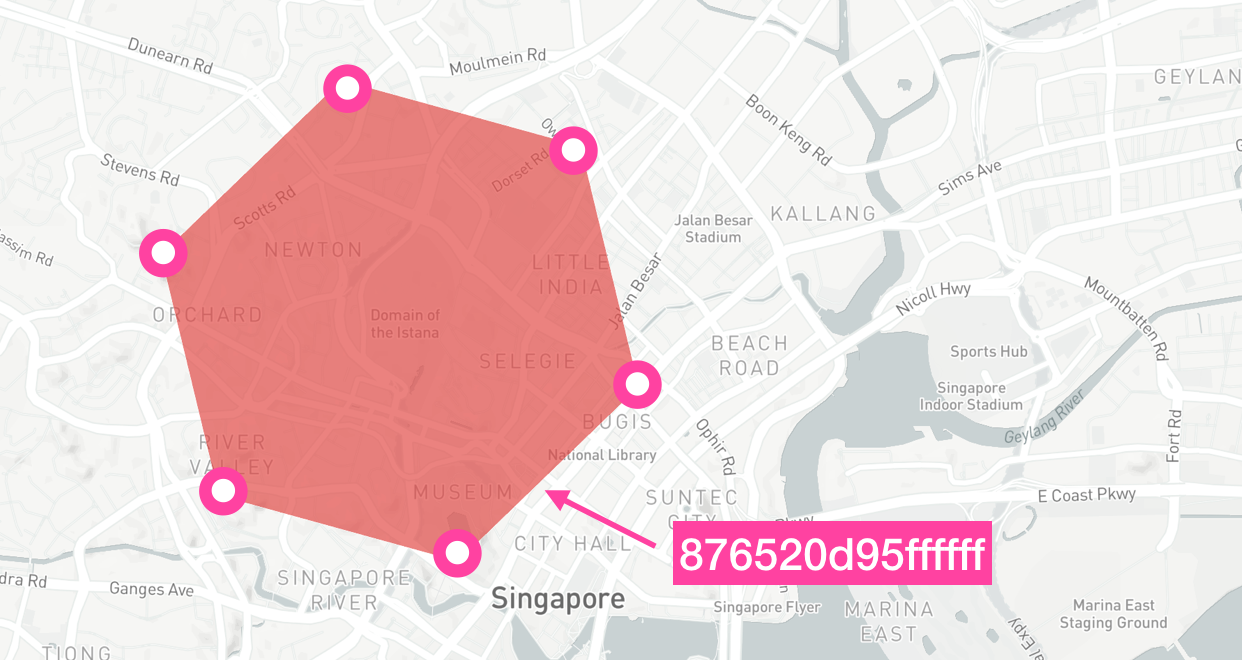
To draw the H3 cell on a map, you need the coordinates of each vertex. The cellToBoundary() method (API reference) accepts a H3Index string and returns and array of [lat, lng] pairs corresponding to the cell's vertices.
cellToBoundary(h3Index) -> Array.<CoordPair>
Input
For a given h3Index H3IndexInput string:
/* h3ExampleMethods.js */
function cellToBoundaryExample() {
    const cell = '876520d95ffffff';

    return cellToBoundary(cell);
}
Output
[
[ 1.3013837085594995, 103.85630417742213 ],
[ 1.314435751149279, 103.85314992083924 ],
[ 1.3180097264283908, 103.84017971194217 ],
[ 1.3085305652330135, 103.83036417616988 ],
[ 1.295478307425089, 103.8335196239885 ],
[ 1.2919054258381997, 103.84648941655875 ]
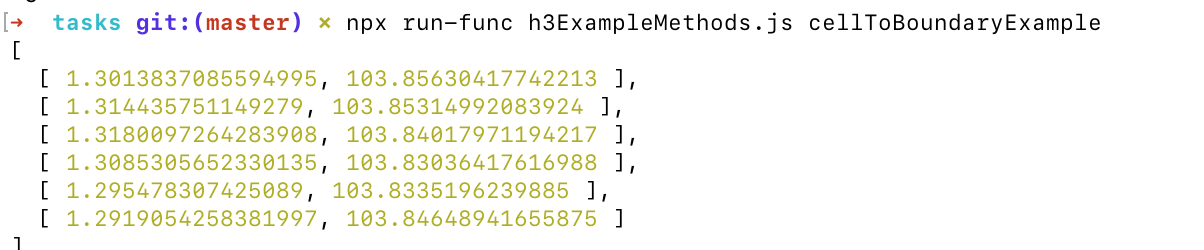
]Returns the vertices of the H3 cell as an Array.<CoordPair> i.e. an array of [lat, lng] pairs.
To run these examples, clone the Github repository and in your terminal, navigate to the /src/tasks folder and run npx run-func h3ExampleMethods.js <method_name> e.g. npx run-func h3ExampleMethods.js cellToBoundaryExample.
With these building blocks in place - cellToLatLng(), latLngToCell() and cellToBoundary(), we can start drawing hexagons on a map.
How our code is organized
Like most projects on this blog, we scaffolded this one using the Create React App with code that follows this standard folder structure:
my-app/
  README.md
  node_modules/
  package.json
  public/
  src/
    components/
       MapBoxSingleHex.jsx
    tasks/
       h3ExampleMethods.js
    App.css
    App.js
    App.test.js
    index.css
    index.jsx
    logo.svg
The new files in the /src folder are tasks/h3ExampleMethods.js which we used to test the H3 indexing methods described earlier and components/MapBoxSingleHex.jsx which will be our main focus going forward.
MapBoxSingleHex.jsx
/components/MapBoxSingleHex.jsx is made available to the user from index.jsx, the entry point to our React app by importing the file:
/* index.jsx */
import MapBoxSvg from './components/MapBoxSingleHex';
and rendering it:
/* index.jsx */
root.render(
  <React.StrictMode>
    <MapBoxSvg />
  </React.StrictMode>
);
The MapBoxSvg component, which implements the react-map-gl map layer to draw the hexagon, is shown below (you can download and run this code by visiting the h3js_hexagons Github repository).
/* mapBoxSingleHex.jsx */
import "mapbox-gl/dist/mapbox-gl.css";
import Map, { Layer, Source, MapRef, Marker } from "react-map-gl";
import React, {useRef, useState } from "react";
import { cellToBoundary } from "h3-js";

function MapBox() {

  const hexindex7Id = "876520d95ffffff";

  return (
      <div>
        <div className="map">
          <Map
            initialViewState={{
              latitude: 1.290270,
              longitude: 103.851959,
              zoom: 10,
              bearing: 0,
              pitch: 0,
            }}
            mapStyle="mapbox://styles/mapbox/light-v9"
            mapboxAccessToken="YOUR_MAPBOX_ACCESS_TOKEN"
            style={{
              height: "100vh",
              width: "100vw",
            }}
          >
            <Source
              type="geojson"
              data= {{
                "type": "Feature",
                "geometry": {
                  "type": "Polygon",
                  "coordinates": [cellToBoundary(hexindex7Id, true)]
                },
                "id": "abc123"
              }}
            >
              <Layer
                {...{
                  type: "fill",
                  paint: {
                    'fill-outline-color': 'white',
                    "fill-color": "#E14C48",
                    "fill-opacity": 0.7,
                  },
                }}
              />

            </Source>
          </Map>
        </div>
      </div>
  );

};

export default MapBox;
Let's work through the code to figure out what's going on.
/* mapBoxSingleHex.jsx */
import "mapbox-gl/dist/mapbox-gl.css";
import Map, { Layer, Source, MapRef, Marker } from "react-map-gl";
import React, {useRef, useState } from "react";
import { cellToBoundary } from "h3-js";
Read from top to bottom, this imports:
- The default Mapbox GL stylesheet
mapbox-gl/dist/mapbox-gl.css. - The
Map, { Layer, Source, MapRef, Marker }components from react-map-gl. - Two specific hooks (
useRefanduseState) used by React to create and manage state, as well as reference DOM elements. - The
cellToBoundary()method from h3-js that returns the H3 cell's vertex coordinates.
The heavy lifting is done in the MapBox() function:
/* mapBoxSingleHex.jsx */
function MapBox() {

  const hexindex7Id = "876520d95ffffff";

  return (
      <div>
        <div className="map">
          <Map
            // Map component code
          >
            <Source
              // Source component code
            >
              <Layer
                // Layer component code
              />
            </Source>
          </Map>
        </div>
      </div>
  );
};
First, we store the H3 index of the cell we want to display:
/* mapBoxSingleHex.jsx */
function MapBox() {

  const hexindex7Id = "876520d95ffffff";

  // Rest of MapBox() code
};
Next, we return a JSX component (a virtual representation of HTML that can be easily combined with JavaScript expressions) that contains the map layer.
/* mapBoxSingleHex.jsx */
function MapBox() {

  // Earlier code

  return (
      <div>
        <div className="map">
          <Map
            // Map component code
          >
            <Source
              // Source component code
            >
              <Layer
                // Layer component code
              />
            </Source>
          </Map>
        </div>
      </div>
  );
};
This React style code is very different from your typical vanilla JavaScript implementation of Mapbox GL (e.g. add a polygon to a map using a GeoJSON source) which requires you to use the addSource() function to add GeoJSON data to a polygon before calling addLayer() to create a new fill layer and applies paint properties to style the polygon's appearance.
Instead, because react-map-gl gives us a ready made collection of React components that play well with Mapbox, we can inject data and style our map using Source and Layer components like this:
<Map>
  <Source>
    <Layer/>
  </Source>
</Map>
I'll walk through each component individually and explain what each does.
<Map/>
/* mapBoxSingleHex.jsx */

          <Map
            initialViewState={{
              latitude: 1.290270,
              longitude: 103.851959,
              zoom: 10,
              bearing: 0,
              pitch: 0,
            }}
            mapStyle="mapbox://styles/mapbox/light-v9"
            mapboxAccessToken="MAPBOX_ACCESS_TOKEN"
            style={{
              height: "100vh",
              width: "100vw",
            }}
          >
            <Source>
              <Layer/>
            </Source>
          </Map>
This initializes our map with the light-v9 style and centers it at (1.290270, 103.851959) in downtown Singapore. The height and width parameters "`100vh", "100vw" stretch the map to occupy the entire page.
<Source/>
/* mapBoxSingleHex.jsx */

          <Source
              type="geojson"
              data= {{
                "type": "Feature",
                "geometry": {
                  "type": "Polygon",
                  "coordinates": [cellToBoundary(hexindex7Id, true)]
                },
                "id": "abc123"
              }}
            >
              <Layer/>
            </Source>
The <Source/> component stores data that we can display on the map using <Layer/>. In this example, we specify that the data type is "geojson" (a format for encoding a variety of geographic data structures such as points, lines, polygons etc), with geometry "Polygon" and vertices (coordinates) set to cellToBoundary("876520d95ffffff") which returns an array of latitude and longitude points.
<Layer/>
/* mapBoxSingleHex.jsx */
              <Layer
                {...{
                  type: "fill",
                  paint: {
                    'fill-outline-color': 'white',
                    "fill-color": "#E14C48",
                    "fill-opacity": 0.7,
                  },
                }}
              />
Now we can begin styling the <Source/> data set with the <Layer/> component. Here, we use ES6 destructuring ("...") to unpack the style object and inject it into <Layer/>. We instruct Mapbox to draw the polygon with fill-color "#E14C48" (dark red) and give it a fill-opacity of 0.7 (semi transparent) and fill-outline-color "white" (white border).
Here's the final result:
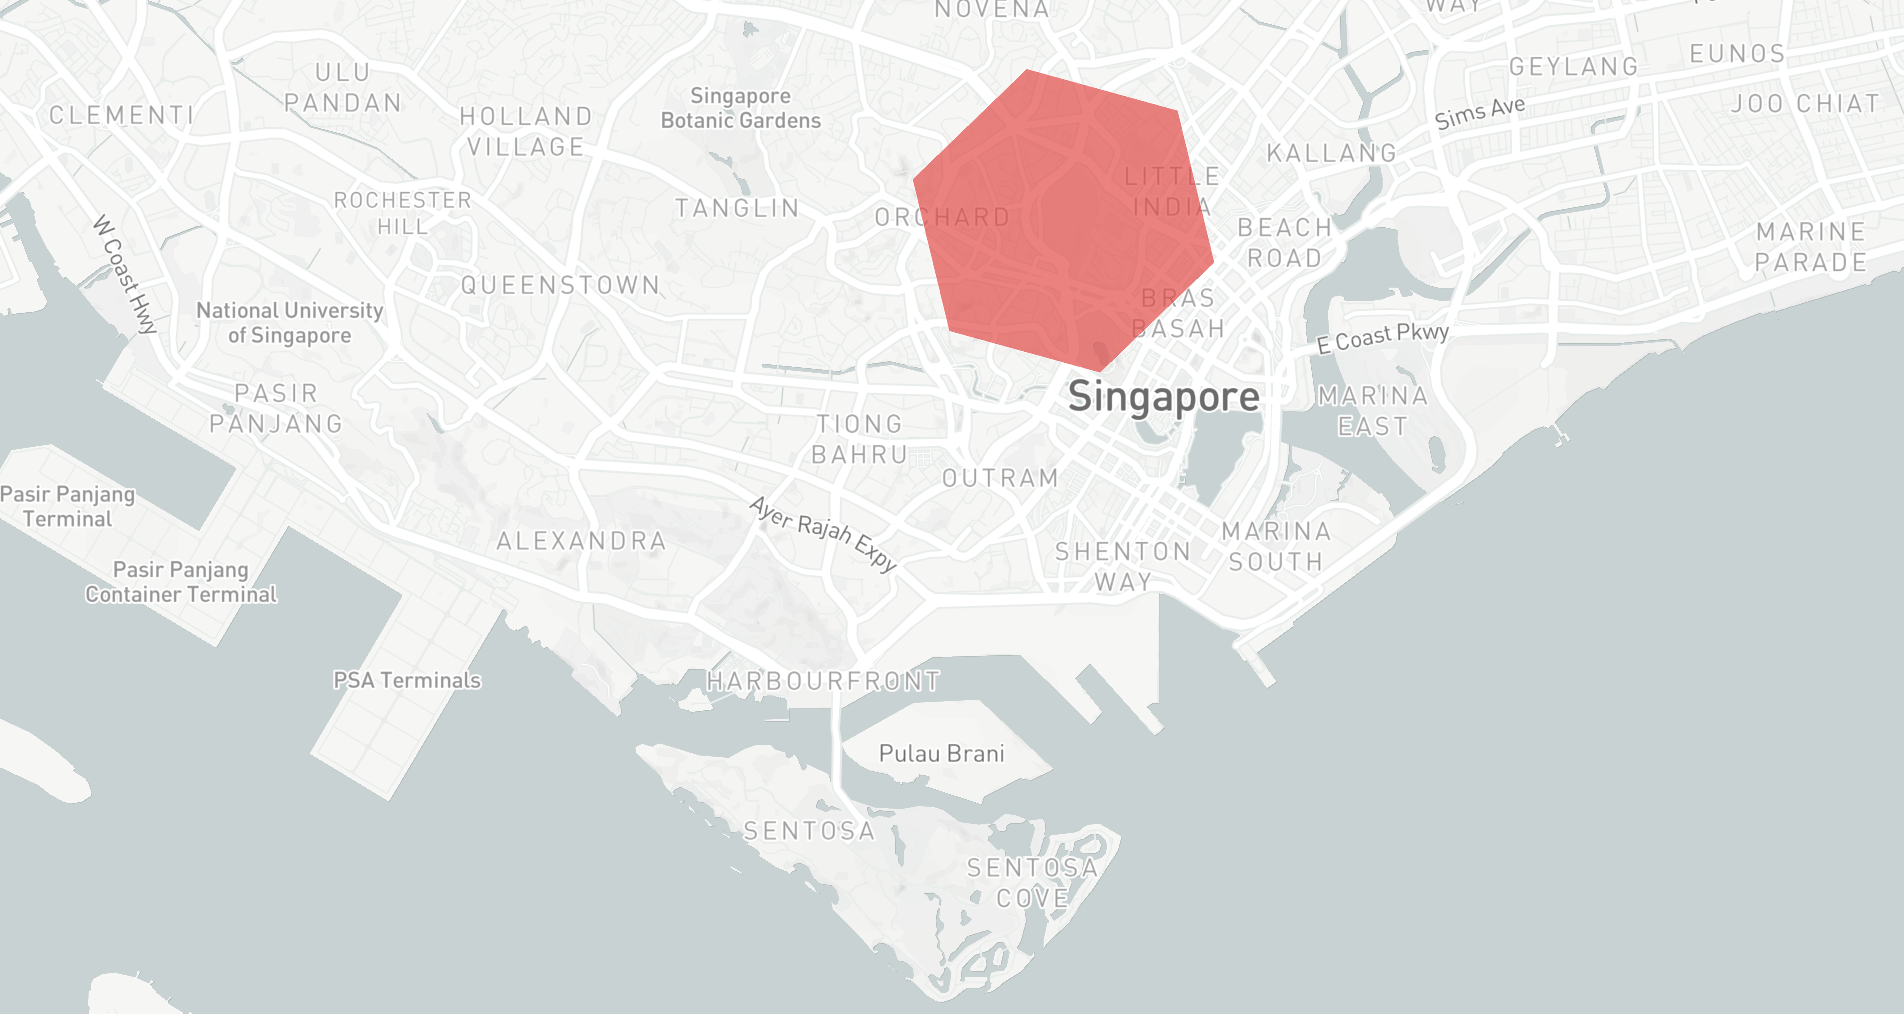
So that's how you draw a hexagon on a map in React using the Uber h3-js library and react-map-gl. This isn't too useful right now, but in the next section I'll show you how to use what we learned in this post to build a heatmap of taxi demand in Singapore.
👋 As always, if you have any questions or suggestions for me, please reach out or say hello on LinkedIn.
Next: Part 2: Mapping taxi demand with Uber h3 js and react map gl