> ## Content Index
> Fetch the complete content index at: https://blog.afi.io/llms.txt
> Use this file to discover other available public pages before exploring further.
# Visualizing taxi demand over time with Mapbox and React range slider rc slider
- URL: https://blog.afi.io/blog/visualizing-taxi-demand-over-time-with-mapbox-and-react-slider-rc-slider/
- Published: 2023-08-10T05:01:00.000Z
- Updated: 2025-08-15T18:22:59.000Z
- Description: How to visualize taxi demand over time using Mapbox and rc slider
- Author: Afian Anwar
- Tags: tech, mapbox
Welcome to the third and last of my tutorial series on using the [Uber h3-js library](https://github.com/uber/h3-js?ref=blog.afi.io) and [react-map-gl](https://visgl.github.io/react-map-gl/?ref=blog.afi.io) to visualize taxi demand on a map. In the [first part](https://afi.io/blog/uber-h3-js-tutorial-how-to-draw-hexagons-on-a-map?ref=blog.afi.io), I showed how to use the [h3-js APIs](https://h3geo.org/docs/api/indexing?ref=blog.afi.io) to display a simple hexagon on a [Mapbox](https://www.mapbox.com/?ref=blog.afi.io) base map. In the [second](https://afi.io/blog/mapping-taxi-demand-with-uber-h3-js-and-react-map-gl?ref=blog.afi.io), we extended this idea to draw a [heat map of taxi demand in Singapore](https://afi.io/blog/mapping-taxi-demand-with-uber-h3-js-and-react-map-gl?ref=blog.afi.io) built from multiple hexagons. In this post, we'll use a React slider component, [rc-slider](https://slider-react-component.vercel.app/?ref=blog.afi.io), to show how taxi demand changes over time on a weekday during the morning rush hour in Singapore.
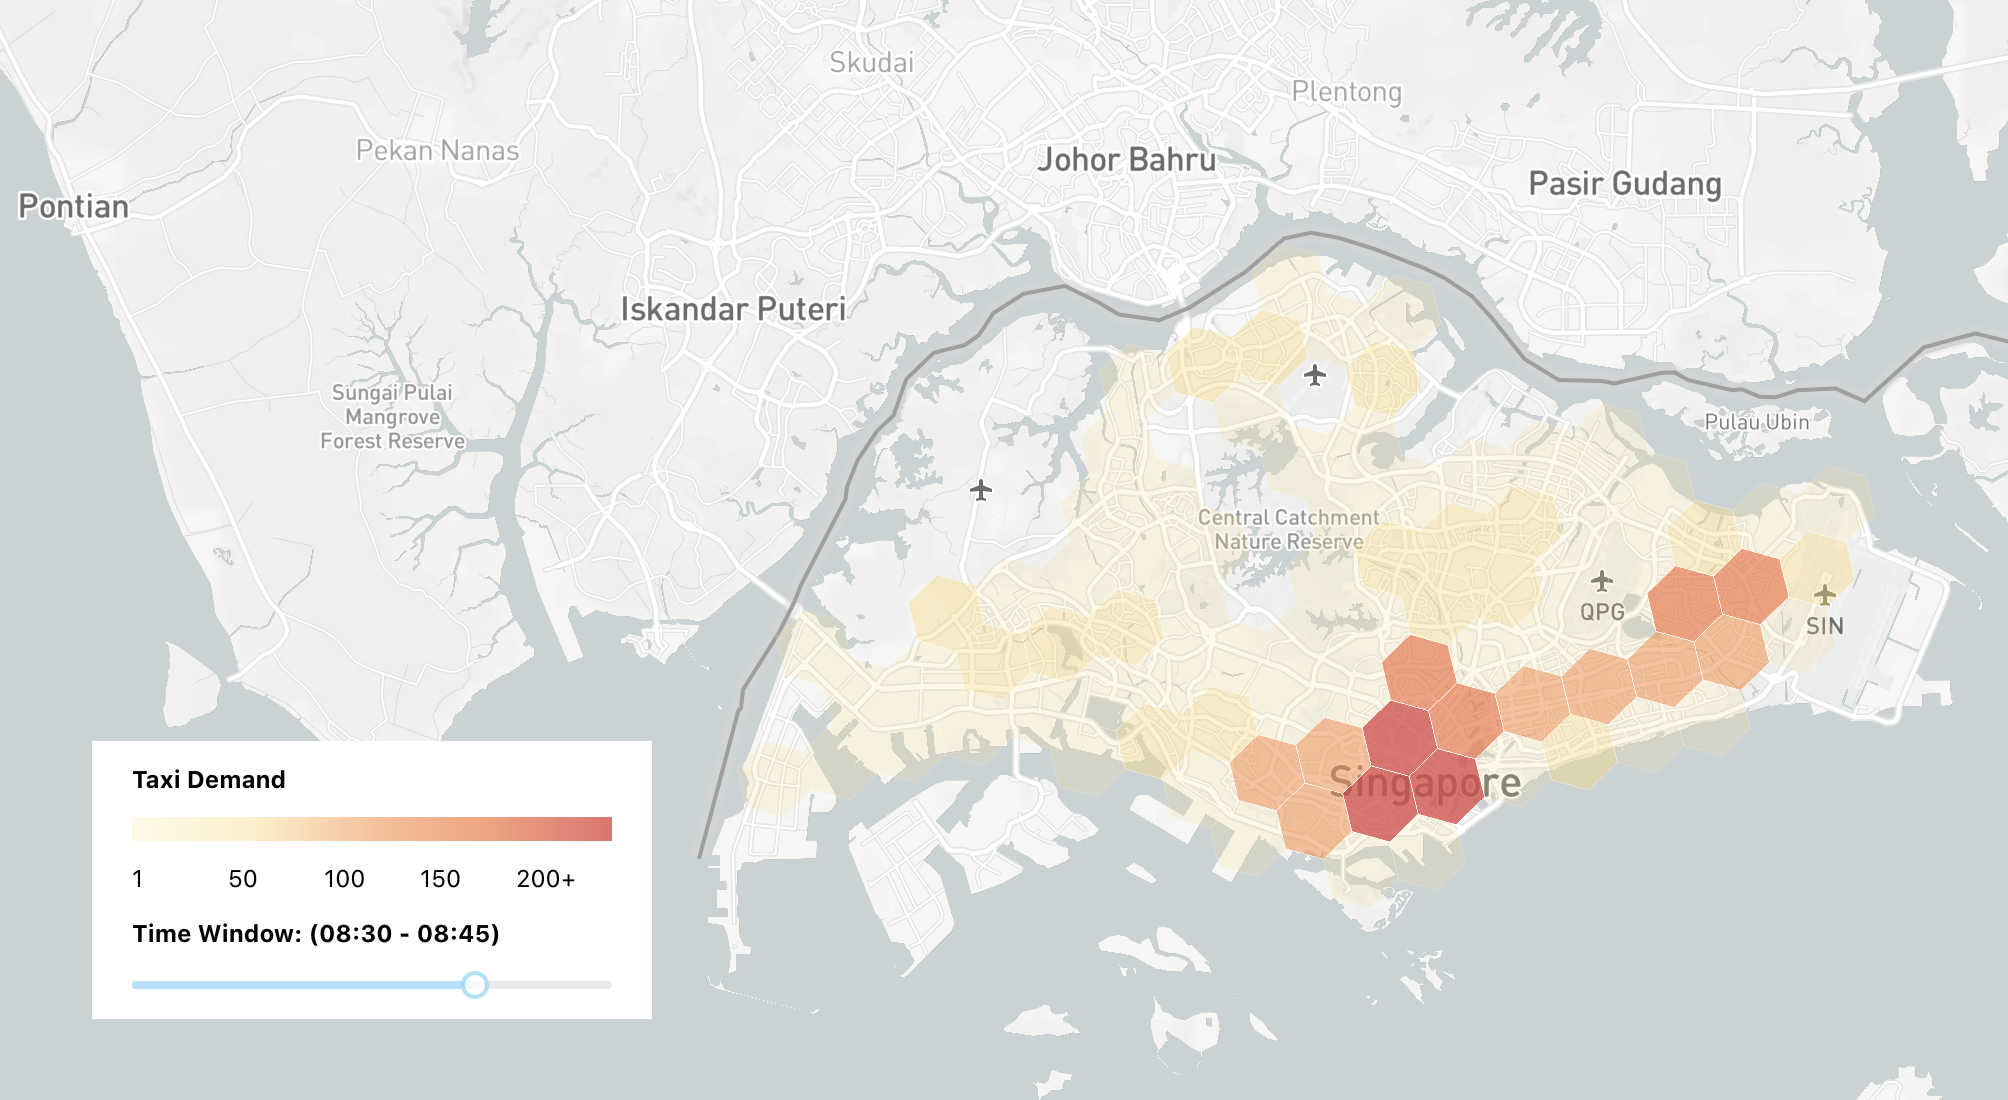
Taxi demand in Singapore from 08:30 - 08:45 on a weekday
Part 1: [Uber h3 js tutorial: How to draw hexagons on a map](https://afi.io/blog/uber-h3-js-tutorial-how-to-draw-hexagons-on-a-map/?ref=blog.afi.io)
Part 2: [Mapping taxi demand with Uber h3 js and react map gl](https://afi.io/blog/mapping-taxi-demand-with-uber-h3-js-and-react-map-gl?ref=blog.afi.io)
**Part 3: Visualizing taxi demand over time with Mapbox and React slider rc slider (this article)**
As with all my tutorials, you can find [working sample code for this project](https://github.com/afilabs/h3js%5Fhexagons%5Ftaxi%5Fdemand%5Ftime%5Fslider?ref=blog.afi.io) on Github. Unlike a typical tutorial where we work together to build an app from the ground up, the best way to work through this one is to download the [repository](https://github.com/afilabs/h3js%5Fhexagons%5Ftaxi%5Fdemand%5Ftime%5Fslider?ref=blog.afi.io) from Github, run it locally on your machine and refer to this blog post for an explanation of what each section of code does. The project is structured like a typical React single page app, with most of the heavy lifting done in `src/MapBoxTimelineSlider.jsx` which is responsible for loading the taxi booking data, drawing the map ([react-map-gl](https://visgl.github.io/react-map-gl/?ref=blog.afi.io)) and hexagonal cells ([h3-js](https://github.com/uber/h3-js?ref=blog.afi.io)) and most importantly, using the [rc-slider](https://github.com/react-component/slider?ref=blog.afi.io) React slider component to animate it.
### Taxi booking data
Let's start with our data set. `singapore_taxi_hexagons.json` ([link](https://github.com/afilabs/h3js%5Fhexagons%5Ftaxi%5Fdemand%5Ftime%5Fslider/blob/master/src/data/singapore%5Ftaxi%5Fhexagons.json?ref=blog.afi.io)) is derived from the same taxi status and position data file used in the last post.
```
/* singapore_taxi_hexagons.json */
{
"03/08/2016 07:15:00-03/08/2016 07:30:00": {
"876526375ffffff": 43,
"876526acaffffff": 41,
"876526365ffffff": 171,
"876526ac3ffffff": 225,
... 112 more entries
},
"03/08/2016 07:30:00-03/08/2016 07:45:00": {
"876526375ffffff": 63,
"876526acaffffff": 54,
"876526365ffffff": 224,
"876526ac3ffffff": 278,
"876526368ffffff": 18,
... 112 more entries
},
... 14 more time periods
}
```
The file is structured as a JavaScript object that contains the number of taxi bookings recorded in each h3 cell, sampled at 15 minute intervals from 6 am to 10 am e.g. 06:00 - 06:15, 06:15 - 07:00, ..., 09:45 - 10:00.
The keys of this object are a specially formatted date time string e.g. `03/08/2010 07:15:00-03/08/2010 07:30:00` refers to 7:15 am to 7:30 am (exclusive, i.e. it does not include 7:30 am). The value corresponding to each key is another key-value pair that maps the cell's H3 index to the number of bookings that took place inside it. For example, the JSON extract below means that H3 cell `876526375ffffff`
```
/* singapore_taxi_hexagons.json */
{
"03/08/2016 07:15:00-03/08/2016 07:30:00": {
"876526375ffffff": 43,
... 115 more entries
},
"03/08/2016 07:30:00-03/08/2016 07:45:00": {
"876526375ffffff": 63,
... 115 more entries
},
"03/08/2016 07:45:00-03/08/2016 08:00:00": {
"876526375ffffff": 93,
... 115 more entries
}
}
```
on 3rd August, 2016 had 43 bookings (taxi pickups) recorded within its boundaries between 07:15 and 07:30, 63 bookings between 07:30 and 07:45 and 93 bookings between 07:45 and 08:00\.
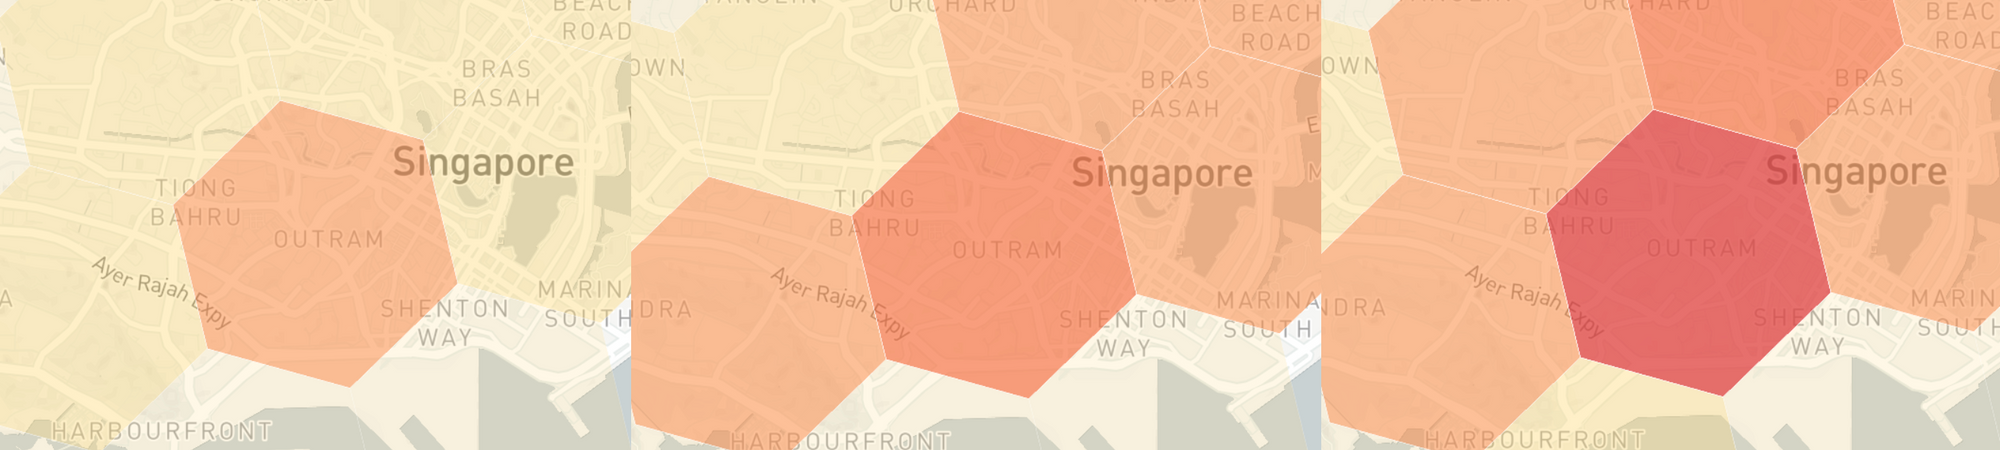
Time varying heatmap of taxi demand visualized using colored H3 cells
The goal of the application we are going to build in this project is to step through time and display an animated heatmap showing how these booking counts change over time. To do this, we are going to use a slider written in React JS, [react-component/slider](https://github.com/react-component/slider?ref=blog.afi.io), more commonly known as [rc-slider](https://github.com/react-component/slider?ref=blog.afi.io).
### Introduction to rc slider
[rc-slider](https://github.com/react-component/slider?ref=blog.afi.io) is part of [Ant Design's](https://ant.design/?ref=blog.afi.io) collection of high quality React components used to build rich, interactive user interfaces. It is one of the most popular React slider components out there, and with just a few lines of code:
```html
import Slider from "rc-slider";
import 'rc-slider/assets/index.css';
export default () => (
<>
Time Window: (07:00 - 07:15)
);
```
You can build a simple slider that looks just like this:

With a bit more styling from `MapBoxTimelineSlider.scss` ([link](https://github.com/afilabs/h3js%5Fhexagons%5Ftaxi%5Fdemand%5Ftime%5Fslider/blob/master/src/components/MapBoxTimelineSlider.scss?ref=blog.afi.io)), we can add a nice scale and position the slider at the center left of our map.
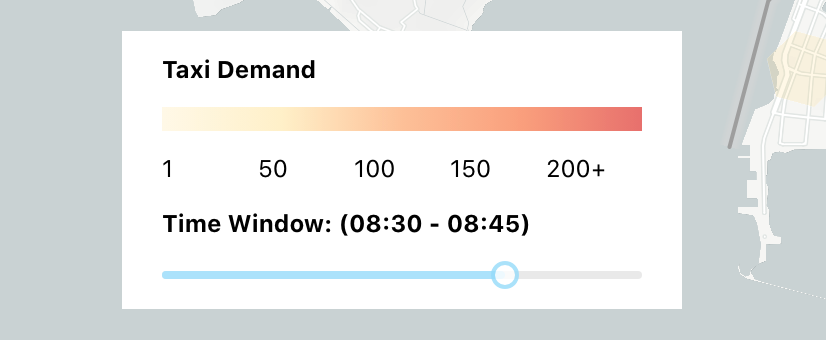
Integrating rc slider into our app takes a bit more work. Basically, there are two important sources of data in our app:
`timePeriods`: an array that contains a list of specially formatted date time strings.
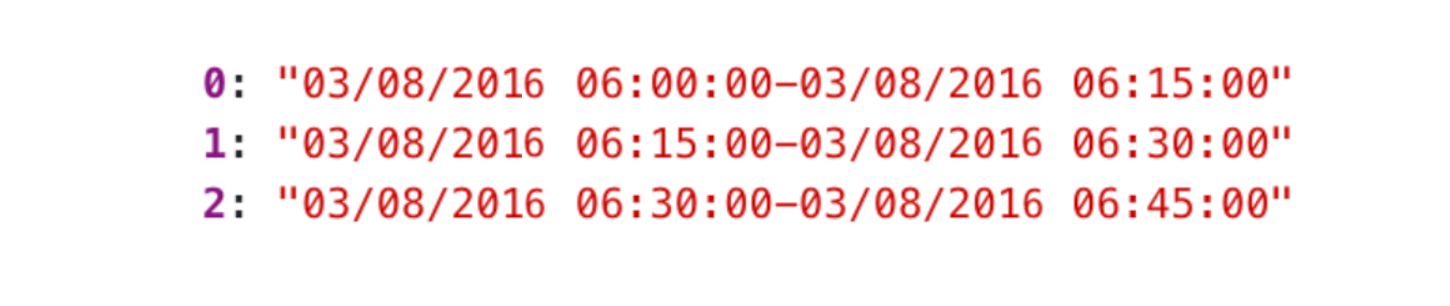
The timePeriods array
`singaporeTaxiHexagons`: the JavaScript object imported from the booking data file described in the previous section.

The singaporeTaxiHexagons object
Using the component, we are going to increment a global counter `currentStep` to retrieve the corresponding `timePeriod` date time string, which is then used to access the booking counts for `singaporeTaxiHexagons` from that time period. For example, if `currentStep` \= 2, `timePeriods[2]` \= `"03/08/2016 06:30:00-03/08/2016 06:45:00"` and `singaporeTaxiHexagons["03/08/2016 06:30:00-03/08/2016 06:45:00"]` \=

The JavaScript object that contains a mapping of taxi booking counts to H3 indexes
which is a JavaScript object that maps taxi booking counts to their corresponding H3 cells - exactly what we need!
### The React range slider component
Here is what the full [rc-slider](https://github.com/react-component/slider?ref=blog.afi.io) component looks like:
```html
/* MapboxTimelineSlider.jsx */
Time Window: ({sliderTitle})
```
`onChange`: The `onChange` prop lets your provide a callback (in this example, its the `handleSliderChange()` function) that is triggered whenever the value of the slider changes.
`min`: The minimum value of the slider. Since we are using the slider value to retrive elements from the `timePeriods` array, we are setting this to "0" so that we never risk running into an index out of bounds error.
`max`: The maximum value of the slider. Like with `min`, we set this to `timePeriods.length - 1` to avoid index out of bounds errors.
`value`: The current value of the slider. We set this to be equal to `currentStep` to keep it in sync with the data being displayed.
### handleSliderChange() method
When the user moves the slider, the new value is passed on to the `handleSliderChange()` method:
```
/* MapboxTimelineSlider.jsx */
const handleSliderChange = (step) => {
setCurrentStep(step);
setSliderTitle(timePeriods[step].substring(11,16) + " - " + timePeriods[step].substring(31,36))
updateHexagonData(step);
};
```
Here's a breakdown of what this method does:
1. First, we set the `currentStep` to the value of `step`, which is the new value of the slider. For example, if the user moves the slider one unit to the right, the new slider value of 1 is passed on to `step` which is used to update the value of `currentStep` via its corresponding `useState` hook ( `const [currentStep, setCurrentStep] = useState(0);` ).
2. Next, we update the title of the slider based on the value of `currentStep` e.g. if `currentStep` is 1, `timePeriods[1]` is "03/08/2010 06:15:05-03/08/2010 06:30:05" so the slider title will be a shortened "06:15 - 06:30".
3. Finally, a call is made to the `updateHexagonData()` method to load the taxi booking data that matches `currentStep`.
### updateHexagonData() method
The `updateHexagonData()` method retrieves taxi booking data as a tuple `{ hexindex7, bookingCount}` for the 15 minute time period that matches value of `step` passed to it. This data is stored in the `sgHexagonsArr` array.
```
/* MapboxTimelineSlider.jsx */
const updateHexagonData = (step) => {
const singaporeHexagonsArr = singaporeTaxiHexagons[timePeriods[step]];
const sgHexagonsArr = [];
singaporeHexagonsArr.forEach(singaporeHexagon => {
sgHexagonsArr.push({
hexindex7: singaporeHexagon.key,
bookingCount: singaporeHexagon.count
});
})
const rs = sgHexagonsArr.map((row) => {
const style = getStyle(row);
return {
type: "Feature",
properties: {
color: style.color,
opacity: style.opacity,
id: row.hexindex7,
},
geometry: {
type: "Polygon",
coordinates: [cellToBoundary(row.hexindex7, true)],
},
};
});
setSingaporeHexagonsArr(rs);
}
```
After that, we map `sgHexagonsArr` to a new array `rs` ("row style") of [Mapbox style objects](https://docs.mapbox.com/help/glossary/style/?ref=blog.afi.io), and use the `getStyle()` method to map booking counts to the corresponding `color` and `opacity` values (see next section).
Lastly, we copy over `rs` to `singaporeHexagonsArr` by using the `setSingaporeHexagonsArr()` function (part of React's `useState` hook). This way, the new `singaporeHexagonsArr` array and associated data is available to the [react-map-gl](https://visgl.github.io/react-map-gl/?ref=blog.afi.io) and components for rendering.
```
/* MapboxTimelineSlider.jsx.js component */
```
### getStyle() method
The final method we'll look at is `getStyle()`, which basically maps taxi booking counts to a range of colors and opacity values for the associated H3 hexagon.
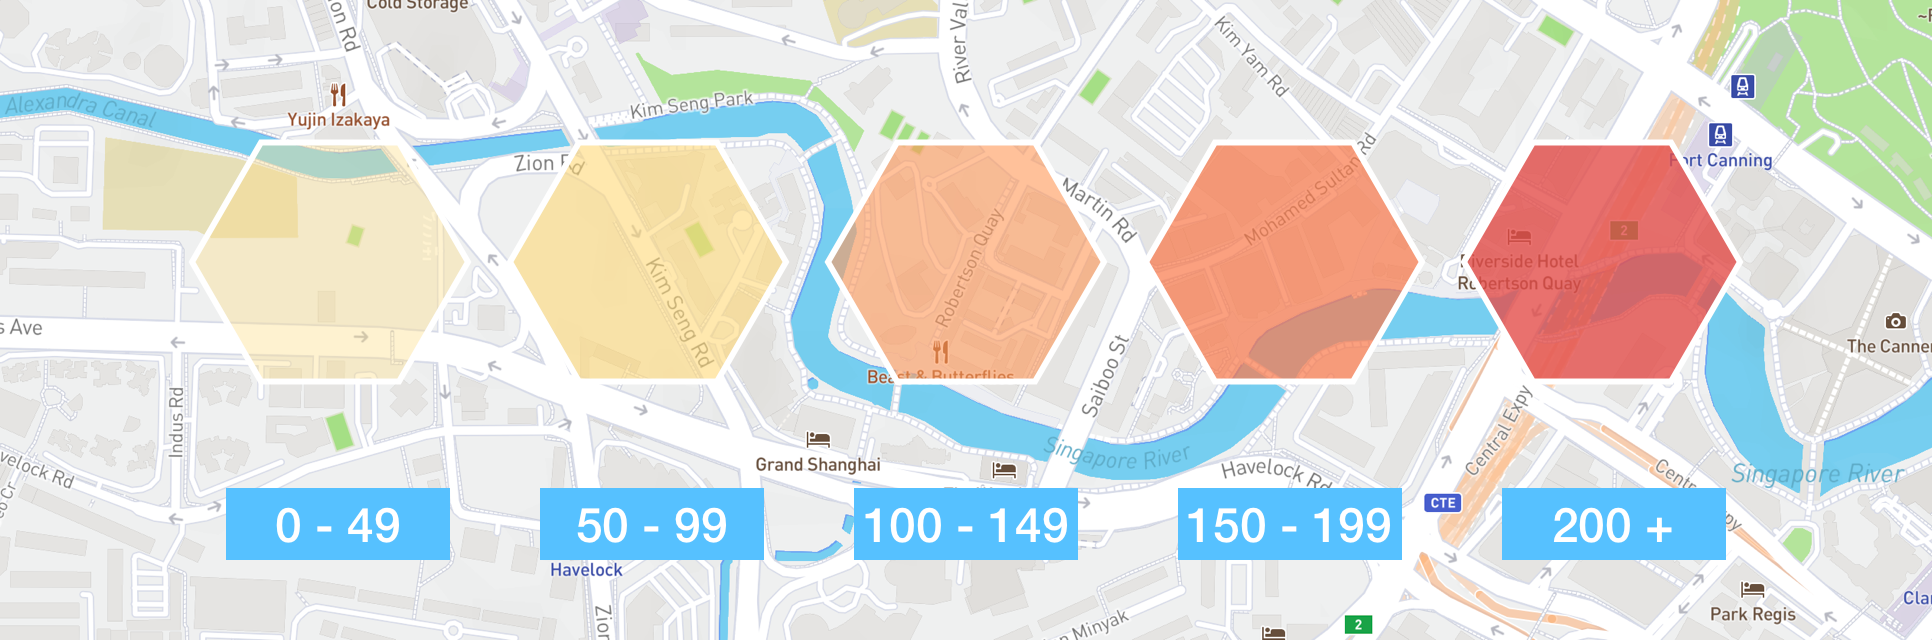
The range of H3 cell colors and opacities used to visualize taxi demand
```
/* MapboxTimelineSlider.jsx */
const getStyle = (row) => {
const styles = [
{
color: '#FEDD87',
opacity: 0.2
},
{
color: '#FED976',
opacity: 0.4
},
{
color: "#FC9653",
opacity: 0.6,
},
{
color: "#F77645",
opacity: 0.7
},
{
color: "#E14C48",
opacity: 0.8
}
];
if (Number(row.bookingCount) === 0) {
return {opacity: 0};
}
if (Number(row.bookingCount) < 50) {
return styles[0];
}
if (Number(row.bookingCount) < 100) {
return styles[1];
}
if (Number(row.bookingCount) < 150) {
return styles[2];
}
if (Number(row.bookingCount) < 200) {
return styles[3];
}
return styles[4];
};
```
These styles are rendered in the component of our map, with the `fill-color` and `fill-opacity` values retrieved from the parent component.
### Testing the React range slider component
Clone [this project's repository](https://github.com/afilabs/h3js%5Fhexagons%5Ftaxi%5Fdemand%5Ftime%5Fslider?ref=blog.afi.io) and in your terminal, run `npm install` to install dependencies followed by `npm start` to run the app.
0:00
/0:14
1×
An animated heat map of taxi demand in Singapore on a weekday from 6 am - 10 am
Spin up localhost:3000 on your favorite browser and if everything worked correctly, you should be able to see a map of Singapore (above). Use the [rc-slider range slider](https://github.com/react-component/slider?ref=blog.afi.io) on the left to step through each 15 minute time period starting from 6 am. You'll see that taxi demand starts off low in the early morning but quickly picks up with sustained demand coming from the Central Business District, the Airport and a stretch of high density housing across Singapore's East Coast.
And that's the end of this tutorial series! You now have a fully working example of how to build an interactive map of taxi demand across Singapore using [h3-js](https://h3geo.org/?ref=blog.afi.io), [react-map-gl](https://visgl.github.io/react-map-gl?ref=blog.afi.io) and [rc-slider](https://slider-react-component.vercel.app/?ref=blog.afi.io).
Part 1:[ Uber h3 js tutorial: How to draw hexagons on a map](https://afi.io/blog/uber-h3-js-tutorial-how-to-draw-hexagons-on-a-map/?ref=blog.afi.io)
Part 2: [Mapping taxi demand with Uber h3 js and react map gl](https://afi.io/blog/mapping-taxi-demand-with-uber-h3-js-and-react-map-gl/?ref=blog.afi.io)
Part 3: [Visualizing taxi demand over time with Mapbox and React range slider rc slider](https://afi.io/blog/visualizing-taxi-demand-over-time-with-mapbox-and-react-slider-rc-slider?ref=blog.afi.io)
👋 **As always, if you have any questions or suggestions for me, please** [**reach out**](https://yourls.afi.io/newcontact?ref=blog.afi.io) **or** [**say hello on LinkedIn**](https://www.linkedin.com/in/afian-anwar-a023b143/?ref=the-afi-labs-blog)**.**