Add map markers, overlays and polylines to Google Maps 3D
Learn how to add and style 3D markers, overlays, and polylines with the Google Photorealistic 3D Tiles API.

Adding custom 3D markers, overlays, and polylines to a Google Photorealistic 3D Tiles map can dramatically improve the way users interact with your app. In this tutorial, you'll learn how to annotate your 3D map with rich, styled geospatial data using the Google Photorealistic 3D Tiles API.
Part 1: What is the Google Photorealistic 3D Tiles API?
Part 2: How to pan, zoom, and adjust tilt on Google Maps 3D
Part 3: Use Place Autocomplete to go anywhere on Google Maps 3D
Part 4: Add map markers, overlays and polylines to Google Maps 3D (this article)
Part 5: Add a 3D polygon to a Google Photorealistic 3D map
Part 6: Senakw Vancouver on a Photorealistic 3D Map. Will it block your view?
How to add map markers with the Google Photorealistic 3D Tiles API
Adding markers to a Google 3D map is just as straightforward as placing them on a regular 2D map. Google’s 3D maps support two types of markers: Marker3DElement and Marker3DInteractiveElement (docs). The only real difference is that Marker3DInteractiveElement lets users click on the marker.
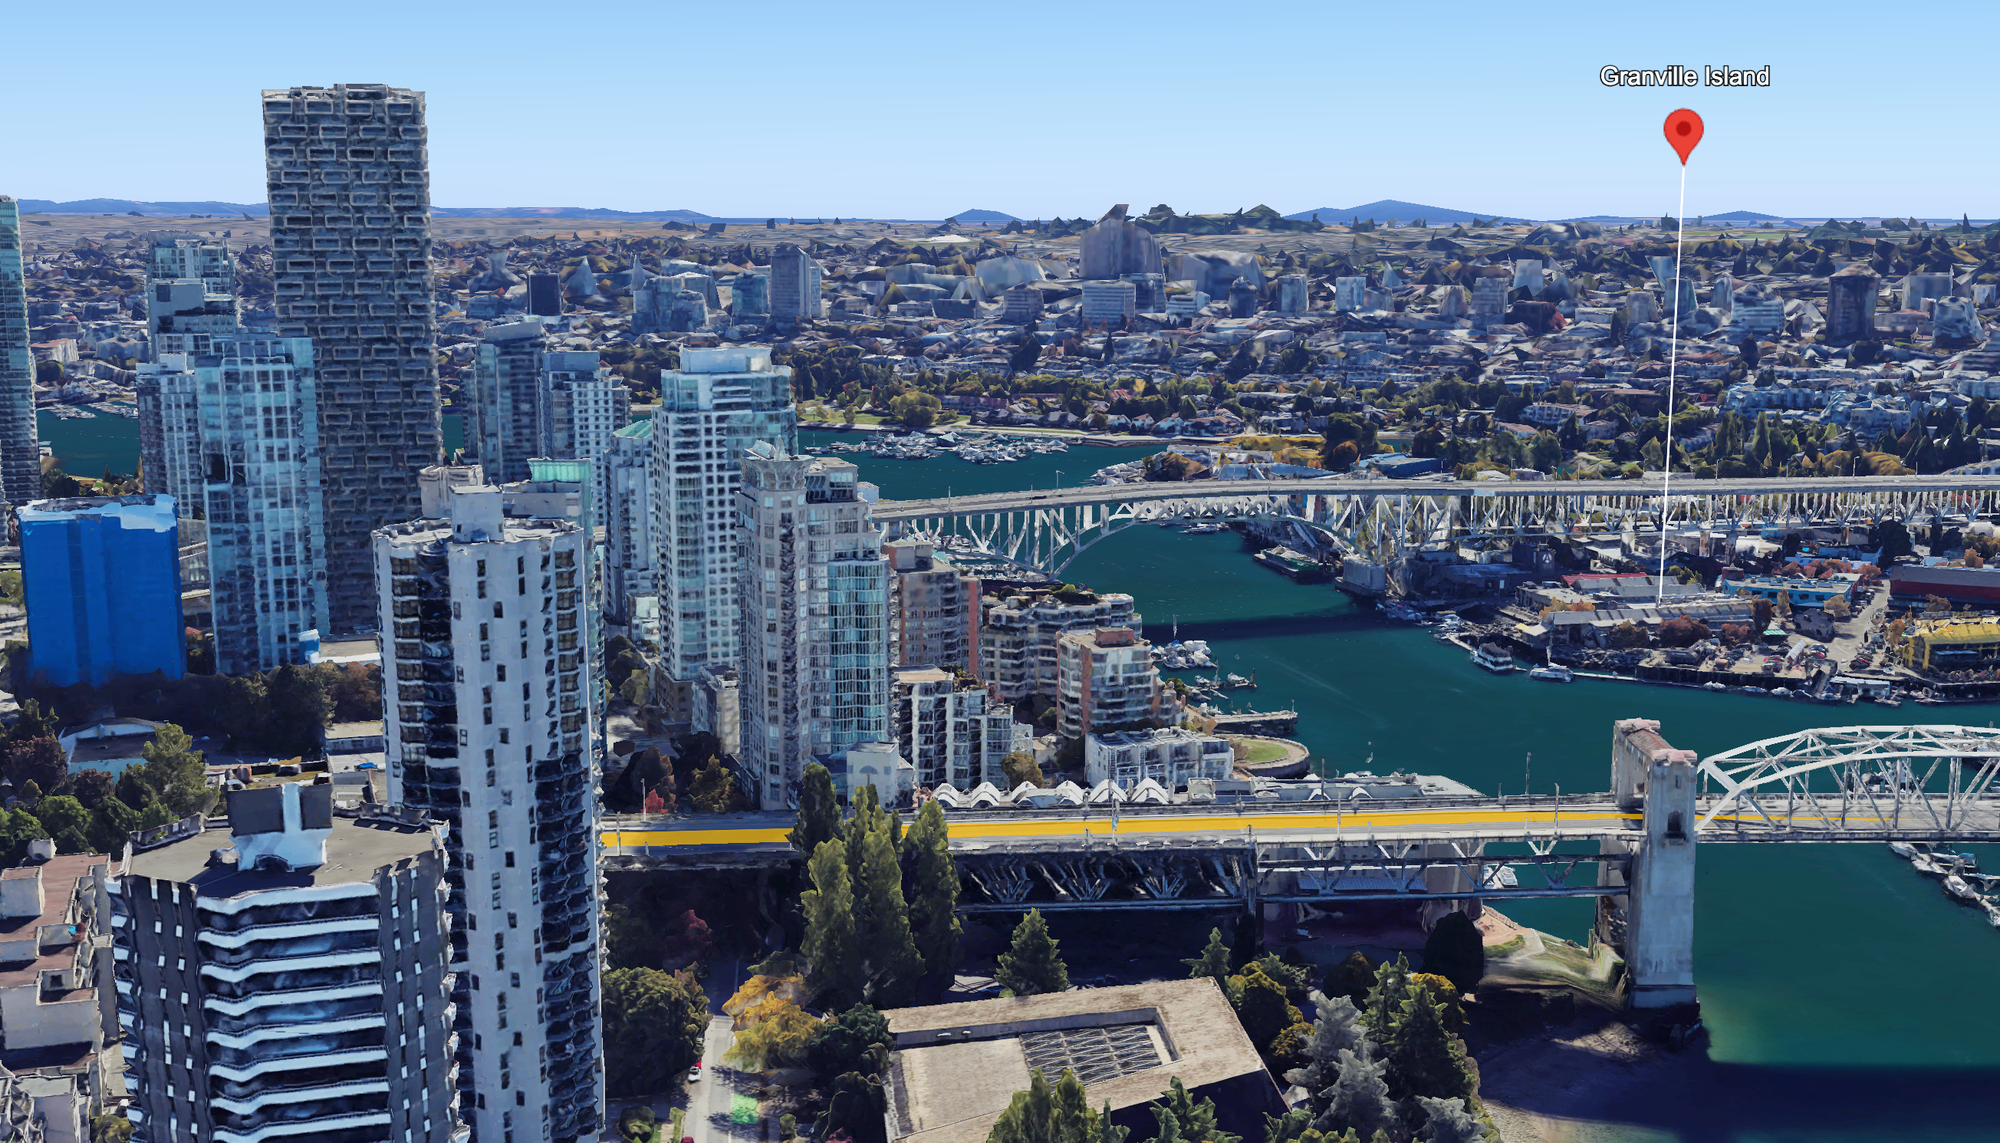
The first thing to understand is that markers on a 3D map are fully three-dimensional, just like the rest of the map. This means each marker can include a height (altitude), which can be set relative to sea level, the terrain, the 3D mesh, or simply clamped to the ground, ignoring the altitude altogether. For most apps, using altitudeMode: 'ABSOLUTE' works best because it ensures that your marker will not be blocked by any tall buildings.
Add a simple map marker to a 3D scene
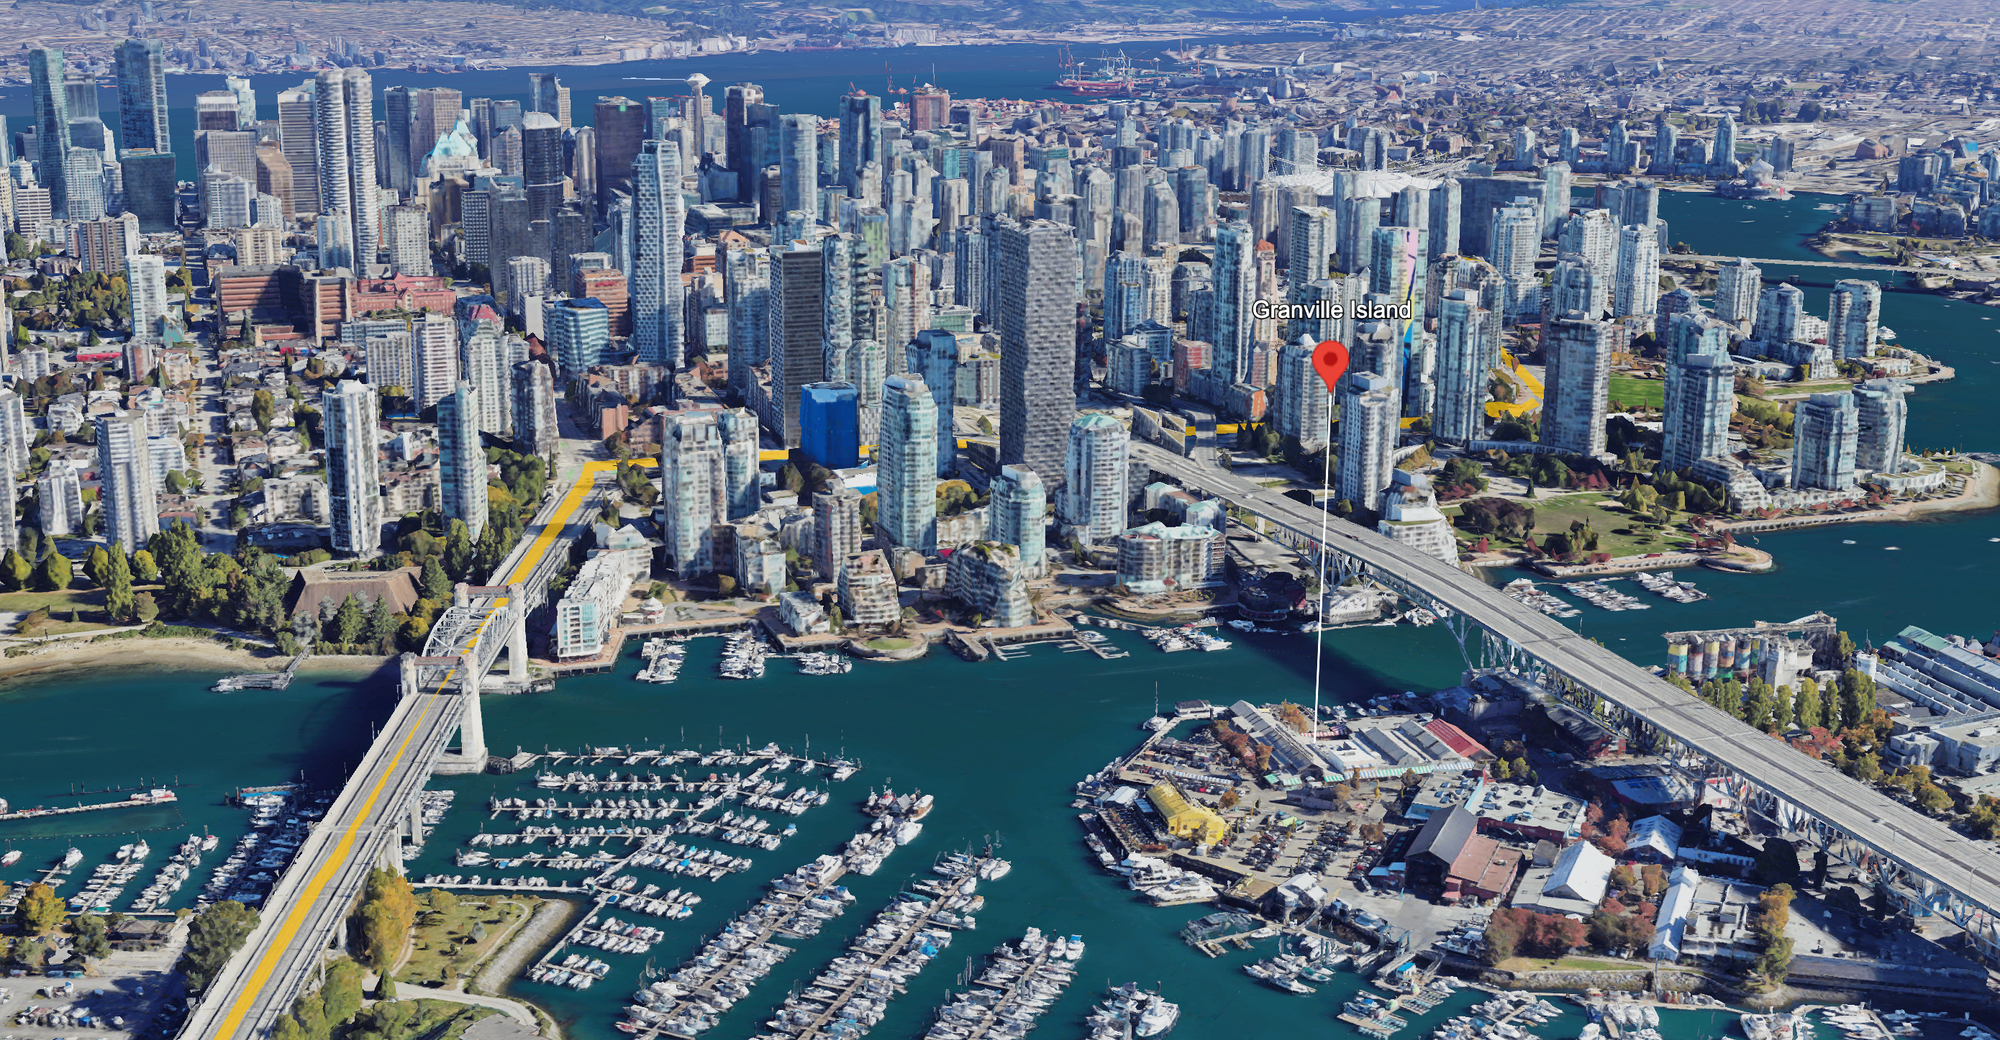
Here's how you can add the familiar red Google Maps marker to your 3D map.
- Import the
Marker3DElementfrom the Google Maps Javascript library.
const { Marker3DElement } = await google.maps.importLibrary("maps3d");- Add a
<gmp-map-3D/>component to the body of your HTML page. This sets up the 3D scene using the Photorealistic 3D Tiles API.
<gmp-map-3d mode="SATELLITE" heading="120" range="2000" tilt="35" center="49.2736533,-123.1395109, 50"></gmp-map-3d>
- Retrieve the
<gmp-map-3D/>element from the DOM and save it to the variablemap3D.
const map3D = document.querySelector('gmp-map-3d');- Write a function,
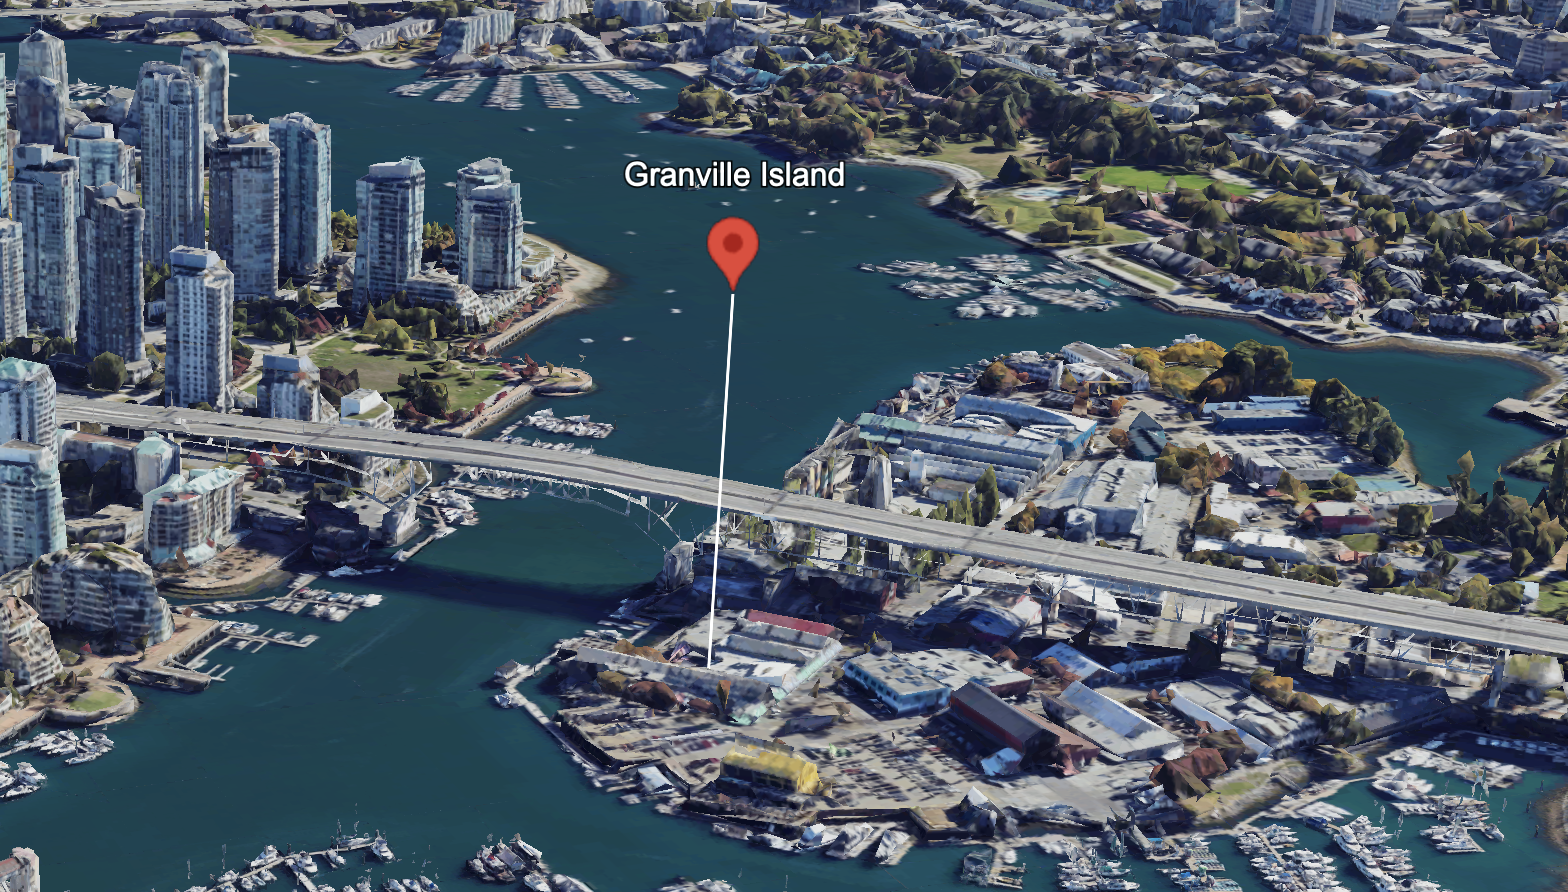
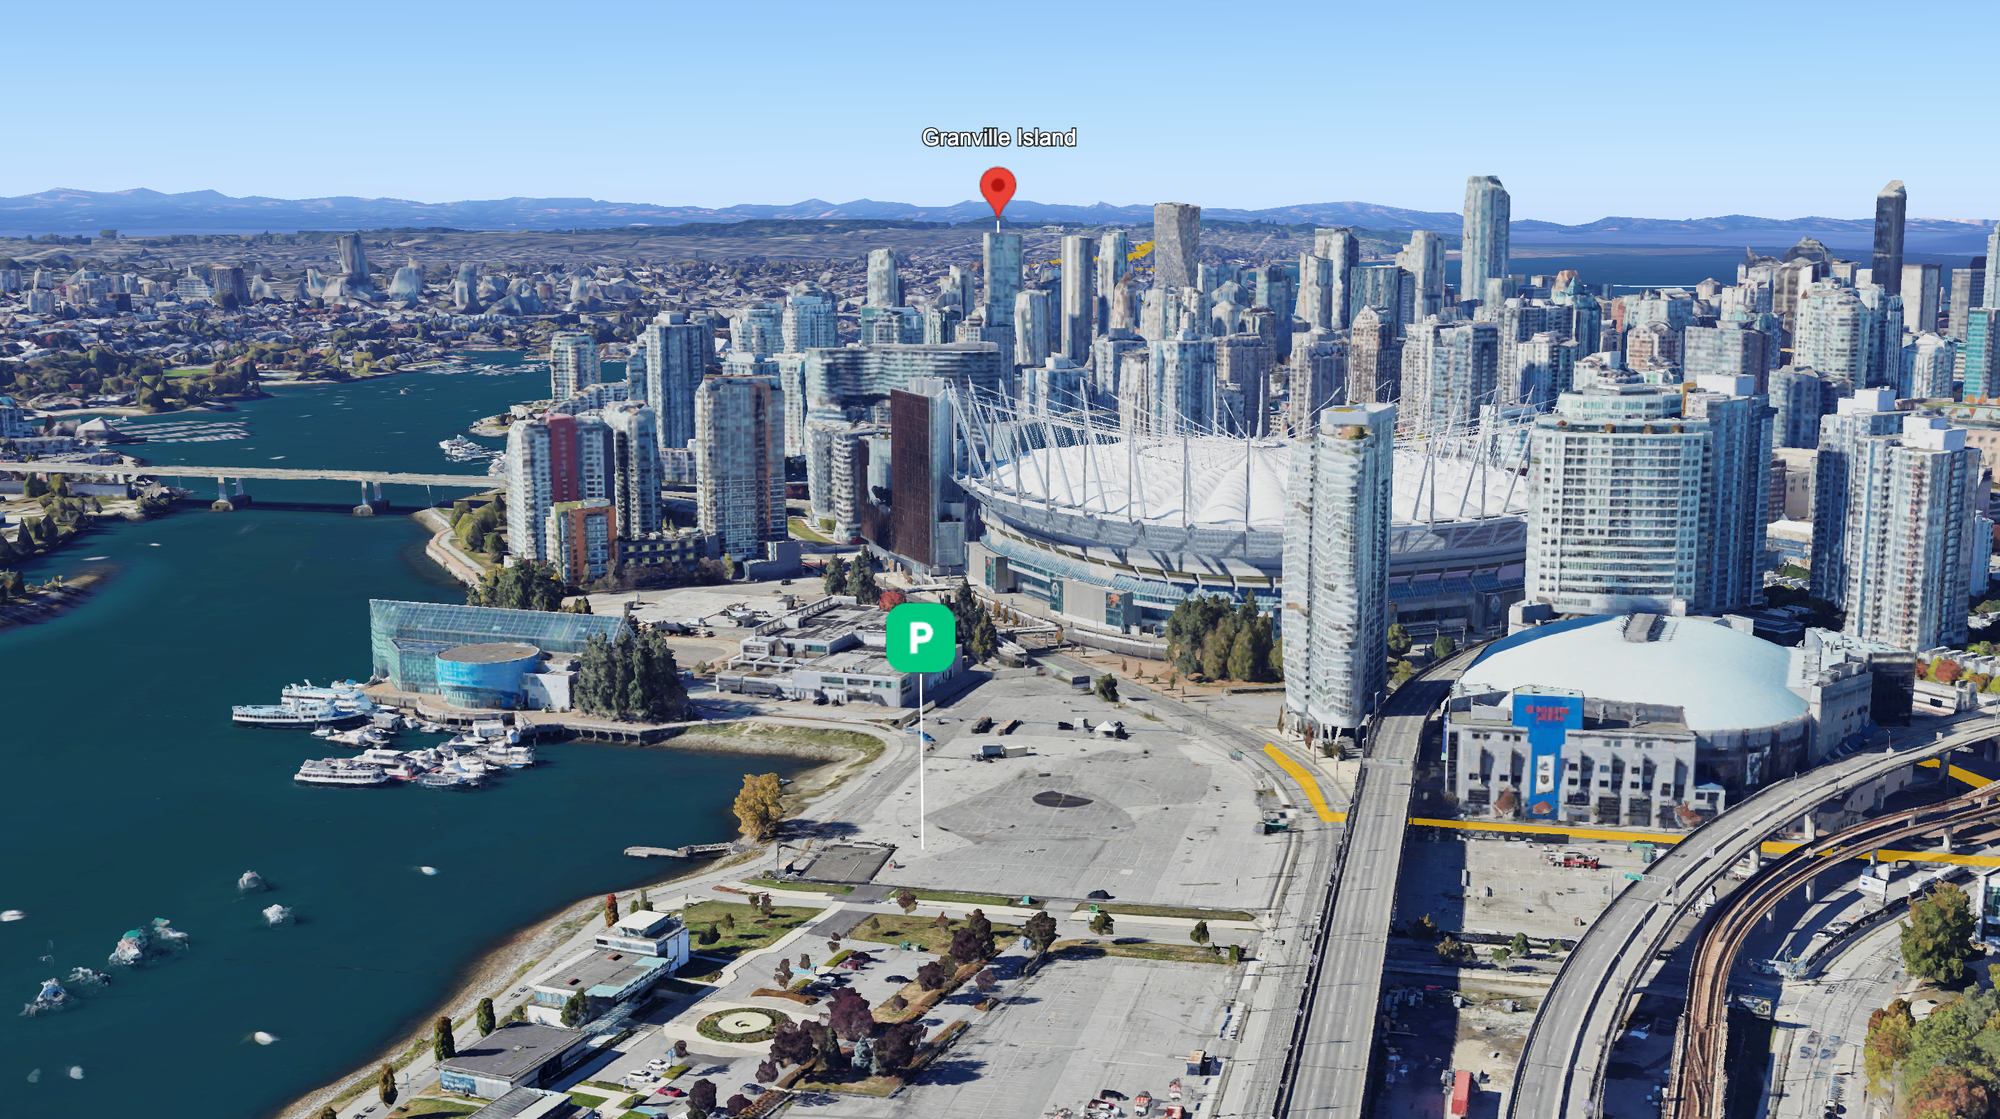
drawMarker(), that creates a newMarker3DElementat a specific position (latandlng) andaltitude. To draw a small line down to the ground to help show the actual position in relation to the height, addextruded: trueto the function call.
async function drawMarker() {
  const marker = new tr({
    position: { lat: 49.272621, lng: -123.135239, altitude: 150 },
    label: "Granville Island",
    altitudeMode: "ABSOLUTE",
    extruded: true,
  });

  map3D.append(marker);
}
The other options (docs) for altitudeMode are:
- "CLAMP_TO_GROUND" (marker remains at ground level)
- "RELATIVE_TO_MESH" (marker is placed relative to the highest of ground+building+water surface. When over water, this will be water surface; when over built up areas, this will be the building surface).
In my experience, setting altitudeMode: 'ABSOLUTE' with a relative high altitude value gives best results.
Don't forget to add the marker to the map with map3D.append(marker);. If you need to remove it, simply retrieve the <gmp-marker-3D/> component from the DOM and clear it from the map.
const marker = document.querySelector('gmp-marker-3d');
marker.remove();
Draw map markers behind buildings
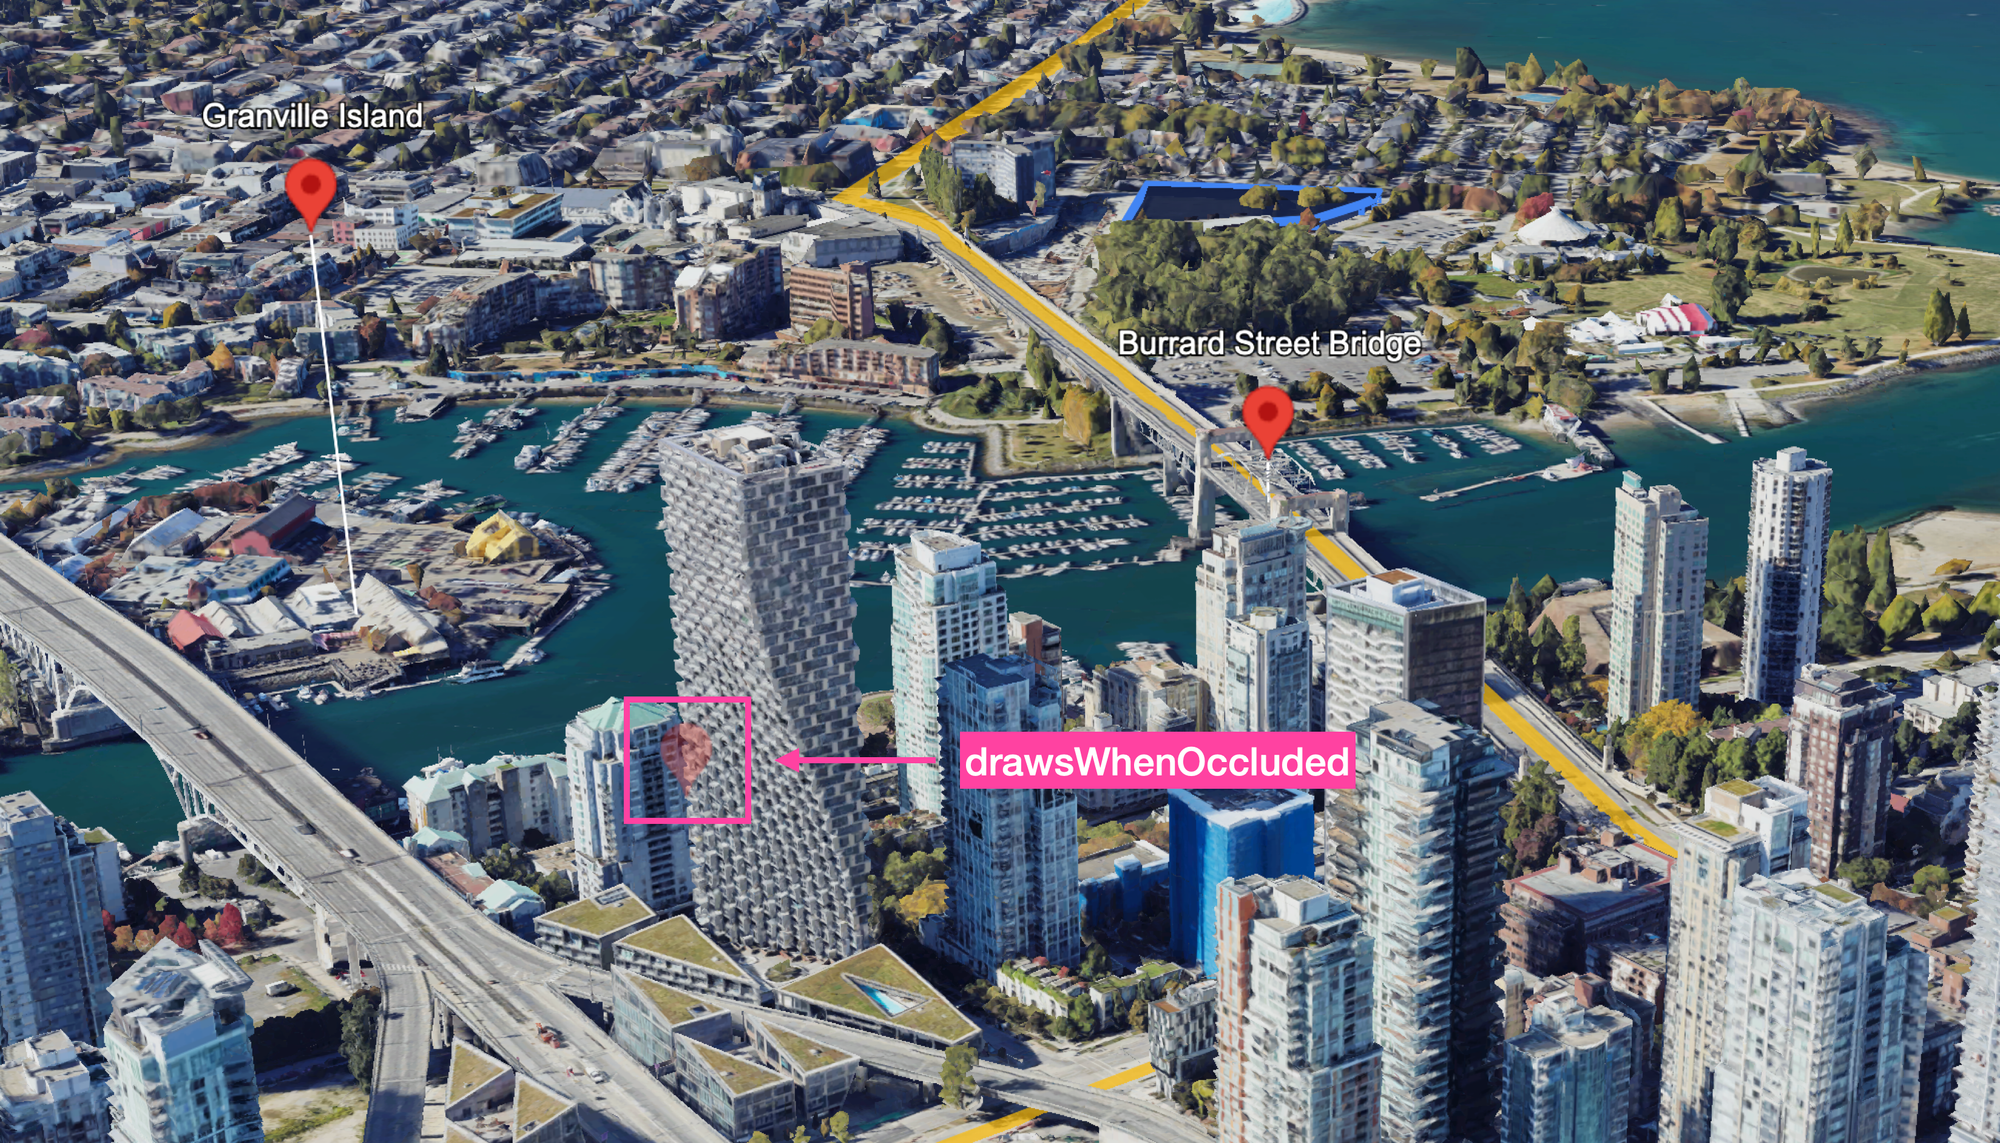
When using Photorealistic 3D Tiles in areas with tall buildings, like downtown Vancouver, you might run into situations where a skyscraper blocks your map markers. In the example above, the middle marker is hidden behind the iconic (and leaky) Vancouver House, but it remains visible thanks to the drawsWhenOccluded: true setting.
async function drawWhenOccludedMarker() {
  const marker = new Marker3DElement({
    position: { lat: 49.2743238, lng: -123.1325957, altitude: 25 },
    altitudeMode: "ABSOLUTE",
    extruded: true,
    drawsWhenOccluded: true,
  });

  map3D.append(marker);
}
Change map marker color, border and size
If you don't like the default red Google Maps marker, you're in luck! You can customize the marker any way you want with just a few lines of code.
- First, make sure the
PinElementlibrary is correctly loaded from the Maps Javascript API.PinElementlets you customize the appearance of a standard marker, including its border color, interior circle color, and background fill color.
const { PinElement } = await google.maps.importLibrary('marker');- Next, we are going to make changes to the
background(fill),borderColor(border) andglyphColor(interior circle). Create a newPinElementobject and append it to the marker. We'll also enlarge it by addingscale: 2.0to the marker properties.
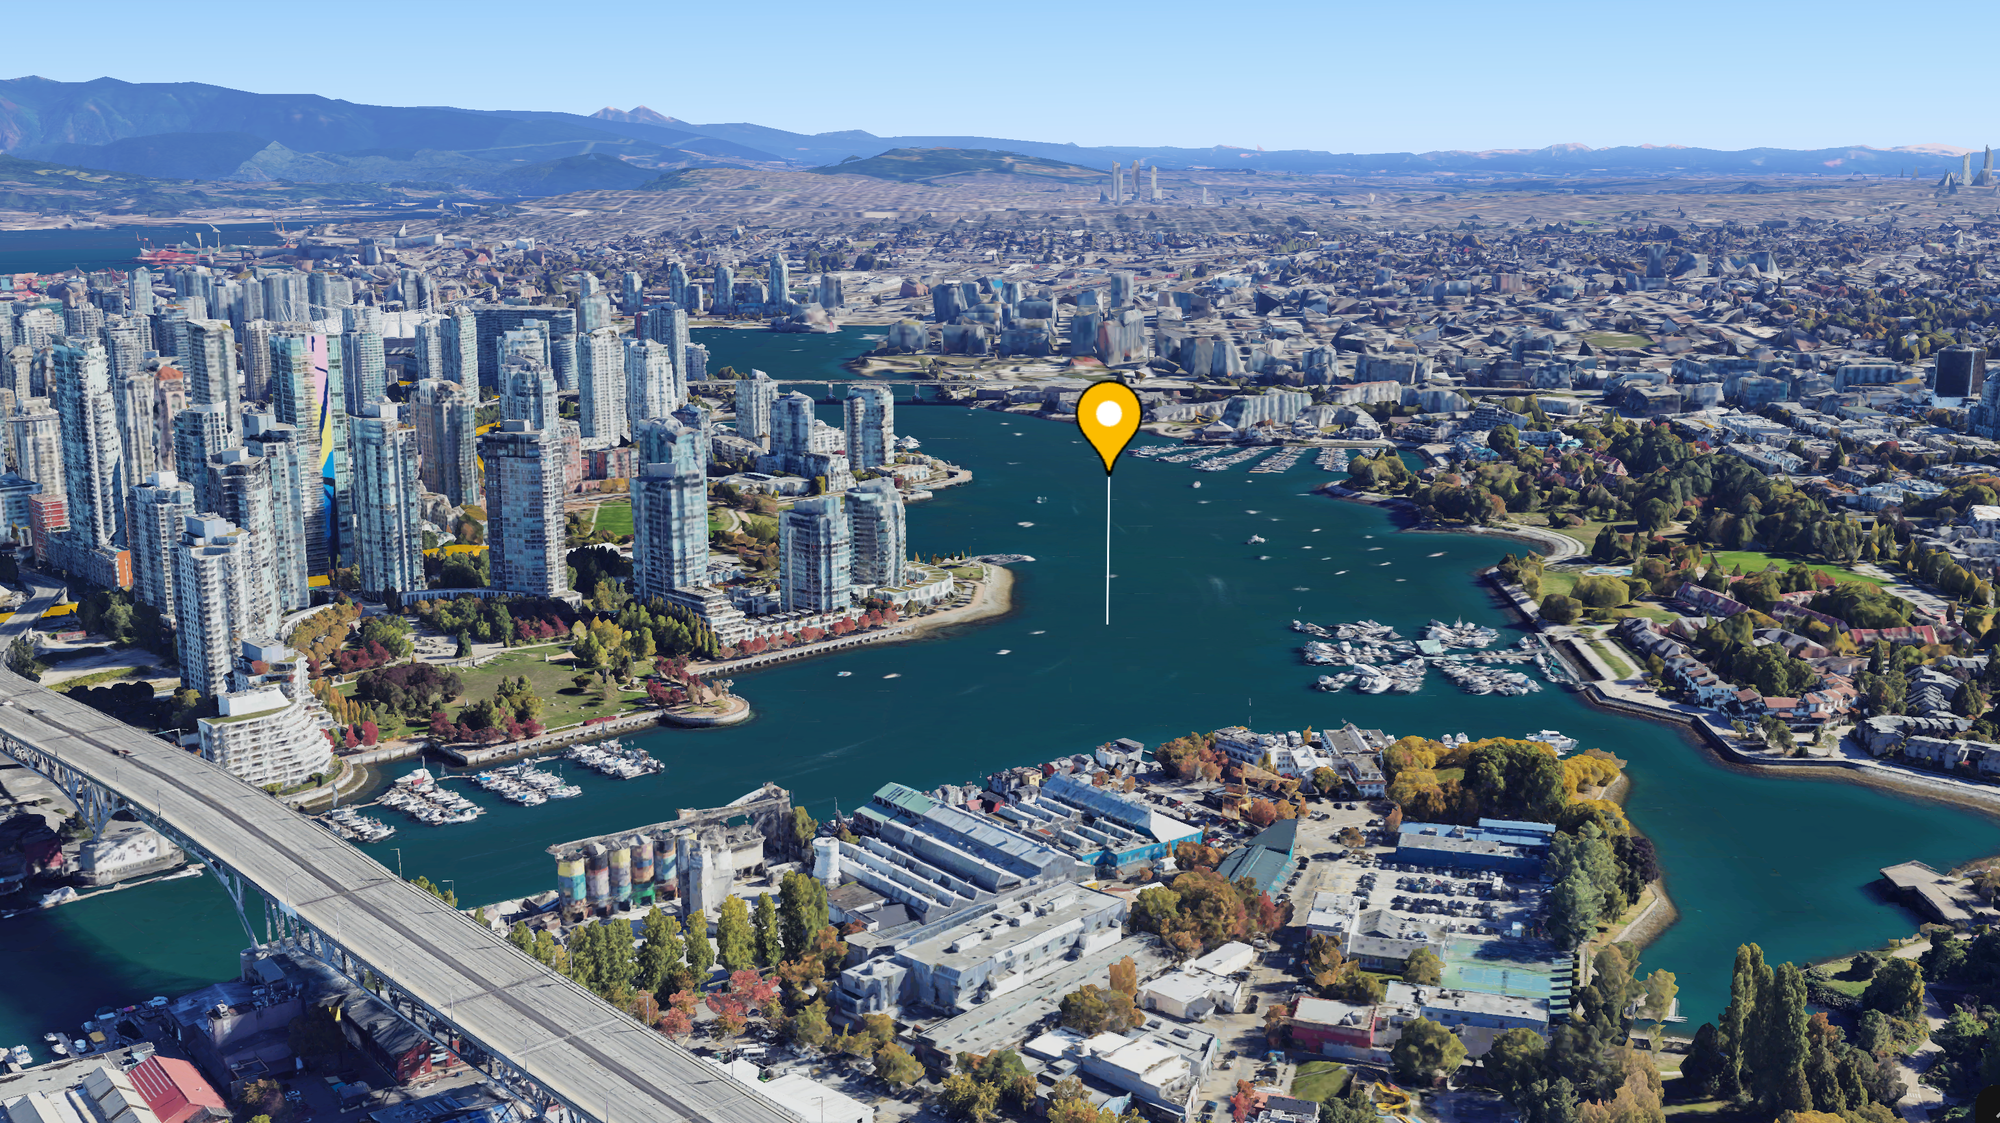
The following code draws a yellow marker with a white background and white interior circle, scaled 2x.
async function drawCustomStyleMarker() {
  const pinBackground = new PinElement({
    background: "#FBBC04",
    glyphColor: "#FFFFFF",
    borderColor: "#000000",
    scale: 2.0,
  });
  const customMarker = new Marker3DElement({
    position: { lat: 49.270082, lng: -123.127514, altitude: 75 },
    altitudeMode: "ABSOLUTE",
    extruded: true,
  });
  customMarker.append(pinBackground);
  map3D.append(customMarker);
}
Use SVG markers
If you want to customize your markers even further, you can use SVGs. SVGs, or Scalable Vector Graphics, are widely used in modern web apps because they are small in size and fast to load. One of the drawbacks of the Photorealistic 3D Tiles API is that it rasterizes SVGs before they are rendered, so they are not as sharp and crisp as I'd like. To use an SVG as a 3D map marker, follow these steps:
- Define an SVG as a string. This could be as simple as opening up the SVG file in your favorite text editor and copy + pasting it into your
<script/>tags.
const svgIconStr = '<svg width="50" height="50" ... </svg>';
- Parse the string into an actual SVG element using Javascript's built in DOM parser.
const parser = new DOMParser();
const svgIcon = parser.parseFromString(svgIconStr, 'image/svg+xml').documentElement;
- Create a
<template/>and insert the SVG into it. A <template> element is a way to hold HTML content that isn't immediately rendered on the page, and allows us to reuse the SVG as needed.
const templateForSvg = document.createElement('template');
templateForSvg.content.append(svgIcon);
- Create the
Marker3DElementobject, append the template to theMarker3DElementmarker and add it to the map. The example below inserts a greenPicon at an empty parking lot near BC Place in Vancouver.
async function drawSVGMarker() {
  const svgIconStr =
    '<svg width="50" height="50" viewBox="0 0 20 20" fill="none" xmlns="http://www.w3.org/2000/svg"><rect width="20" height="20" rx="6" fill="#00C882"/><g clip-path="url(#clip0_2054_854)"><path d="M10.5 5.5H7V14.5H9V11.5H10.5C12.155 11.5 13.5 10.155 13.5 8.5C13.5 6.845 12.155 5.5 10.5 5.5ZM10.6 9.5H9V7.5H10.6C11.15 7.5 11.6 7.95 11.6 8.5C11.6 9.05 11.15 9.5 10.6 9.5Z" fill="white"/></g><defs><clipPath id="clip0_2054_854"><rect width="12" height="12" fill="white" transform="translate(4 4)"/></clipPath></defs></svg>';
  const parser = new DOMParser();
  const svgIcon = parser.parseFromString(
    svgIconStr,
    "image/svg+xml",
  ).documentElement;

  const templateForSvg = document.createElement("template");
  templateForSvg.content.append(svgIcon);

  const svgMarker = new Marker3DElement({
    position: { lat: 49.276252, lng: -123.107151, altitude: 50 },
    altitudeMode: "ABSOLUTE",
    extruded: true,
  });

  svgMarker.append(templateForSvg);

  map3D.append(svgMarker);
}
How to draw overlays on Google Maps 3D
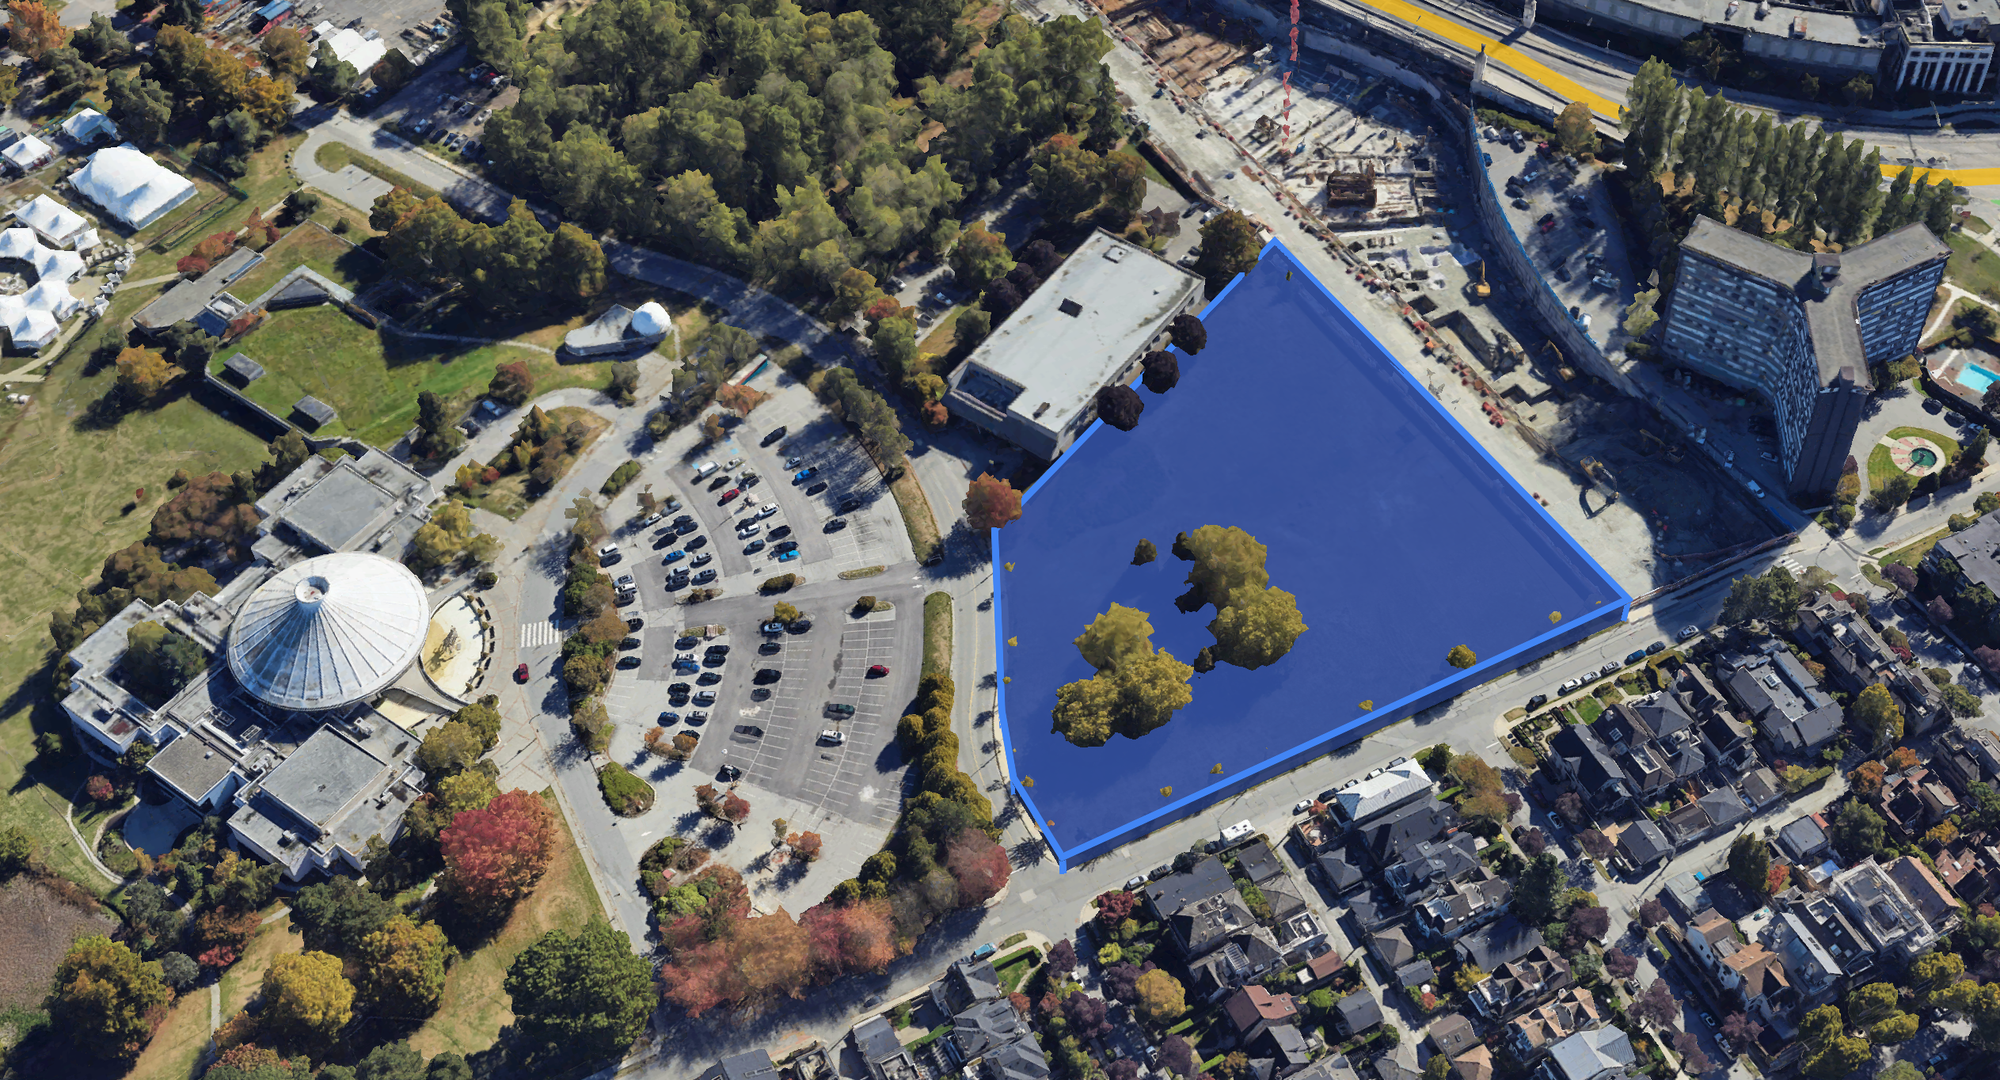
Overlays are shapes placed on top of a 3D map, much like polygons on a 2D map, but tailored for use in a 3D environment. They’re useful for highlighting boundaries or areas of interest. For example, a real estate developer might use overlays to outline a plot of land for sale or to highlight nearby parks and amenities.
To add an overlay, all you need to do is insert a <gmp-polygon-3d/> tag in between the <gmp-map-3d/> tags like so:
<gmp-map-3d mode="SATELLITE" heading="120" range="2000" tilt="35" center="49.2736533,-123.1395109, 50">
   <gmp-polygon-3d altitude-mode="relative-to-ground" fill-color="rgba(66, 103, 210, 0.9)" stroke-color="#4285F4" stroke-width="8" extruded>
   <gmp-polygon-3d></gmp-polygon-3d>
</gmp-map-3d>
altitude-mode specifies how the height of the overlay is interpreted. Use "relative-to-ground" to have the overlay height follow terrain height (docs).
fill-color is the color of the interior of the overlay. fill-color appears darker when the overlay is viewed at an angle.
stroke-color is the color of the overlay border.
stroke-width is the width of the border.
extruded specifies whether to connect the polygon to the ground.
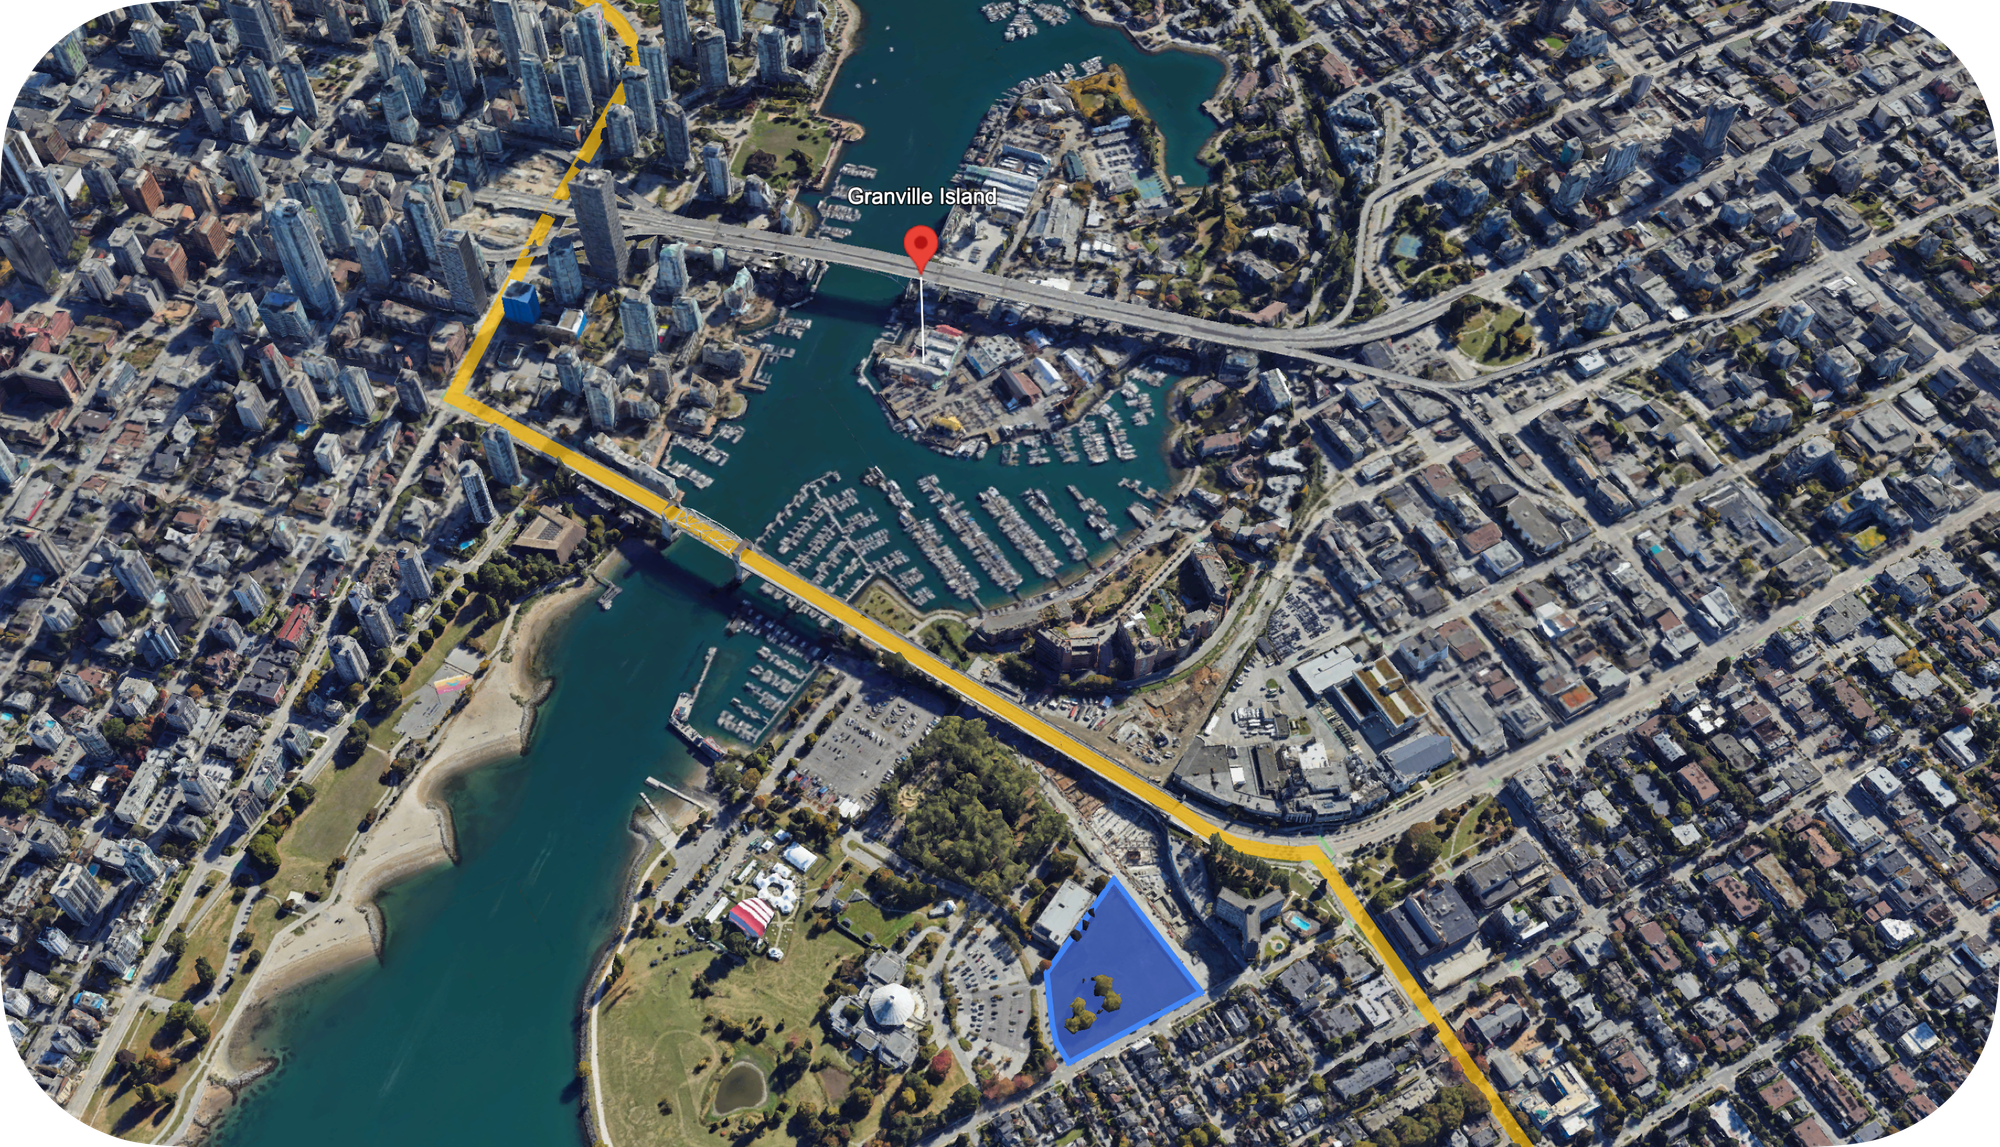
Finally, to specify the boundaries of the overlay we need to express it as alat, lng, altitude tuple and add append to the <gmp-polygon-3d/> tag. Here's an example of a blue overlay on a irregularly shaped field in Kitsilano, Vancouver.
async function drawOverlay() {
  const overlay = document.querySelector("gmp-polygon-3d");

  const overlayCoords = [
    { lng: -123.14435270842225, lat: 49.274087269123925, altitude: 5 },
    { lng: -123.14502638026526, lat: 49.27502303650934, altitude: 5 },
    { lng: -123.14564727597318, lat: 49.275215454009725, altitude: 5 },
    { lng: -123.14587079842823, lat: 49.27526609006884, altitude: 5 },
    { lng: -123.14617193284676, lat: 49.27526811551033, altitude: 5 },
    { lng: -123.14621850002477, lat: 49.274014351439035, altitude: 5 },
    { lng: -123.14435270842225, lat: 49.274087269123925, altitude: 5 },
  ];
  overlay.outerCoordinates = overlayCoords;
}
Adding polylines to Photorealistic 3D Tiles
The final feature we’ll add to the Google Photorealistic 3D Tiles map is a polyline - a series of connected line segments commonly used to represent routes, paths, and borders. Just like in 2D maps, adding a polyline to a 3D Google Map is simple and straightforward.
Suppose we have a route polyline returned by the Routes API and GMPRO and its saved to a variable:
const routePath = "wkwkHfteBK}@EfAF`AP`A~B`GVvADpAMrBBjAJp@XfAhAr ...Mx@"How do we draw it using the Photorealistic 3D Tiles API? First, add a <gmp-polyline-3d/> component as a child component to <gmp-map-3d/>.
<gmp-map-3d mode="SATELLITE" heading="120" range="2000" tilt="35" center="49.2736533,-123.1395109, 50">
   <gmp-polyline-3d altitude-mode="relative-to-mesh" stroke-color="rgba(251, 188, 5, 0.7)"  stroke-width="20"></gmp-polyline-3d>
</gmp-map-3d>
<gmp-polyline-3d/> comes with the following properties:
altitude-mode: Specifies at the height that the polyline will be drawn. Use "relative-to-mesh" to ensure that the polyline follows the terrain over bridges, under tunnels and along hills and valleys.
stroke-color is the color of the polyline.
stroke-width is the color of the polyline
Next, at the beginning of your Javascript code, import the Geometry library from the Google Maps Javascript API and use object destructuring to extract the encoding object.
const {encoding} = await google.maps.importLibrary("geometry");The encoding object contains useful methods such as:
encodePath(): which converts aLatLngpath to an encoded polyline string.decodePath(): which converts an encoded polyline string back to aLatLngarray.
To draw the route polyline, we simply need to decode the polyline (convert it back to an array of latitude and longitude coordinates) and assign it to the polyline object retrieved from the <gmp-polyline-3d/> component.
async function drawRoutePolyline(path) {
  const polyline = document.querySelector("gmp-polyline-3d");
  const routeCoordinates = encoding.decodePath(path);
  polyline.coordinates = routeCoordinates;
}
And that's a wrap! You should now be an expert at adding markers, overlays and polylines to Photorealistic 3D Tiles! Full source code for the examples above can be found in the google_maps_3d_marker_polyline_overlays.html file below.
In the next tutorial, I'll show you how to add a 3D polygon to a Photorealistic 3D Map so that you can create 3D heatmaps, represent buildings, highlight objects or overlay building footprints and planned structures on the map.
👋 As always, if you have any questions or suggestions for me, please reach out or say hello on LinkedIn.
Next: Part 5: Add a 3D polygon to a Google Photorealistic 3D map