Google Places Insights API
Learn how the Google Places Insights API can help you find the number of places (restaurants, bars, and cafes etc) in a given area.

Have you ever walked through a neighborhood filled with restaurants or cafes and wondered how many there actually are? The Google Places Insights API (new name: Places Aggregate API) can give you the exact answer. In this tutorial, I'll demonstrate how to use the Google Places Insights API to identify underserved areas and determine the best location for a new store. We'll wrap up by building an interactive heat map of various places (e.g. restaurants, bars and cafes) across Vancouver, Canada. (demo / source code).
What is the Google Places Insights API?
The Google Places Insights API is a new API from Google Maps that provides location based analytics to help businesses and developers understand the density, distribution, and availability of places within a specified area. It's a part of the Google Places API, but instead of providing details about a single place, it returns aggregated data on all places within a specified area that match the search criteria. Calling the Places Insights API is simple and only requires two key pieces of information.
- Insight type: The kind of data you want returned. This could either be "INSIGHT_COUNT", which returns the number of places matching filter criteria, or "INSIGHT_PLACES", which returns the place IDs matching the filter criteria.
- Filters: The criteria for filtering places. At a minimum, you must specify both the
LocationFilterandTypeFilter.
Google Places Insights API pricing
Since the Places Insights API is in the pre-GA Preview stage, there is no charge for API usage during Preview (source). API calls will appear on the Billing page in the Cloud Console, but charges will be $0. Once the API goes to GA, it will cost $10.00 CPM (cost per thousand API calls), or $0.01 per call. As always, you can access discounted pricing if you work with a Google Maps Partner.
Getting an API key
To start using the Google Places Insights API, you need to explicitly enable it in your Google Cloud Console. Places Insights is considered separate from the Google Places API, so you'll have to find it on the APIs & Services page (search for "Places Insights") and click [Enable].
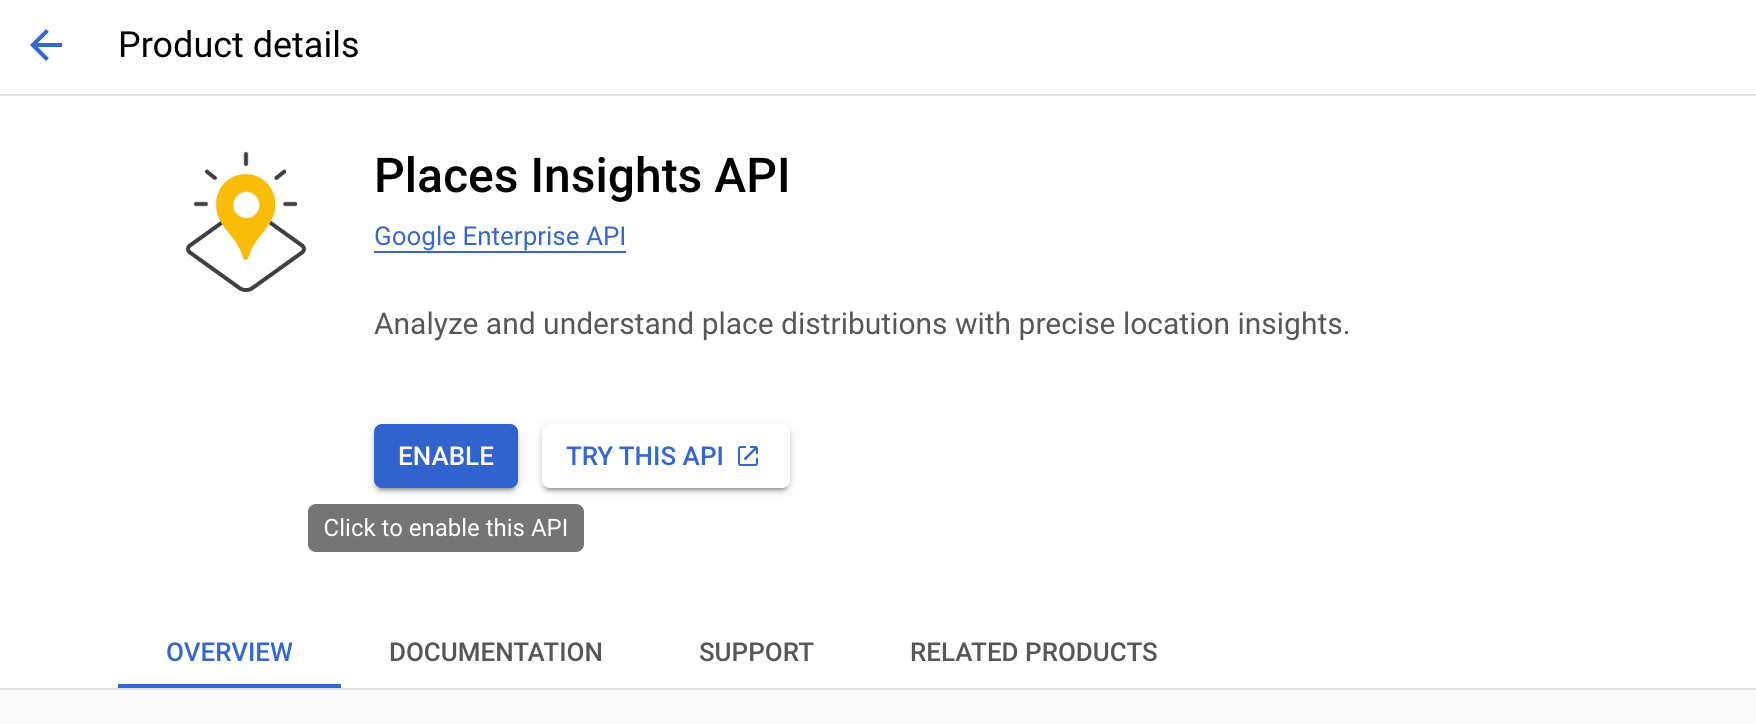
After enabling it, find your API key (or create a new one if you don’t have one) and make sure that the Google Places API is enabled for that key.
Google Places Insights API example
One of my favorite independent coffee chains is Blue Bottle, which started in San Francisco (edit: they were acquired by Nestle in 2017, urgh). Let's say you were the Vice President of International Expansion at Blue Bottle and wanted to analyze the feasibility of expanding to Vancouver, Canada. Vancouver is famous for its coffee culture and even has an unofficial coffee app, but there are plenty of cafes already. How many exactly? Let's ask the Google Places Insights API.
To find out how many coffee shops are in Vancouver, we first need its place ID (ChIJs0-pQ_FzhlQRi_OBm-qWkbs). You can obtain this by making a Text Search API or Geocoding API request using the query string "Vancouver, Canada." Next, call the Places Insights API by setting the insight type to "INSIGHT_COUNT", locationFilter to "places/ChIJs0-pQ_FzhlQRi_OBm-qWkbs" and typeFilter to "cafe".
Endpoint POST https://areainsights.googleapis.com/v1:computeInsights
Headers
Content-Type: application/json
X-Goog-Api-Key: YOUR_API_KEY
Request Body
{
   "insights":[
      "INSIGHT_COUNT"
   ],
   "filter":{
      "locationFilter":{
         "region":{
            "place":"places/ChIJs0-pQ_FzhlQRi_OBm-qWkbs"
         }
      },
      "typeFilter":{
         "includedTypes":[
            "cafe"
         ]
      }
   }
}
insights is an array that lets you specify what kind of data you'd like the API to return. It can be either "INSIGHT_COUNT" (returns the number of places returned that match the search criteria) or "INSIGHT_PLACES" (returns an array of matching Place IDs).
locationFilter is used to define a specific geographic area and is one of the following:
circle: Defines an area as a circle with a center and radius
{
    "locationFilter": {
        "circle": {
            "latLng": {
                "latitude": 49.2577062,
                "longitude": -123.2063039
            },
            "radius": 1000
        }
    }
}region: Uses a Place ID to define an area as a region.
{
    "locationFilter": {
        "region": {
            "place": "places/ChIJs0-pQ_FzhlQRi_OBm-qWkbs"
        }
    }
}customArea: Defines an area as a custom polygon.
{
    "locationFilter": {
        "customArea": {
            "polygon": {
                "coordinates": [
                    {
                        "latitude": 49.27468369696294,
                        "longitude": -123.13060312624661
                    },
                    {
                        "latitude": 49.27469841808173,
                        "longitude": -123.11685546054629
                    },
                    {
                        "latitude": 49.28369357865754,
                        "longitude": -123.1168767147865
                    },
                    {
                        "latitude": 49.2836788528944,
                        "longitude": -123.1306268809628
                    },
                    {
                        "latitude": 49.27468369696294,
                        "longitude": -123.13060312624661
                    }
                ]
            }
        }
    }
}
typeFilter narrows down your search by letting you choose which place types you want to include or exclude.
{
    "typeFilter": {
        "includedTypes": [
            "cafe"
        ]
    }
}
Response
{
    "count": "714"
}
The response is a string, count, that tells you how many places meet the search criteria e.g. there are 714 cafes within Vancouver.
Excluding place types
Now, our intrepid Blue Bottle VP is getting a little worried. 714 cafes is a lot of competition. But surely not all of these 714 are real cafes. A MacDonald's for example counts as a "cafe", but their coffee is for the unwashed masses. No discerning Blue Bottle customer would ever think of getting a latte there. To exclude restaurants that also serve coffee from the search results, he can add an excludedTypes parameter in typeFilter like so:
{
    "typeFilter": {
        "includedTypes": [
            "cafe"
        ],
        "excludedTypes": [
            "restaurant"
        ]
    }
}
The result count comes back - 460! Much better.
Filtering for rating
Blue Bottle is a premium coffee destination, so its really only in competition with highly rated coffee places. Our VP then reduces the number of competitors further by applying a ratingFilter to only return places with a 4.5 star rating and up.
{
    "ratingFilter": {
        "minRating": 4.5,
        "maxRating": 5
    }
}
Now the count is 184. So there are just 184 cafes in Vancouver that are not a restaurant and have a Google Maps star rating of 4.0 or higher.
Using a polygon to filter by custom area
So the VP excitedly brings his findings to the CEO of Blue Bottle Coffee. The CEO looks at the numbers and says, "All real estate is local. Our competition isn’t coffee shops across town—it’s the ones right next door. Tell me how many coffee shops are in each neighborhood". Dejected, the VP goes back to his laptop and reads the documentation.
"Aha! Looks like I can pass in a custom polygon and get the Places Insights API to count the number of coffee shops inside it".
Google Places Insights API custom polygon example
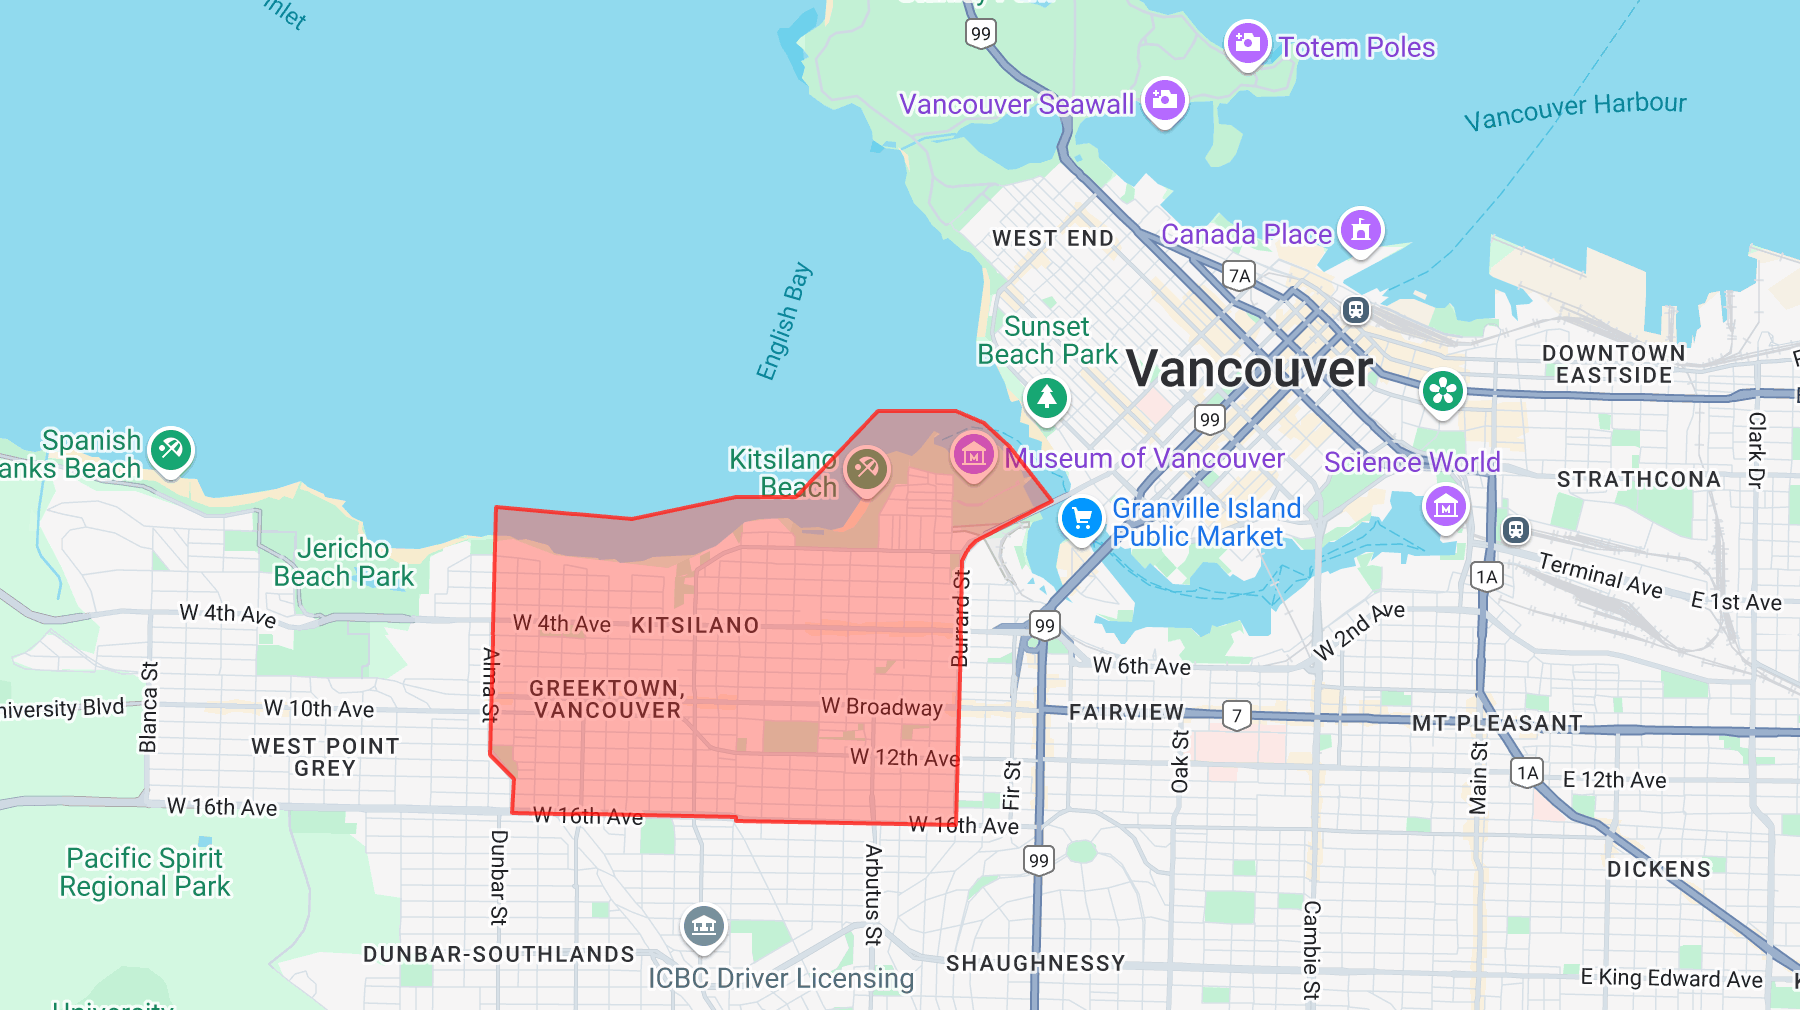
Our VP searches online and discovers a City of Vancouver dataset that outlines the 22 neighborhood boundaries within Metro Vancouver (link). He pulls out boundary data for Kitsilano (a trendy neighborhood known for being the birthplace of Lululemon, yoga pants and yoga on the beach) and adds it to the locationFilter.customArea.customerArea.coordinates field.
Endpoint POST https://areainsights.googleapis.com/v1:computeInsights
Headers
Content-Type: application/json
X-Goog-Api-Key: YOUR_API_KEY
Request Body
{
    "insights": [
        "INSIGHT_COUNT"
    ],
    "filter": {
        "locationFilter": {
            "customArea": {
                "polygon": {
                    "coordinates": [
                        {
                            "longitude": -123.13768005371092,
                            "latitude": 49.27531814481966
                        },
                        {
                            "longitude": -123.1412582397461,
                            "latitude": 49.27829360868688
                        },
                        {
                            "longitude": -123.14358520507812,
                            "latitude": 49.279666899702505
                        },
                        ...// 30 more entries
                    ]
                }
            }
        },
        "typeFilter": {
            "includedTypes": [
                "cafe"
            ],
            "excludedTypes": [
                "restaurant"
            ]
        },
        "ratingFilter": {
            "minRating": 4.5,
            "maxRating": 5
        }
    }
}
Response
{
    "count": "25"
}
So there are 25 cafe not restaurants in Kitsilano with a minimum rating of 4.5 stars. Not bad!
How to draw a neighborhood boundary in Google Maps
The main advantage of using a custom polygon instead of a Place ID to filter Places Insights search results is that it allows for easy visualization on a map. Here's how you'd draw a custom polygon on a Google Map using the Maps Javascript API.
- Import the Google Maps Javascript API
<script
  src="https://maps.googleapis.com/maps/api/js?key={GOOGLE_MAPS_API_KEY}&callback=initMap&v=weekly"
  defer
></script>;- Copy over the boundary GeoJSON object from your data source and set it to a variable.
const kitsilano = {
        type: "Feature",
        geometry: {
          type: "Polygon",
          coordinates: [
                    [
                        [
                            -123.13768005371092,
                            49.27531814481966
                        ],
                        [
                            -123.14374542236328,
                            49.27323150541536
                        ],
                        [
                            -123.14389801025389,
                            49.273178099653656
                        ],
                        ...// 30 more entries
                    ]
                ],
        },
        properties: {
          name: "Kitsilano",
        },
}- Convert the GeoJSON coordinates to an array of
LatLngcoordinate pairs.
function geoJSONtoCoords(polygon) {
        const coords = polygon.geometry.coordinates[0];
        const res = [];

        coords.forEach((coordinate, index) => {
          res.push({
            lat: coordinate[1],
            lng: coordinate[0]
          });
        });

        return res;
}- Create a new polygon object using the Google Maps Javascript API. The code below creates a red polygon with a partially transparent fill and a solid outline.
const kitsilanoBoundary = new google.maps.Polygon({
          paths: kitsilanoCoords,
          strokeColor: "#FF0000",
          strokeOpacity: 0.8,
          strokeWeight: 2,
          fillColor: "#FF0000",
          fillOpacity: 0.35,
});- Instantiate a Google Map object and add your polygon to the map.
function initMap() {
        const map = new google.maps.Map(document.getElementById("map"), {
          zoom: 13,
          center: { lat: 49.2772413, lng: -123.1399321 }
        });
kitsilanoBoundary.setMap(map);- Make sure to include a
<div/>element with an id of "map" in your HTML file.
<script
  src="https://maps.googleapis.com/maps/api/js?key={GOOGLE_MAPS_API_KEY}&callback=initMap&v=weekly"
  defer
></script>;
Here is the source code for the example above. To run the app, open the file in your favorite text editor and replace {YOUR_API_KEY} with a valid Google Maps API key. Open google_maps_kitsilano_boundary.html in your browser and the app should work out of the box.
Google Places Insights API retrieve place details example
If you want to know which cafes are included in the 25, you need to make a fresh call to the Google Places Insights API but this time set insights to "INSIGHT_PLACES".
Endpoint POST https://areainsights.googleapis.com/v1:computeInsights
Headers
Content-Type: application/json
X-Goog-Api-Key: YOUR_API_KEY
Request Body
{
    "insights": [
        "INSIGHT_PLACES"
    ],
    "filter": {
        "locationFilter": {
            "customArea": {
                "polygon": {
                    "coordinates": [
                        {
                            "longitude": -123.13768005371092,
                            "latitude": 49.27531814481966
                        },
                        {
                            "longitude": -123.1412582397461,
                            "latitude": 49.27829360868688
                        },
                        {
                            "longitude": -123.14358520507812,
                            "latitude": 49.279666899702505
                        },
                        ...// 30 more entries
                    ]
                }
            }
        },
        "typeFilter": {
            "includedTypes": [
                "cafe"
            ],
            "excludedTypes": [
                "restaurant"
            ]
        },
        "ratingFilter": {
            "minRating": 4.5,
            "maxRating": 5
        }
    }
}
Response
{
"placeInsights": [
{
"place": "places/ChIJ4RrlKMdzhlQRpQJadaP_ekg"
},
{
"place": "places/ChIJBXb2cWZzhlQRCJmYZAfBK8A"
},
{
"place": "places/ChIJCZXvUlVyhlQRUx3Vd_8SP28"
},
...// 22 more places
]
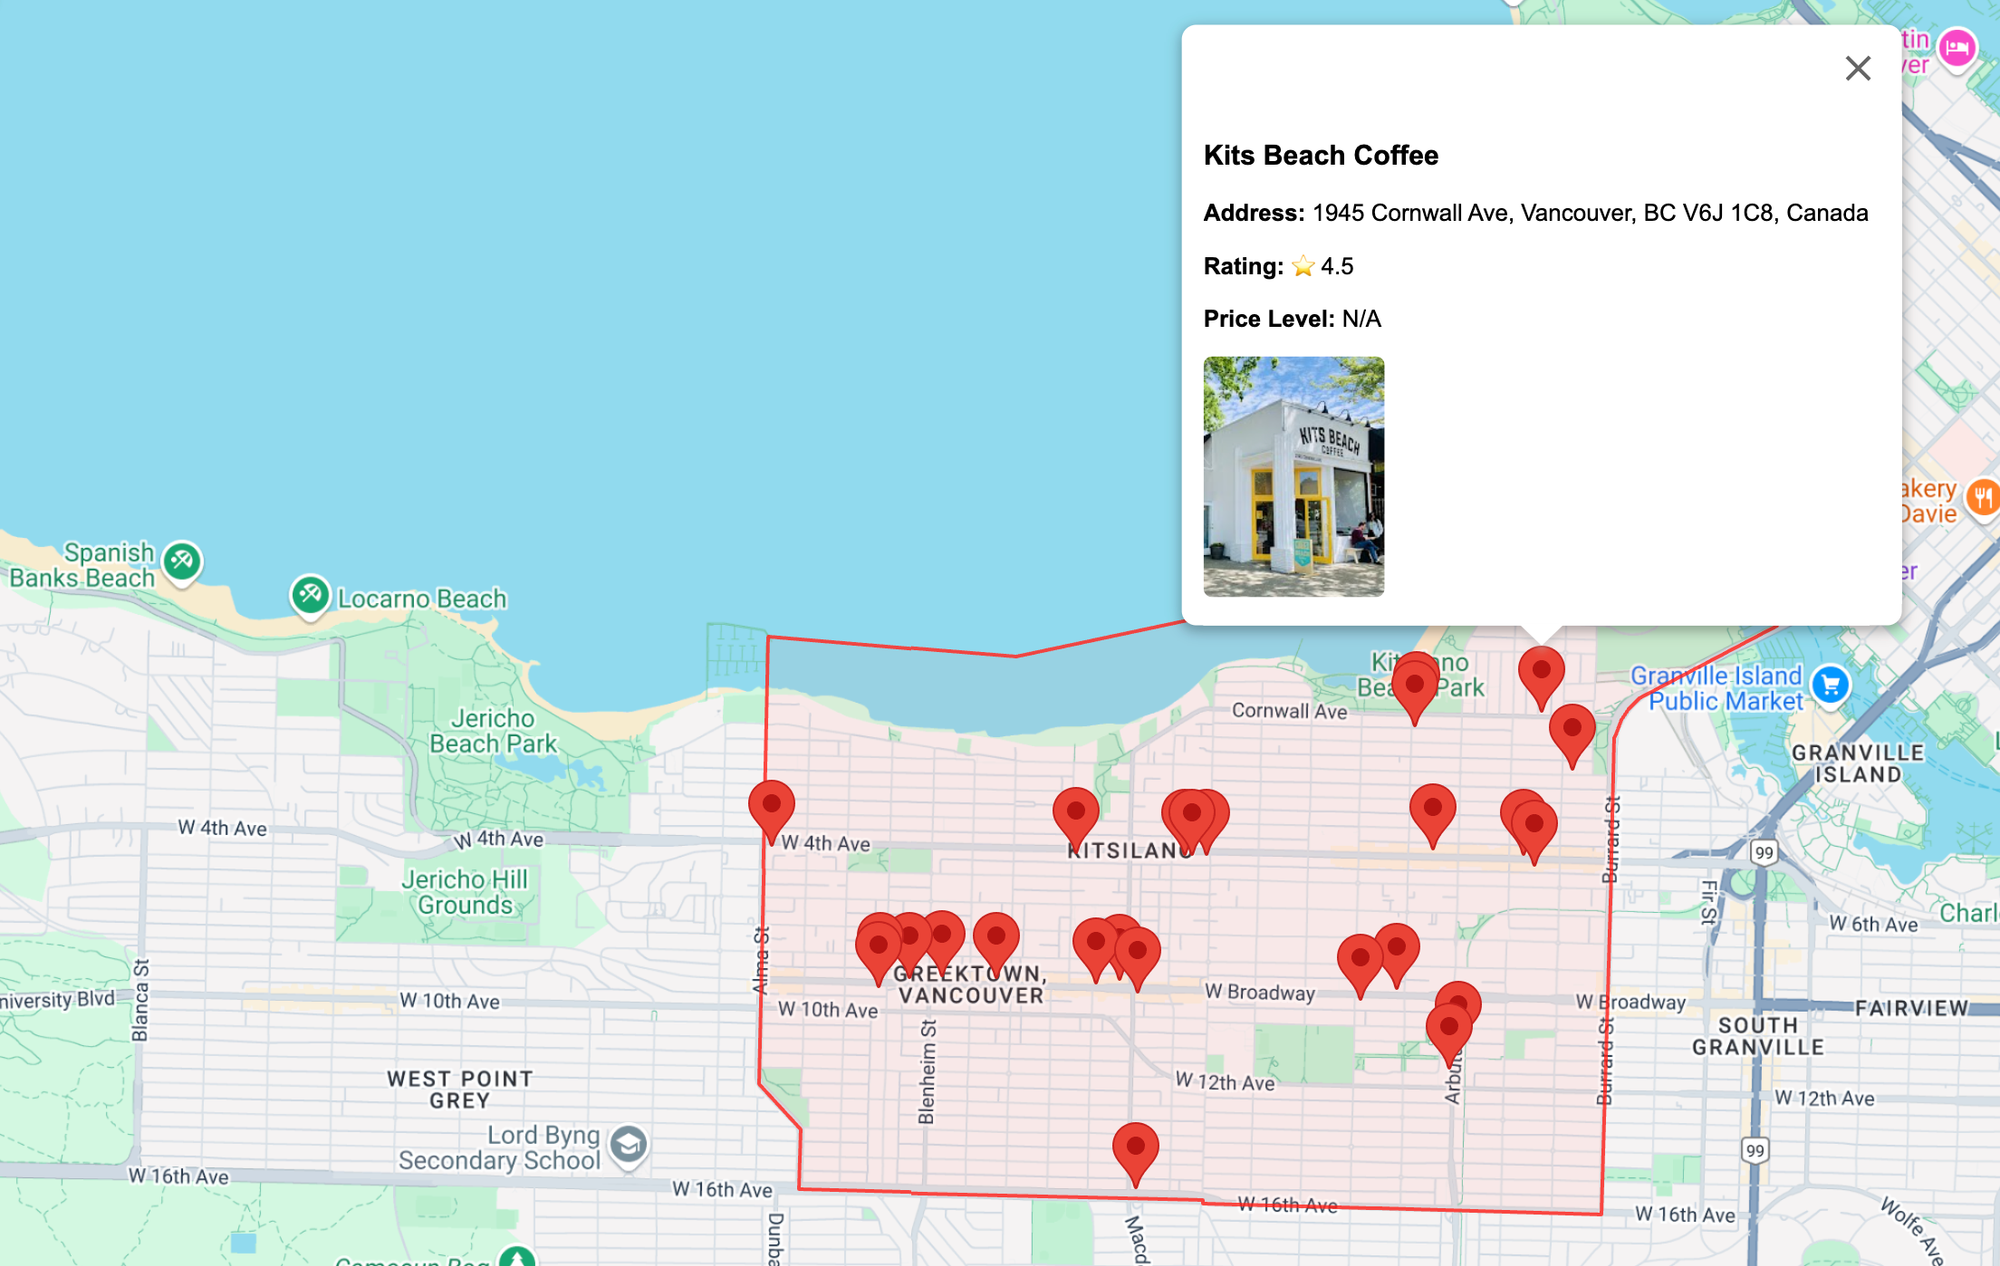
}Data for each place including photos, reviews and price levels can be retrieved using the Place Details and Place Photos APIs.
How to add place markers to Google Maps
After retrieving Google Place IDs from the Places Insights API, the natural thing to do is to plot them on a map. Here’s how to do it using plain JavaScript.
- Import the Google Maps Javascript API together with the Places library.
<script src="https://maps.googleapis.com/maps/api/js?key={GOOGLE_MAPS_API_KEY}&libraries=places"></script>- Convert the
placeresults from the Places Insights API into an array and save it to a variable.
const placeIds = [
            "ChIJ4RrlKMdzhlQRpQJadaP_ekg",
            "ChIJBXb2cWZzhlQRCJmYZAfBK8A",
            "ChIJCZXvUlVyhlQRUx3Vd_8SP28",
            ...// 22 more places
];- Instantiate a Google Maps object and create a new instance of the Google Places Service. This will allow us to call the Google Places API without having to write our own HTTP request code.
map = new google.maps.Map(document.getElementById("map"), {
  center: { lat: 49.2827, lng: -123.1207 },
  zoom: 12,
});

const service = new google.maps.places.PlacesService(map);- Iterate over the
placeIdarray, retrieveplacedata for each entry, and add a marker to the map at theplacelocation.
placeIds.forEach((placeId) => {
  service.getDetails({ placeId: placeId }, (place, status) => {
    if (status === google.maps.places.PlacesServiceStatus.OK) {
      const marker = new google.maps.Marker({
        map,
        position: place.geometry.location,
        title: place.name,
      });
    } else {
      console.error(`Error fetching details for Place ID: ${placeId}`);
    }
  });
});
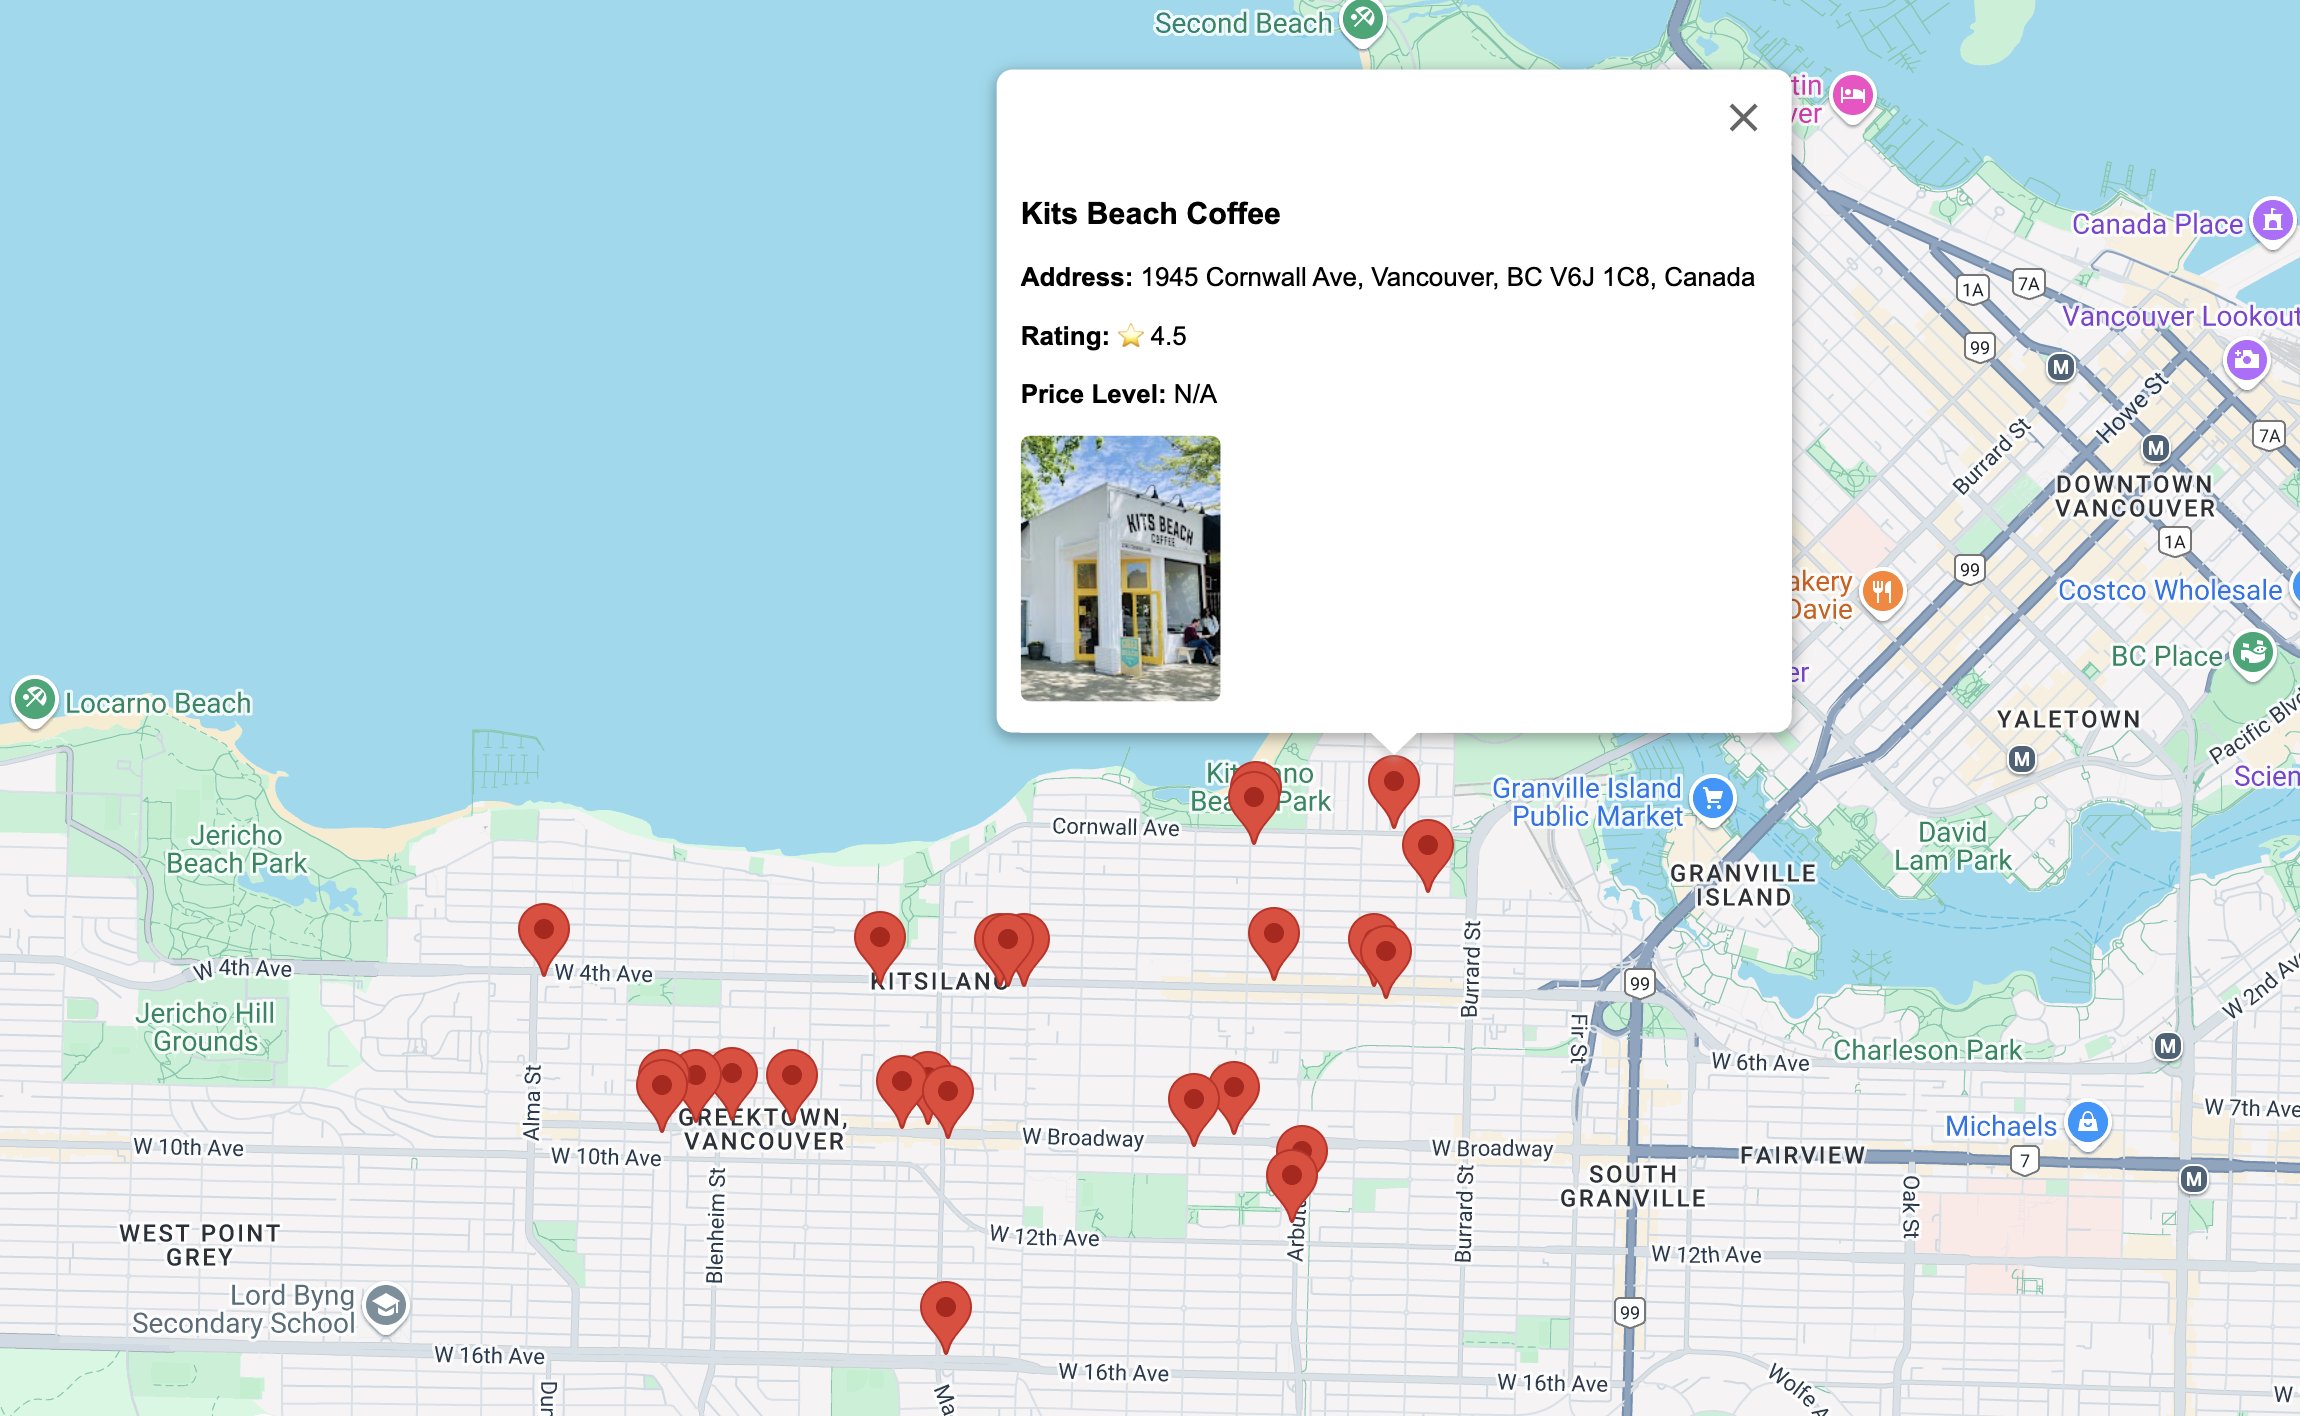
- Retrieve
price,ratingandphotosfor each place and add this information to anInfoWindowcomponent. Bind theInfoWindowto its corresponding map marker and add a listener so that it opens when the marker is clicked. Any existing windows already opened will be closed.
const priceLevels = ["Free", "$", "$$", "$$$", "$$$$"];
                        const price = place.price_level !== undefined ? priceLevels[place.price_level] : "N/A";
                        const rating = place.rating !== undefined ? place.rating : "No rating available";
                        const photo = place.photos ? place.photos[0].getUrl({ maxWidth: 300, maxHeight: 200 }) : null;

                        let infoWindowContent = `
                            <div style="font-family: Arial, sans-serif;">
                                <h3>${place.name}</h3>
                                <p><strong>Address:</strong> ${place.formatted_address}</p>
                                <p><strong>Rating:</strong> ⭐ ${rating}</p>
                                <p><strong>Price Level:</strong> ${price}</p>
                                ${photo ? `<img src="${photo}" alt="Place Image" style="width:100%; max-width:100px; border-radius:5px;">` : ""}
                            </div>
                        `;

                        const infoWindow = new google.maps.InfoWindow({
                            content: infoWindowContent
                        });

                        marker.addListener("click", () => {
                            if (currentInfoWindow) {
                                currentInfoWindow.close();
                            }
                            infoWindow.open(map, marker);
                            currentInfoWindow = infoWindow;
                        });
The source code is included below. Writing code like this in vanilla Javascript works for one off projects, but for production applications, it's best to use a well established framework like React. At the end of this post, we'll use React to build an interactive heatmap that visualizes the density and distribution of various place types in Vancouver.
Epilogue
Happy with his progress so far, the VP combines the INSIGHT_COUNT and INSIGHT_PLACES visualizations together to show the distribution of highly rated coffee places in Kitsilano and shows it to his CEO.
"Ah!" says the CEO. "You see that line of coffee places there in Greektown, Vancouver? We should place our Blue Bottle store right in the middle. I learned in school that competing businesses often tend to cluster together because this allows them to capture a larger share of the competitor's customers (see Hoteling's Law). This represents a Nash equilibrium because once firms are located at the midpoint, neither firm benefits from moving away because they will lose market share."
"Oh, where did you go to school?" asks the VP.
"I went to school in Boston," comes the reply.
"Boston University?"
"No."
"Boston College?"
"No."
"Northeastern, then?"
"No."
"Tufts?"
"No."
"You went to Wellesley??"
"Do I look like a woman to you?"
"Sir, I don't judge."
"Well, maybe we can do a bit more research and create a custom score to quantify the attractiveness of a neighborhood for a new Blue Bottle store. We could come up with a custom metric that combines walkability, foot traffic, the number of "tourist_attraction" places nearby with income levels," says the VP. "Nah, just build the new store wherever we can afford it."
And that folks, is the reality of site selection analysis for new store placement. At the end of the day, you're going to do whatever the economics of the real estate market allows you to. So might as well have some fun doing it.
Building an interactive heat map with the Google Places Insights API
My story about Blue Bottle was completely made up, but the underlying premise is very real. Choosing where to set up a new store (especially in a new country) is not easy, and big brands such as Costco, Target and Starbucks routinely spend millions of dollars a year on external consultants to advise them. In this last section, we are going to use the Places Insights API to build an interactive heat map that shows the density and distribution of various places (e.g. restaurants, bars and cafes) across Vancouver, Canada. You can think of it as the starting point for an internal tool that a geospatial consulting company would use to advise their clients on where to locate their next store.
As always, the best way to follow this tutorial is by pulling the code from GitHub and trying to run it locally. Otherwise, feel free to play around with the online demo at https://places-insights-demo.afi.dev/.
How it works
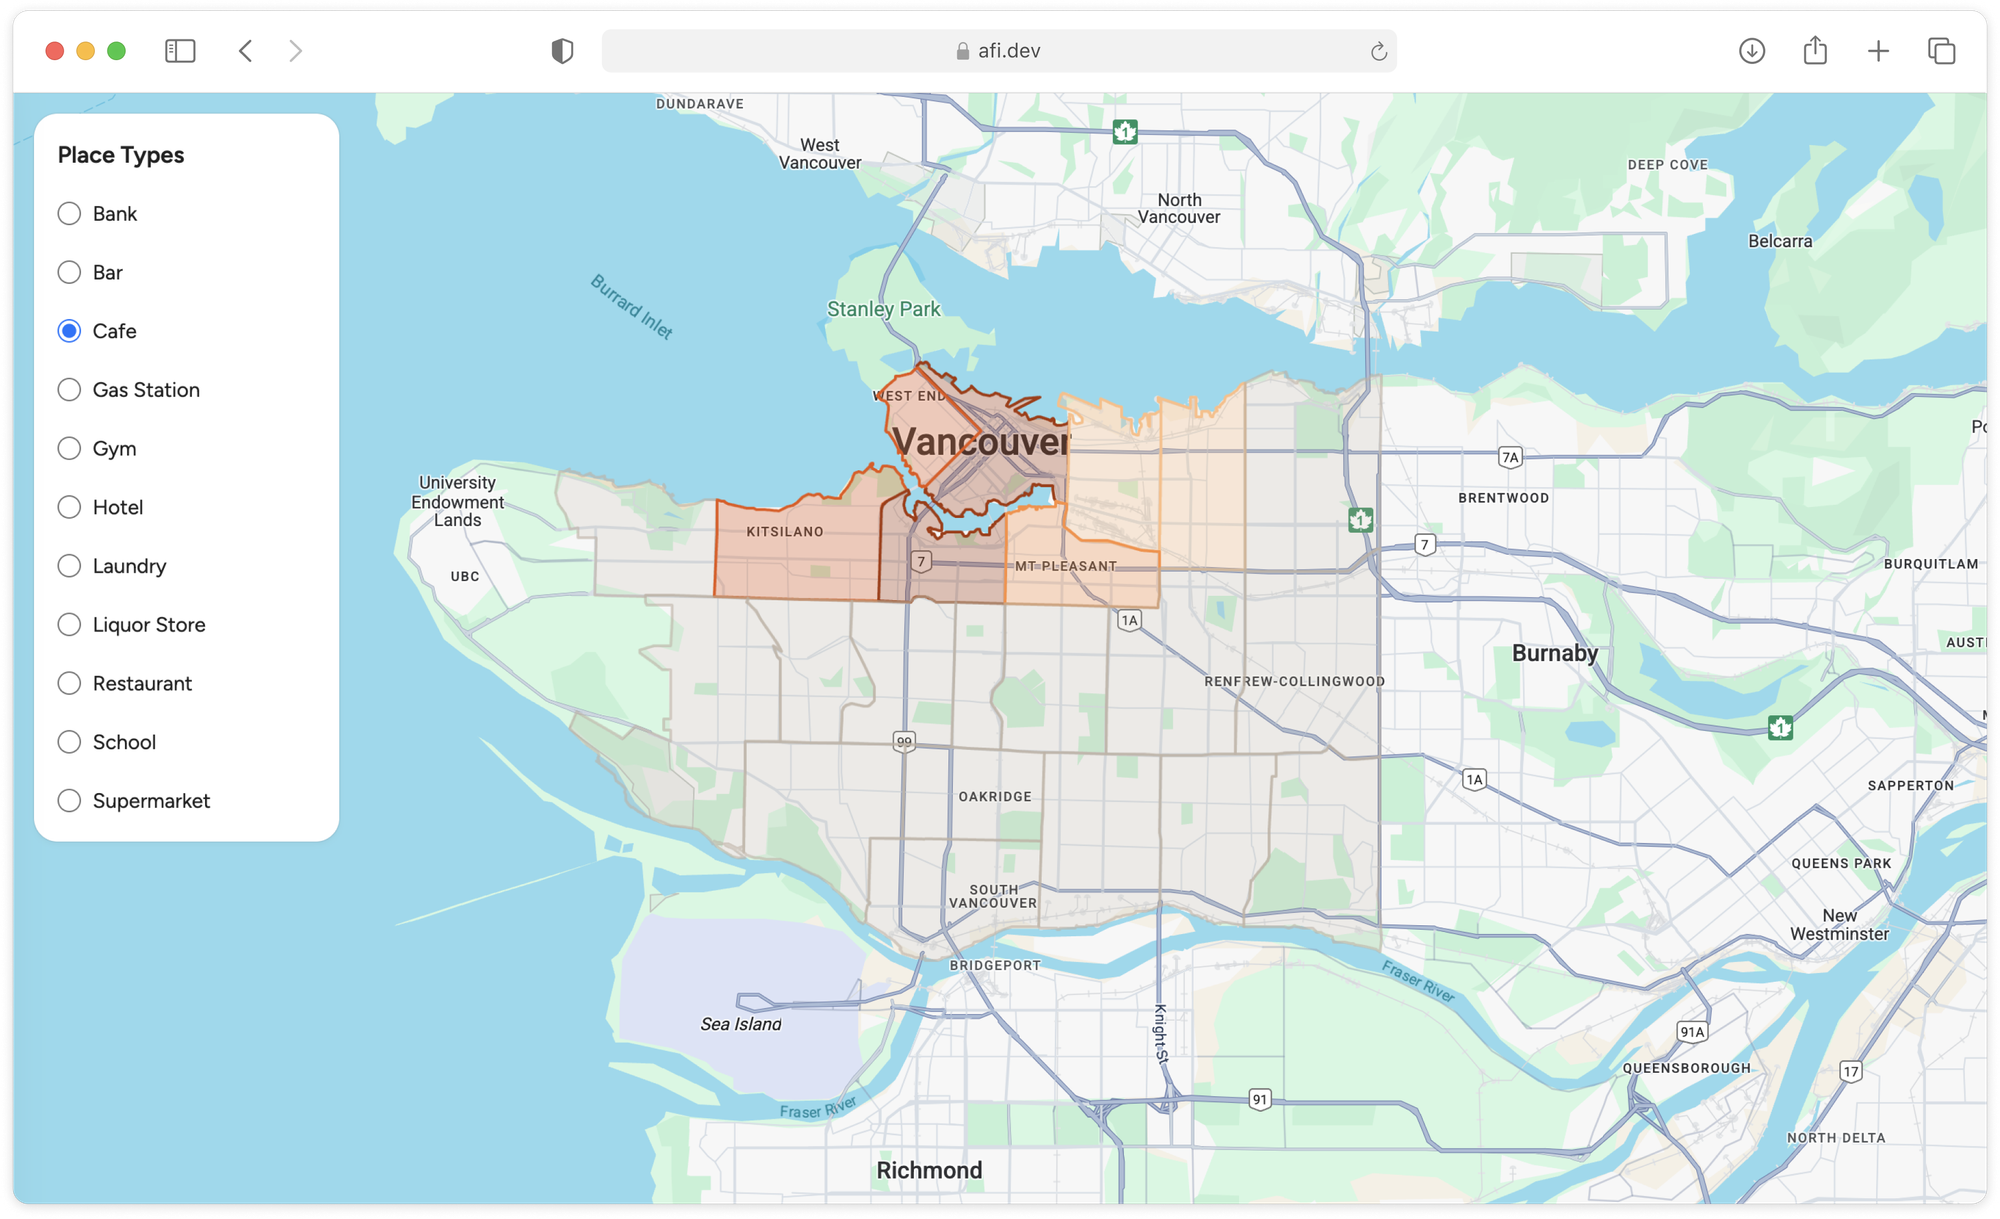
places_insights_demo shows you how many places of a specific type, like cafes or restaurants, are located in each neighborhood of Vancouver, Canada. Users can search or navigate to anywhere in Vancouver, choose a category of business, and instantly see how densely that type is represented across the map.
Areas with more matching places are shown in deep red or orange, while areas with fewer are colored light beige. This makes it easy to spot high traffic zones, underrepresented regions, or potential hotspots for opening new businesses.
Like most of our tutorials, places_insights_demo is written in React and relies on the @vis.gl/react-google-maps library to handle map interactions and UI in a React friendly way
App.jsx
App.jsx is the main entry point to our app. It handles global layout and passes props and data between child components. It's also responsible for making calls to the Places Insights API and passing the matching place count for each neighborhood to the corresponding <Polygon/>.
/*** App.jsx ***/
import request from "~/utils/axios";
import { POLYGONS } from "~/constants";

const [totalPlaceCount, setTotalPlaceCount] = useState(0);
const [placeCountsPerPolygon, setPlaceCountsPerPolygon] = useState({});

const handlePlaceTypeChange = useCallback(
  async (place) => {
    if (isFetching) return;
    setIsFetching(true);

    let totalCount = 0;
    const promises = POLYGONS.map(async ({ coordinates, id }) => {
      try {
        const response = await request(AREA_INSIGHTS_URL, {
          method: "POST",
          data: {
            insights: ["INSIGHT_COUNT"],
            filter: {
              locationFilter: {
                customArea: { polygon: { coordinates } },
              },
              typeFilter: { includedPrimaryTypes: place.placeType },
            },
          },
        });

        totalCount += Number(response.count);
        return [id, response.count]; // [123, "50"]
      } catch (error) {
        console.error(`Error fetching data for id ${id}:`, error);
        return [id, 0];
      }
    }); // [ [123, "50"], [456, "70"]]

    const placeCountsPerPolygon = Object.fromEntries(
      await Promise.all(promises),
    ); // {"123": 50, "456",}

    setCurrentPlaceType(place.name);
    setTotalPlaceCount(totalCount);
    setPlaceCountsPerPolygon(placeCountsPerPolygon);
    setIsFetching(false);
  },
  [isFetching],
);
It's worth understanding just how App.jsx calls the Places Insights API for two reasons. First, it is very cleverly done. Second, ChatGPT wrote this code for me and I had no idea how or why it worked until looked at it a few times.
POLYGONS is an an array of polygon objects taken from the City of Vancouver's official local area boundary dataset and hardcoded into constants/index.js. Each polygon has a placeName, an id and an array of coordinates representing consecutive points on the neighborhood boundary. Any polygon, even convex ones are fine, so long as the points are listed in counterclockwise order, and the first and last coordinates are the same to close the shape.
/*** constants/index.js ***/
export const POLYGONS = [
  {
    placeName: "West Point Grey",
    id: 11670531,
    coordinates: [
      { latitude: 49.2746236, longitude: -123.2249611 },
      { latitude: 49.2733055, longitude: -123.2247502 },
      { latitude: 49.2726321, longitude: -123.2245281 },
      ...// many more
    ],
  },
];
When the handlePlaceTypeChange() method is called (this callback runs each time the user chooses a place type from the list in <PlaceTypeSelector/>), we initiate totalCount to keep track of how many matching places there are in total and call POLYGONS.map() to create a new array. This map() call is made asynchronously (note the async keyword in the constructor, so we don't know exactly when each element in the new array will be created), and assigned to promises.
/*** handlePlaceTypeChange() method of App.jsx ***/
let totalCount = 0;
const promises = POLYGONS.map(async ({ coordinates, id }) => {
  // Places Insights API call goes here
});
Then, await Promise.all(promises) is used to run multiple async calls to the Places Insights API in parallel and wait for all of them to finish before continuing.
The call to the Places Insights API is made using the Axios HTTP library. The two pieces of information needed to find the number of places in each polygon are coordinates, the coordinates that make up the shape of the boundary polygon and placeType, the type of place we are trying to count. Both are easy to get.
The coordinates of each polygon are accessed through object destructuring in the map() function’s constructor and passed into the locationFilter. The place object is passed as a parameter to the handlePlaceTypeChange() function, allowing place.placeType to be extracted and used in the typeFilter.
/*** handlePlaceTypeChange() method of App.jsx ***/
try {
  const response = await request(AREA_INSIGHTS_URL, {
    method: "POST",
    data: {
      insights: ["INSIGHT_COUNT"],
      filter: {
        locationFilter: {
          customArea: { polygon: { coordinates } },
        },
        typeFilter: { includedPrimaryTypes: place.placeItem },
      },
    },
  });

  totalCount += Number(response.count);
  return [id, response.count]; // [123, "50"]
} catch (error) {
  console.error(`Error fetching data for id ${id}:`, error);
  return [id, 0];
}
Once we get back a response, we increment totalCount by response.count (remembering to convert it from a string to a number) and return the mapped element as a [id, count] tuple. If the count for polygon (neighborhood) 123 is "50", then we would return [123, "50"].
The promises array gets populated asynchronously until each entry is filled. The final result is an array of tuples, that looks like this: [[123, "50"], [456, "60"]].
Finally, we use the built in Javascript method Object.fromEntries() to convert the array of tuples into placeCountsPerPolygon, a Javascript object that looks like this:
const placeCountsPerPolygon = {
  123: "50",
  456: "60",
};
PlaceTypeSelector.jsx
The <PlaceTypeSelector/> component displays a list of radio buttons that allow the user to select the type of place that he is interested in. Choosing a new place type triggers an onChange event, which calls the handlePlaceTypeChange() function.
/*** components/PlaceTypeSelector.jsx ***/
import { memo } from "react";
import "./PlaceTypeSelector.scss";
import { PLACE_LIST } from "~/constants";

const PlaceTypeSelector = ({ handlePlaceTypeChange }) => {
   return (
      <div className="PlaceTypeSelector">
         <h2 className="place-title">Place Types</h2>

         <ul className="place-menu">
            {PLACE_LIST.map((place, index) => {
               return (
                  <li key={place.placeType + index} className="place-item">
                     <input
                        type="radio"
                        id={place.placeType}
                        className="place-radio"
                        name="item"
                        onChange={() => handlePlaceTypeChange(place)}
                     />
                     <label className="place-text" htmlFor={place.placeType}>
                        {place.name}
                     </label>
                  </li>
               );
            })}
         </ul>
      </div>
   );
};

export default memo(PlaceTypeSelector);
As mentioned earlier in the section on App.jsx, handlePlaceTypeChange is a callback function that was passed as a prop from App.jsx to <PlaceTypeSelector/>. When invoked by onChange, it allows the parent App.jsx to receive the new place object and call the Places Insights API with the correct placeType.
GoogleMap.jsx
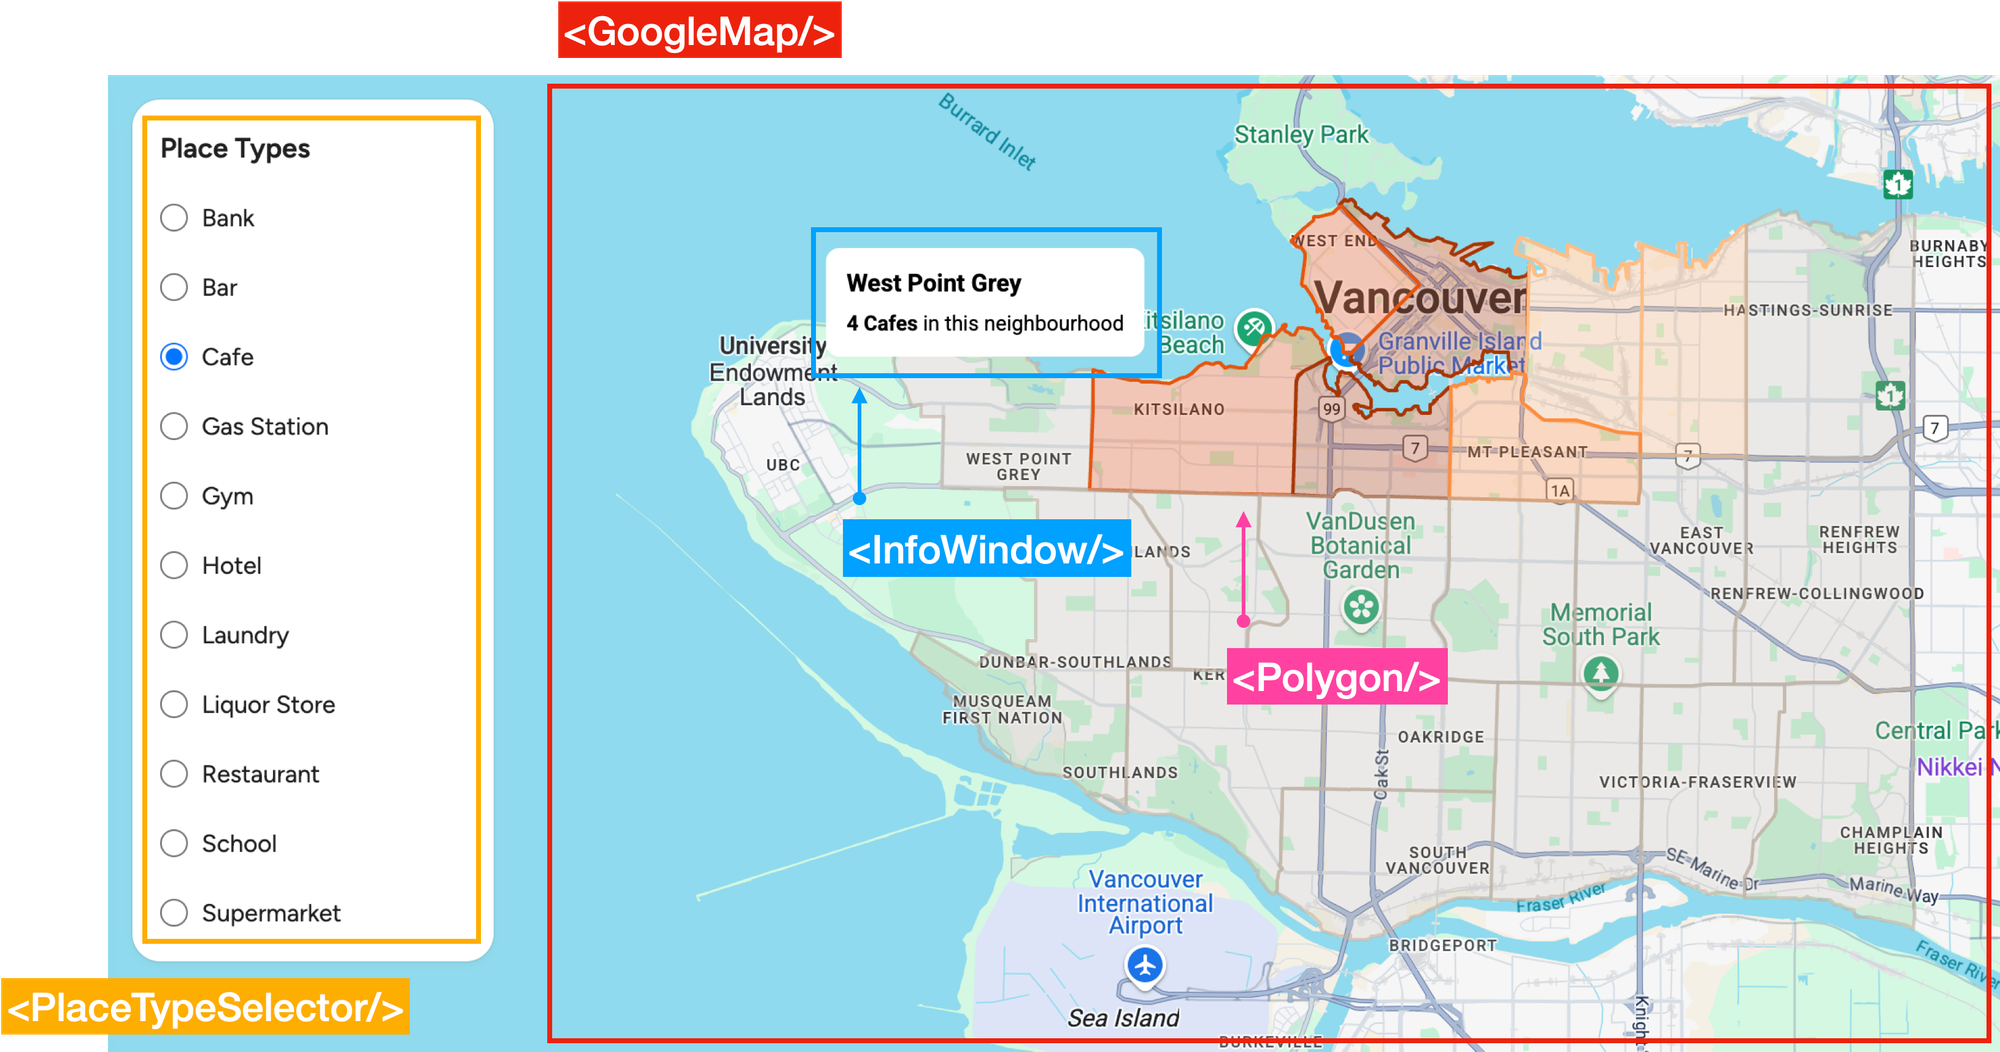
GoogleMap.jsx initializes a <Map/> component centered on Vancouver, Canada and is responsible for rendering and managing a Google Map instance within our React application. It accepts the following as props:
polygons: The array of polygons used to display neighborhood boundaries.
totalPlaceCount: The total number of places across all polygons that match the place type selected.
placeCountsPerPolygon: A map that the stores the number of matching places contained in each polygon.
activePlaceId: The ID of the selected (clicked on) polygon. Used to show a small info window popup with the neighborhood name and place count.
position: The weighted center of the polygon which is used to anchor the info window popup.
In the <Map /> component’s return statement, we display neighborhood boundaries by iterating over the polygons and rendering a <Polygon/> for each one. Each polygon receives as props the number of places it contains (count), the total number of places across Vancouver (totalCount), and a list of coordinates (paths) used to draw its shape.
/*** return() method of components/GoogleMap/index.js ***/
{
  polygons.map(({ coordinates, id }) => {
    const paths = coordinates.map(({ latitude, longitude }) => ({
      lat: latitude,
      lng: longitude,
    }));
    return (
      <Polygon
        key={id}
        id={id}
        onToggle={onPlaceClick}
        totalCount={totalPlaceCount}
        count={placeCountsPerPolygon[id]}
        paths={paths}
      />
    );
  });
}
Similarly, we iterate over polygons one more time to display a list of <Marker/> components which are used to activate the info window popup when a polygon is clicked on.
{
  polygons.map(({ coordinates, id, placeName }) => {
    return (
      <Marker
        key={id}
        count={placeCountsPerPolygon[id]}
        placeName={placeName}
        currentPlaceType={currentPlaceType}
        active={activePlaceId === id}
        position={getCenter(coordinates)}
      />
    );
  });
}
Polygon.jsx
<Polygon/> is a wrapper for the @vis.gl/react-google-maps component of the same name. To determine what percentage of matching places are within the neighborhood, it divides the number of places inside the polygon (count) by the total number across Vancouver (totalCount). This percentage is then mapped to a color (dark red is highest, light beige is the lowest) and used as the fillColor for the <Polygon/>.
/*** components/GoogleMap/Polygon.jsx ***/
import { memo } from "react";
import { Polygon as GPolygon } from "~/components/External/Polygon";

const Polygon = ({ id, paths, totalCount, count, onToggle }) => {
   const percent =
      totalCount > 0 ? (Number(count) / Number(totalCount)) * 100 : 0;
   let color = "rgba(190, 176, 162, 0.6)";

   if (percent > 10) {
      color = "rgba(166, 54, 3, 1)";
   } else if (percent > 8) {
      color = "rgba(230, 85, 13, 1)";
   } else if (percent > 6) {
      color = "rgba(253, 141, 60, 1)";
   } else if (percent > 4) {
      color = "rgba(253, 190, 133, 1)";
   }

   return (
      <GPolygon
         onClick={() => onToggle(id)}
         paths={[paths]}
         fillColor={color}
         strokeWeight={2}
         strokeColor={color}
      />
   );
};

export default memo(Polygon);
Clicking the polygon triggers the onClick event which sends the polygon's id to App.jsx where it will be set as the activePlaceId.
Marker.jsx
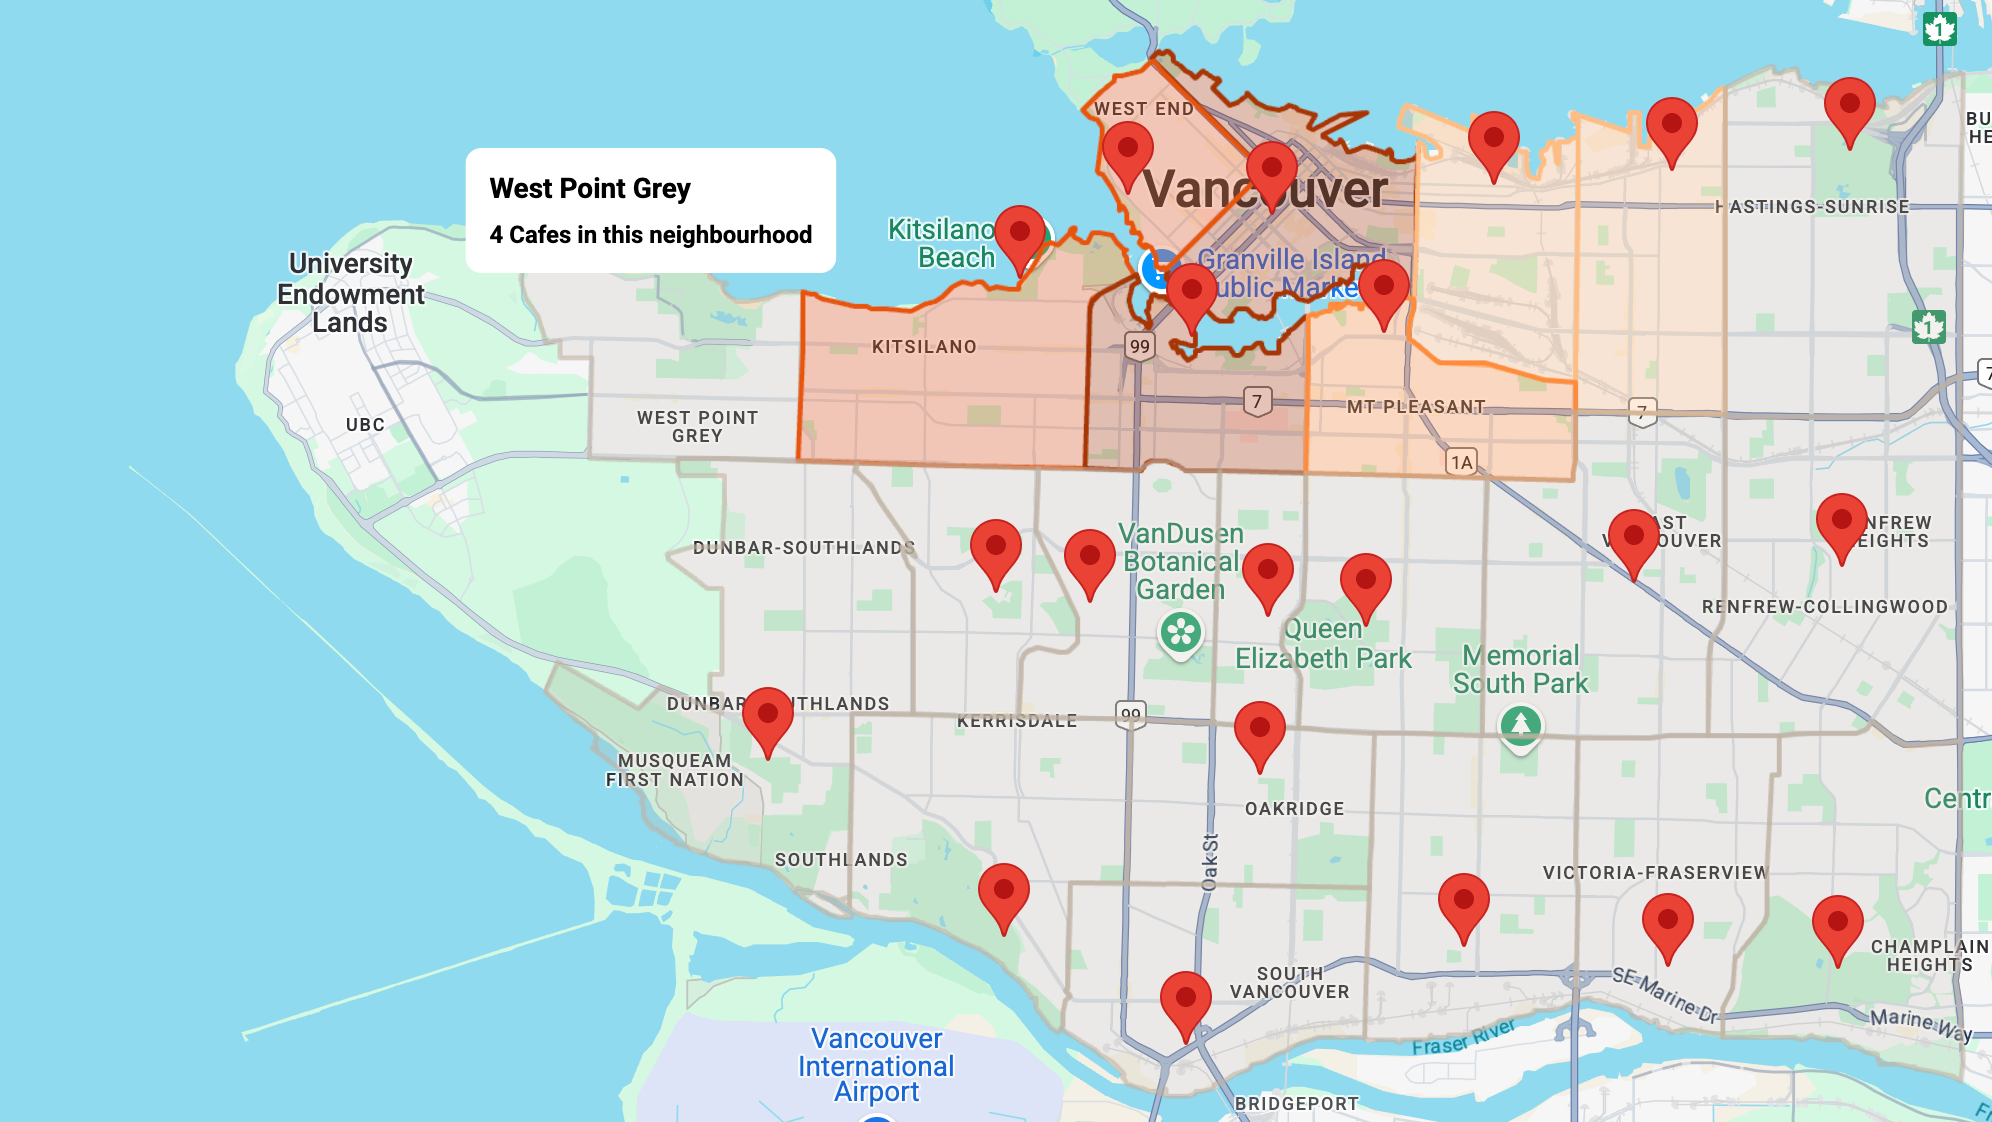
To support the <InfoWindow/> component that pops up with the neighborhood name and place count when you click a <Polygon/>, we place invisible <Marker/> components at the weighted center of each polygon.
This "weighted center" isn't the geometric center—it's the average of all the latitude and longitude points in the polygon’s coordinates array. Since areas with more detailed edges (like coastlines or rivers) have more points, the marker's position tends to shift toward those sides.
If the polygon's id is equal to the activePlaceId, the <InfoWindow/> component is shown.
/*** components/GoogleMap/Marker.jsx ***/
const [showInfoWindow, setShowInfoWindow] = useState(active);

useEffect(() => {
  setShowInfoWindow(active);
}, [active]);

return (
  <AdvancedMarker
    className="Marker"
    position={{ lat: latitude, lng: longitude }}
  >
    {showInfoWindow && (
      <InfoWindow
        placeName={placeName}
        count={count}
        currentPlaceType={currentPlaceType}
      />
    )}
  </AdvancedMarker>
);
This is because in the props for <Marker/>, we used active={activePlaceId === id} to set the value for active. If the polygon's id matched activePlaceId, active would resolve to true, and showInfoWindow would be true as well, thereby rendering the <InfoWindow/> for that polygon.
Marker.InfoWindow
<InfoWindow/> is a nested component in Marker.jsx which displays a small, temporary overlay showing the name of the neighborhood and the number of matching places in it. Since it is tightly coupled to <Marker/> and not reused elsewhere, it makes sense to keep it within Marker.jsx.
/*** components/GoogleMap/Marker.jsx ***/
const InfoWindow = ({ placeName, count, currentPlaceType }) => {
  const description = `${count} ${pluralize(currentPlaceType, count)} in this neighbourhood`;

  return (
    <div className="info-window">
      <div className="title">{placeName}</div>
      <span className="description">
        <b>{description}</b>
      </span>
    </div>
  );
};
Running the Places Insights Demo App
To run places_insights_demo, pull the code from GitHub, update the .env file with your Google Maps API key and run npm install followed by npm start.
Closing thoughts on the Google Places Insights API
The Google Places Insights API is one of those APIs that is very niche, but performs exceptionally well at what it's designed to do. While it may never be as popular as Place Autocomplete or as widely used as the Geocoding API, it's a very good fit for research and geospatial consulting firms that rely on real world data for analysis.
👋 As always, if you have any questions or suggestions for me, please reach out or say hello on LinkedIn.