Walking on sunshine: Fun with the Google Solar API
See how the Google Solar API helps solar companies automate design, pricing, and quotations.


The Google Solar API helps residential solar companies quickly figure out if your home is a good fit for solar by using detailed rooftop and local weather data from Google Maps. Whether rooftop solar makes sense generally depends on three things:
- The size and orientation of your roof
- The amount of sunlight your area gets each year (e.g. homes in sunny California are better candidates than those in rainy Seattle)
- The cost of electricity in your region
The Google Solar API helps with the first two by analyzing your roof for local solar potential. To check the third, you can look at your energy bill or use a service such as ElectricRate.com that monitors regional electricity usage and pricing.
Part 1: Breathe easier with the Google Air Quality API
Part 2: When trees attack! Build with the Google Pollen API
Part 3: Walking on sunshine: Fun with the Google Solar API (this article)
Why use the Google Solar API?
The biggest reason why a homeowner might want to switch to solar is cost. Solar energy is free, but it costs money to buy and install solar panels. Generally speaking, if your solar energy set up can pay for itself in energy savings within 6 - 10 years, it’s financially viable. Most solar panels last 25 - 30 years, so you’d get 15 - 20 years of “free” electricity after breakeven.
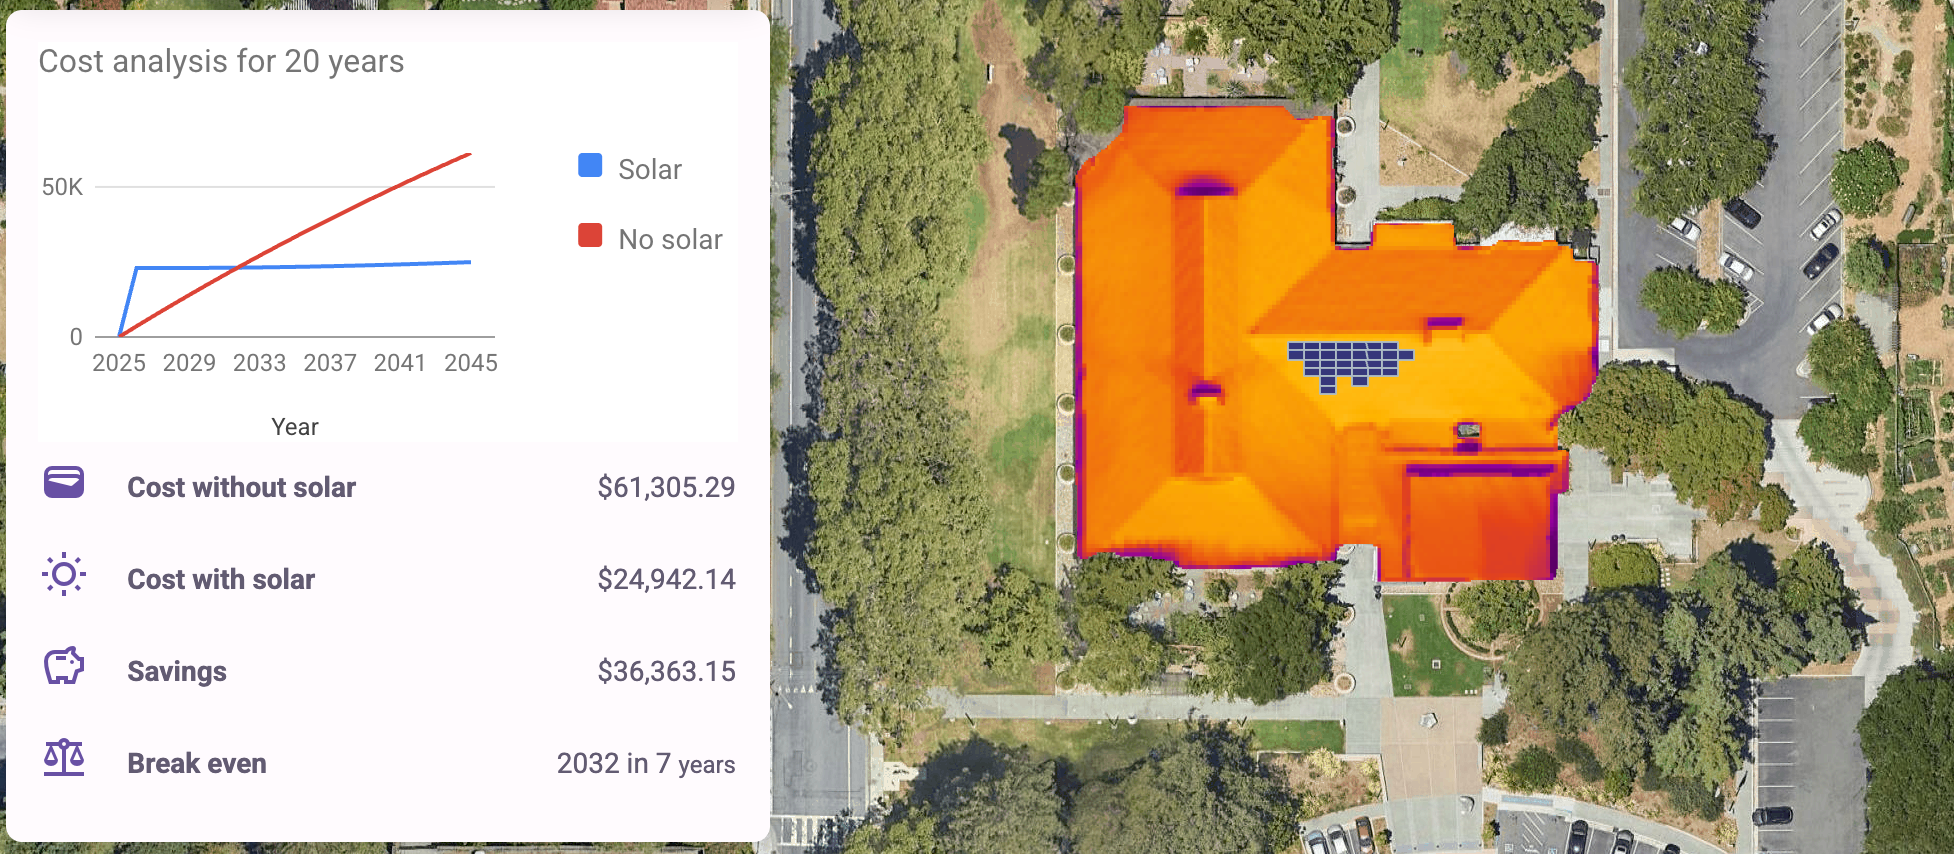
The Google Solar API helps solar installation companies automate system design, pricing, and feasibility analysis by estimating how much sunlight a home receives throughout the year and how much electricity could be generated with a given solar panel setup. This data is then used to create proposals that give homeowners the information they need to decide whether to move forward with a solar installation.
Traditionally, quotations and solar installation proposals were generated through a manual, multi-step process involving in-person visits, hand calculations, and often a sales-heavy approach.
- A sales rep would visit the home or set up a call and gather basic information such as the latest electricity bill, environmental goals, roof age etc.
- A technician would then go to the house to measure the roof with a tape measure or drone, take photos of obstructions and note the roof tilt, orientation, and shading.
- Using tools like Google Earth, a designer would manually trace the roof, choose panel layouts and estimate production using basic irradiance databases.
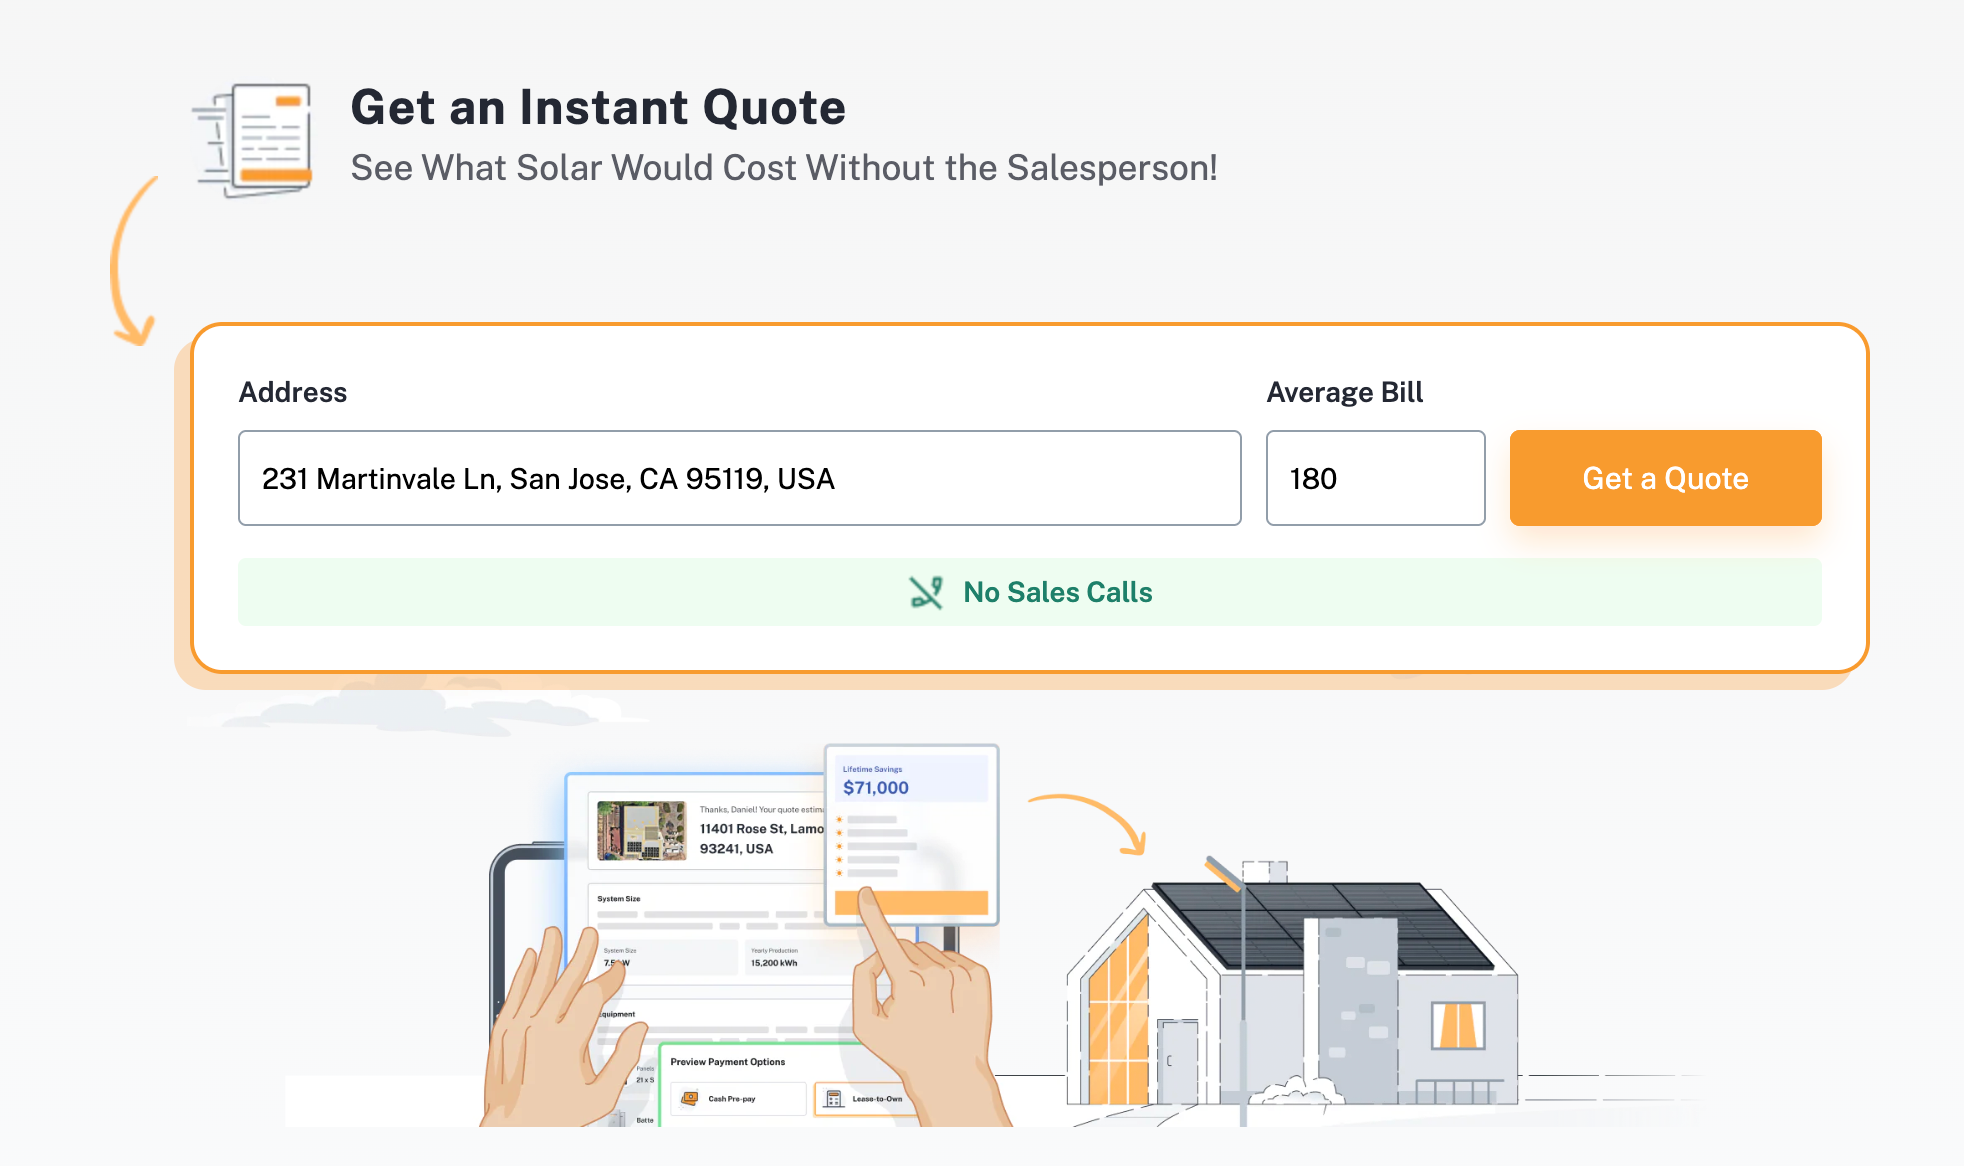
The final step would be for the sales rep to build a proposal that includes system specifications and cost, savings estimates, and financing options. With the Google Solar API, residential solar companies can skip all this work and generate a proposal within seconds, no site visit needed.
Google Solar API use cases
The Google Solar API has proven product market fit and is perfect for companies operating in the direct-to-consumer residential solar and home electrification space. It’s already being used by platforms like Monalee and Project Solar to power fast, online solar quotations without needing a sales person, so cost savings from not needing to pay sales commissions are passed on to the customer.
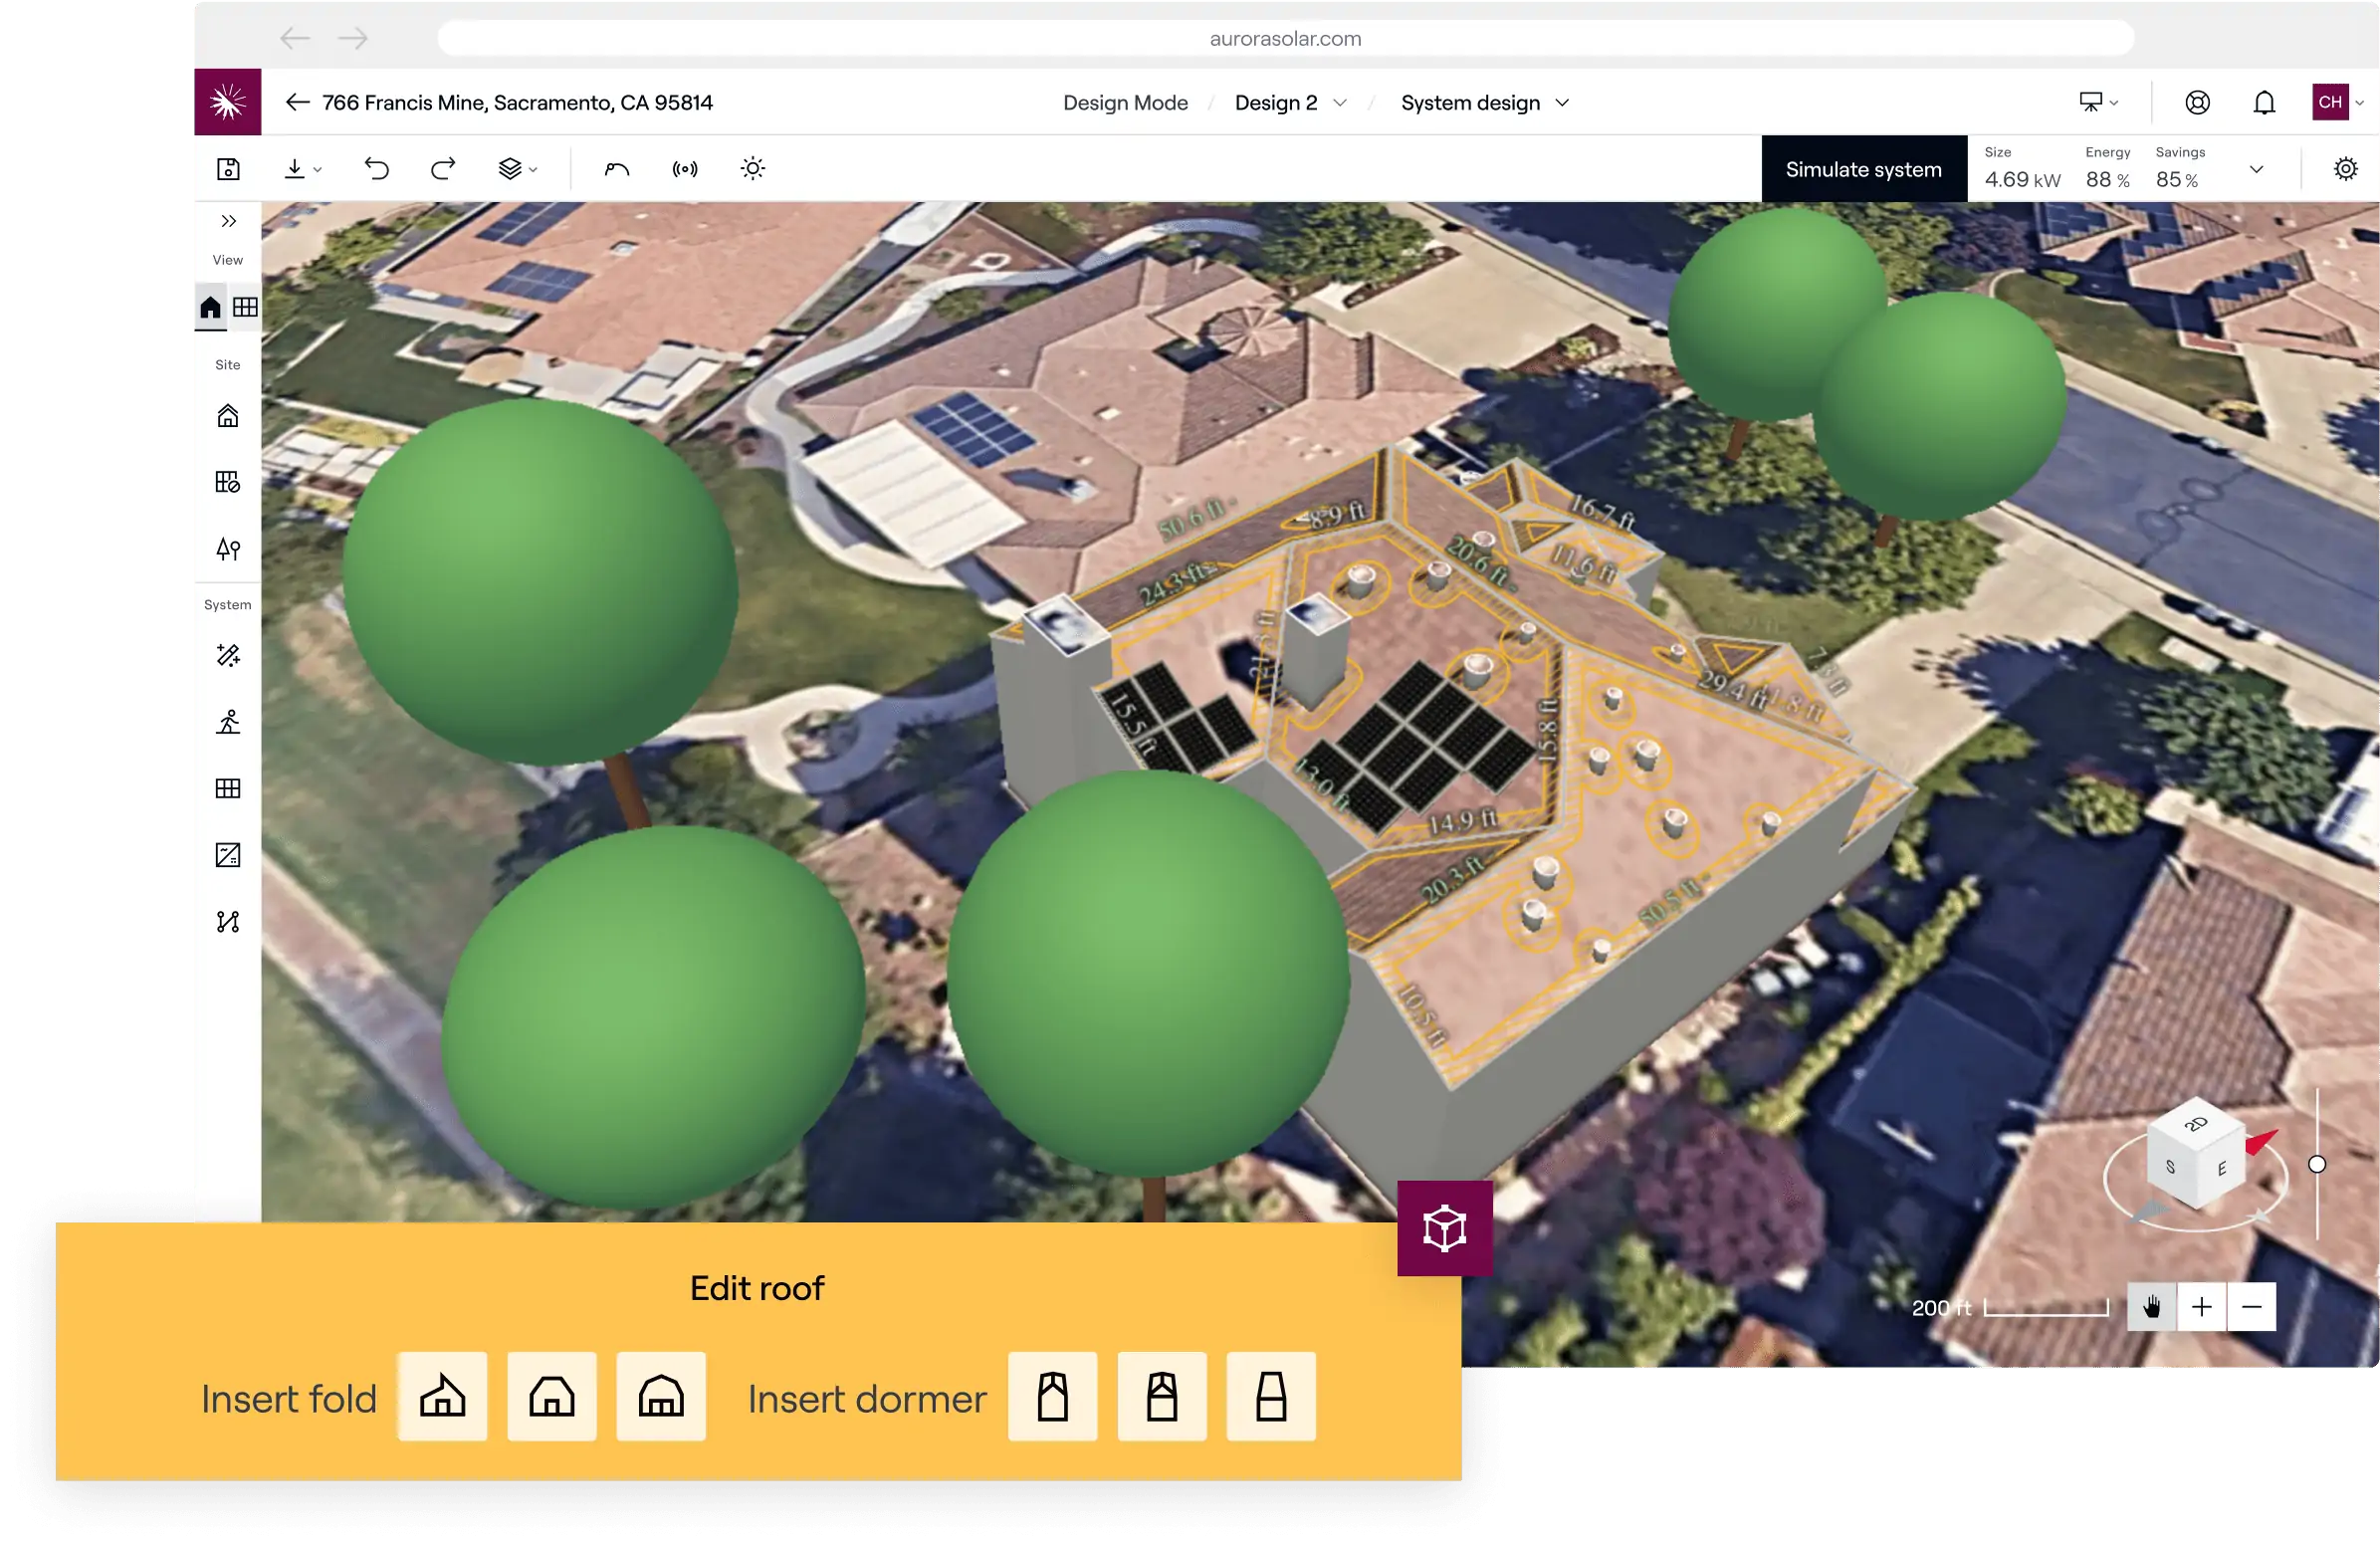
Another group of companies that use the Google Solar API are SaaS (subscription as a service) solar design and sales enablement software platforms such as Aurora Solar and Open Solar. These companies provide the software tools that solar installers rely on to design systems, create proposals, and manage projects more efficiently. They combine data from the Solar API with their own proprietary inputs (e.g. energy storage models, permitting rules, and tax incentives) to generate accurate, personalized proposals that help their customers close deals faster.
In both cases, the value delivered by the Solar API far exceeds the cost charged by Google. Residential solar companies like Monalee earn margins on panel sales, installation, and integration services handled by local contractors, while SaaS platforms like Aurora Solar generate recurring subscription revenue that more than covers the cost of using the API.
To start using the Google Solar API, first create a new project in the Google Cloud Console. Then go to APIs & Services, search for "Pollen", and select the Pollen API from the results. Click [Enable] to activate it for your project.
Google Solar API examples
The Google Solar API has two main endpoints - Building Insights and Data Layers.
Building Insights endpoint
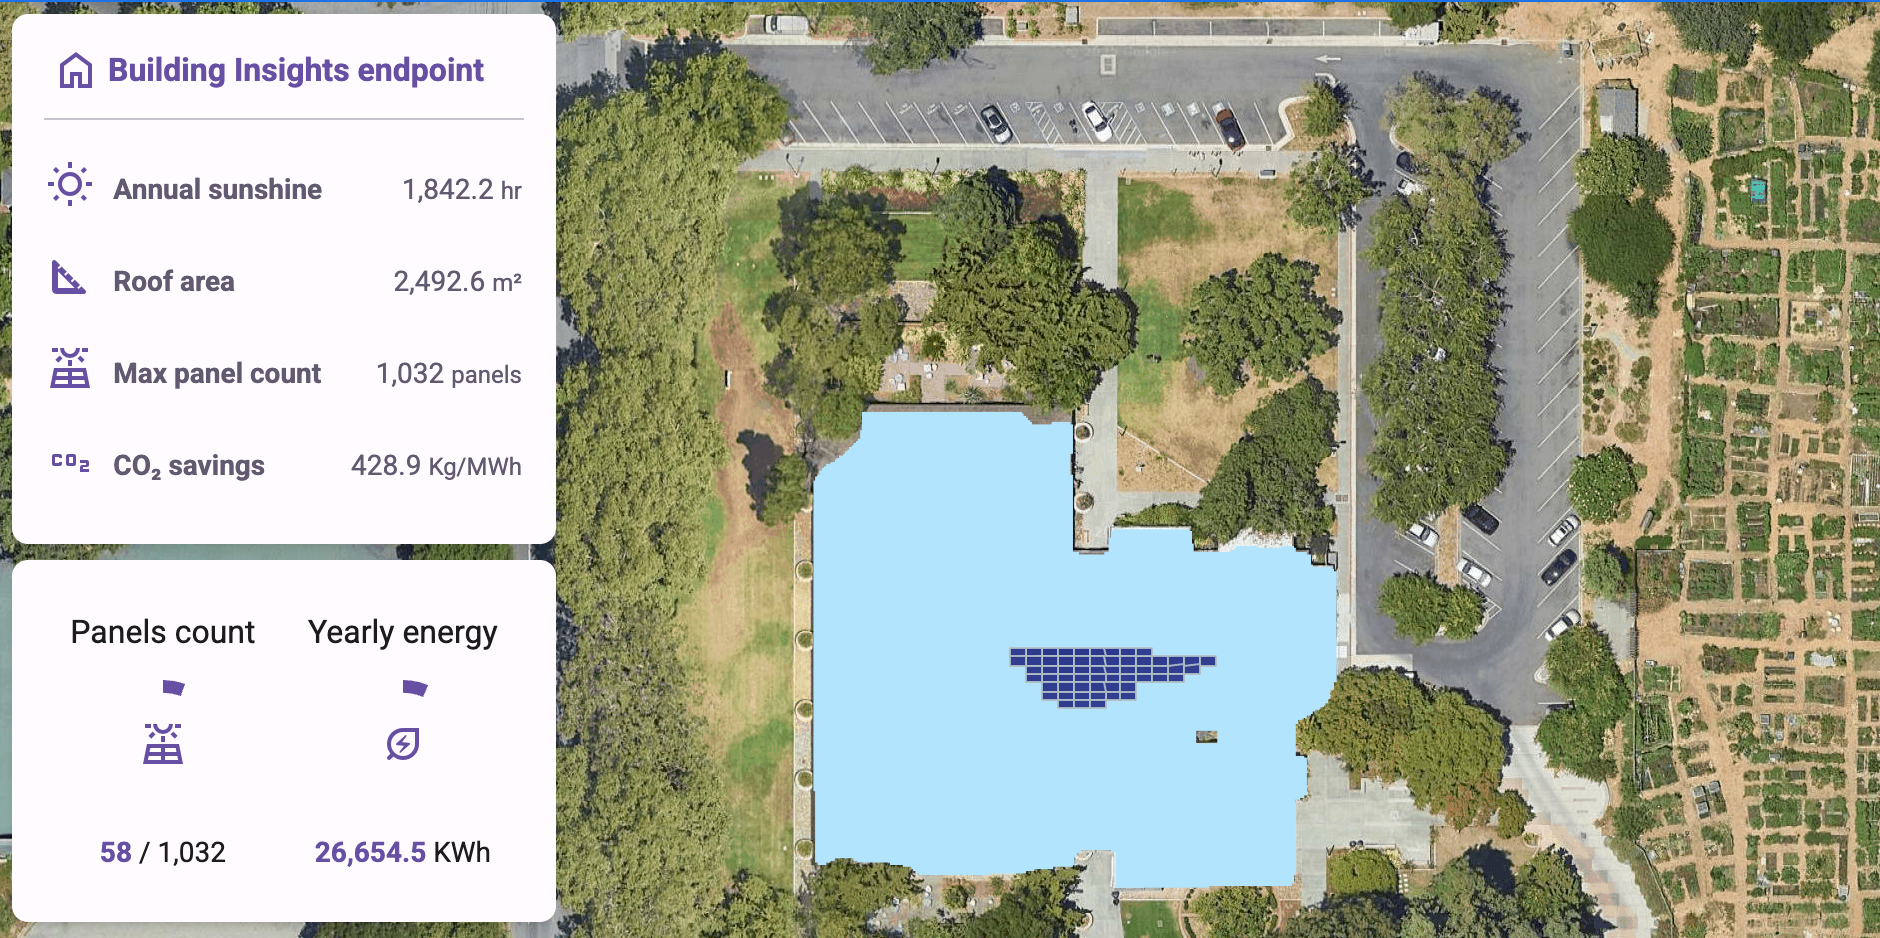
Building Insights returns insights about the location, dimensions and solar potential of a building.
Endpoint: GET
https://solar.googleapis.com/v1/buildingInsights:findClosest?location.latitude={LATITUDE}
&location.longitude={LONGITUDE}
&requiredQuality={REQUIRED_QUALITY}
&key={YOUR_API_KEY}
{LATITUDE} The latitude coordinates of the building you want to get solar data for.
{LONGITUDE} The longitude coordinates of the building you want to get solar data for.
{REQUIRED_QUALITY} Optional. The minimum quality level allowed in the results. No result with lower quality than this will be returned. Not specifying this is equivalent to restricting to HIGH quality only.
{YOUR_API_KEY} This is your Google Maps API key with the Google Solar API enabled.
Using 37.4449095, -122.1392472 (Rinconada Library in Palo Alto) for latitude and longitude gives us:
Endpoint: GET
Response
{
    "name": "buildings/ChIJh0CMPQW7j4ARLrRiVvmg6Vs",
    "center": {
        "latitude": 37.4449703,
        "longitude": -122.1391467
    },
    "imageryDate": {
        "year": 2022,
        "month": 8,
        "day": 14
    },
    "postalCode": "94303",
    "administrativeArea": "CA",
    "statisticalArea": "06085511100",
    "regionCode": "US",
    "solarPotential": {
        "maxArrayPanelsCount": 1032,
        "maxArrayAreaMeters2": 2026.3887,
        "maxSunshineHoursPerYear": 1842.1936,
        "carbonOffsetFactorKgPerMwh": 428.9201,
        "wholeRoofStats": {
            "areaMeters2": 2492.5627,
            "sunshineQuantiles": [
                334.71527,
               //... 10 more entries
            ],
            "groundAreaMeters2": 2370.51
        },
        "roofSegmentStats": [
            {
                "pitchDegrees": 11.578613,
                "azimuthDegrees": 269.51282,
                "stats": {
                    "areaMeters2": 485.80603,
                    "sunshineQuantiles": [
                        414.6854,
                        //... 14 more entries
                    ],
                    "groundAreaMeters2": 475.92
                },
                "center": {
                    "latitude": 37.4449692,
                    "longitude": -122.1393694
                },
                "boundingBox": {
                    "sw": {
                        "latitude": 37.4447384,
                        "longitude": -122.13943139999999
                    },
                    "ne": {
                        "latitude": 37.4451855,
                        "longitude": -122.13929399999999
                    }
                },
                "planeHeightAtCenterMeters": 10.680316
            },
            //... 15 more entries
        ],
        "solarPanelConfigs": [
            {
                "panelsCount": 4,
                "yearlyEnergyDcKwh": 2980.9192,
                "roofSegmentSummaries": [
                    {
                        "pitchDegrees": 12.247173,
                        "azimuthDegrees": 179.3455,
                        "panelsCount": 4,
                        "yearlyEnergyDcKwh": 2980.9192,
                        "segmentIndex": 2
                    }
                ]
            },
            //... 296 more entries
        ],
        "financialAnalyses": [
            {
                "monthlyBill": {
                    "currencyCode": "USD",
                    "units": "20"
                },
                "averageKwhPerMonth": 79.31341,
                "panelConfigIndex": -1
            },
            //... 21 more entries
        ],
        "panelCapacityWatts": 400,
        "panelHeightMeters": 1.879,
        "panelWidthMeters": 1.045,
        "panelLifetimeYears": 20,
        "buildingStats": {
            "areaMeters2": 2543.1538,
            "sunshineQuantiles": [
                301.37714,
                1387.6377,
                1503.2156,
                1550.6935,
                1574.872,
                1608.013,
                1640.0657,
                1693.1407,
                1729.0947,
                1787.7896,
                1923.7723
            ],
            "groundAreaMeters2": 2401.66
        },
        "solarPanels": [
            {
                "center": {
                    "latitude": 37.4449653,
                    "longitude": -122.13911409999999
                },
                "orientation": "LANDSCAPE",
                "yearlyEnergyDcKwh": 746.6432,
                "segmentIndex": 2
            },
			//... 1031 more entries
        ]
    },
    "boundingBox": {
        "sw": {
            "latitude": 37.444723499999995,
            "longitude": -122.13943150000001
        },
        "ne": {
            "latitude": 37.4452261,
            "longitude": -122.13873059999999
        }
    },
    "imageryQuality": "HIGH",
    "imageryProcessedDate": {
        "year": 2025,
        "month": 5,
        "day": 9
    }
}
The response from a Building Insights API call provides the annual solar potential of a building in kWh/m²/year. This isn’t just a measure of how much sun the roof gets - it reflects how effectively that sunlight can be converted into usable electricity. The calculation accounts for factors like the number of installed panels, their orientation and tilt, the building’s latitude, typical cloud cover, and shading from nearby trees or structures.
solarPotential tells you the maximum number (maxArrayPanelsCount) of standard solar panel arrays that can be installed on the building's roof, the total amount of sunshine (maxSunshineHoursPerYear) the building gets in a year, and maxArrayAreaMeters2, the maximum usable roof area maxArrayAreaMeters2 (in square meters) that’s suitable for placing solar panels.
The total usable solar output, yearlyEnergyDcKwh, can be retrieved from the last entry in the solarPanelConfigs array.
/*** solarPanelsConfig[] object ***/
{
"panelsCount": 1032,
"yearlyEnergyDcKwh": 665105.4,
"roofSegmentSummaries": [
//... 297 entries
]
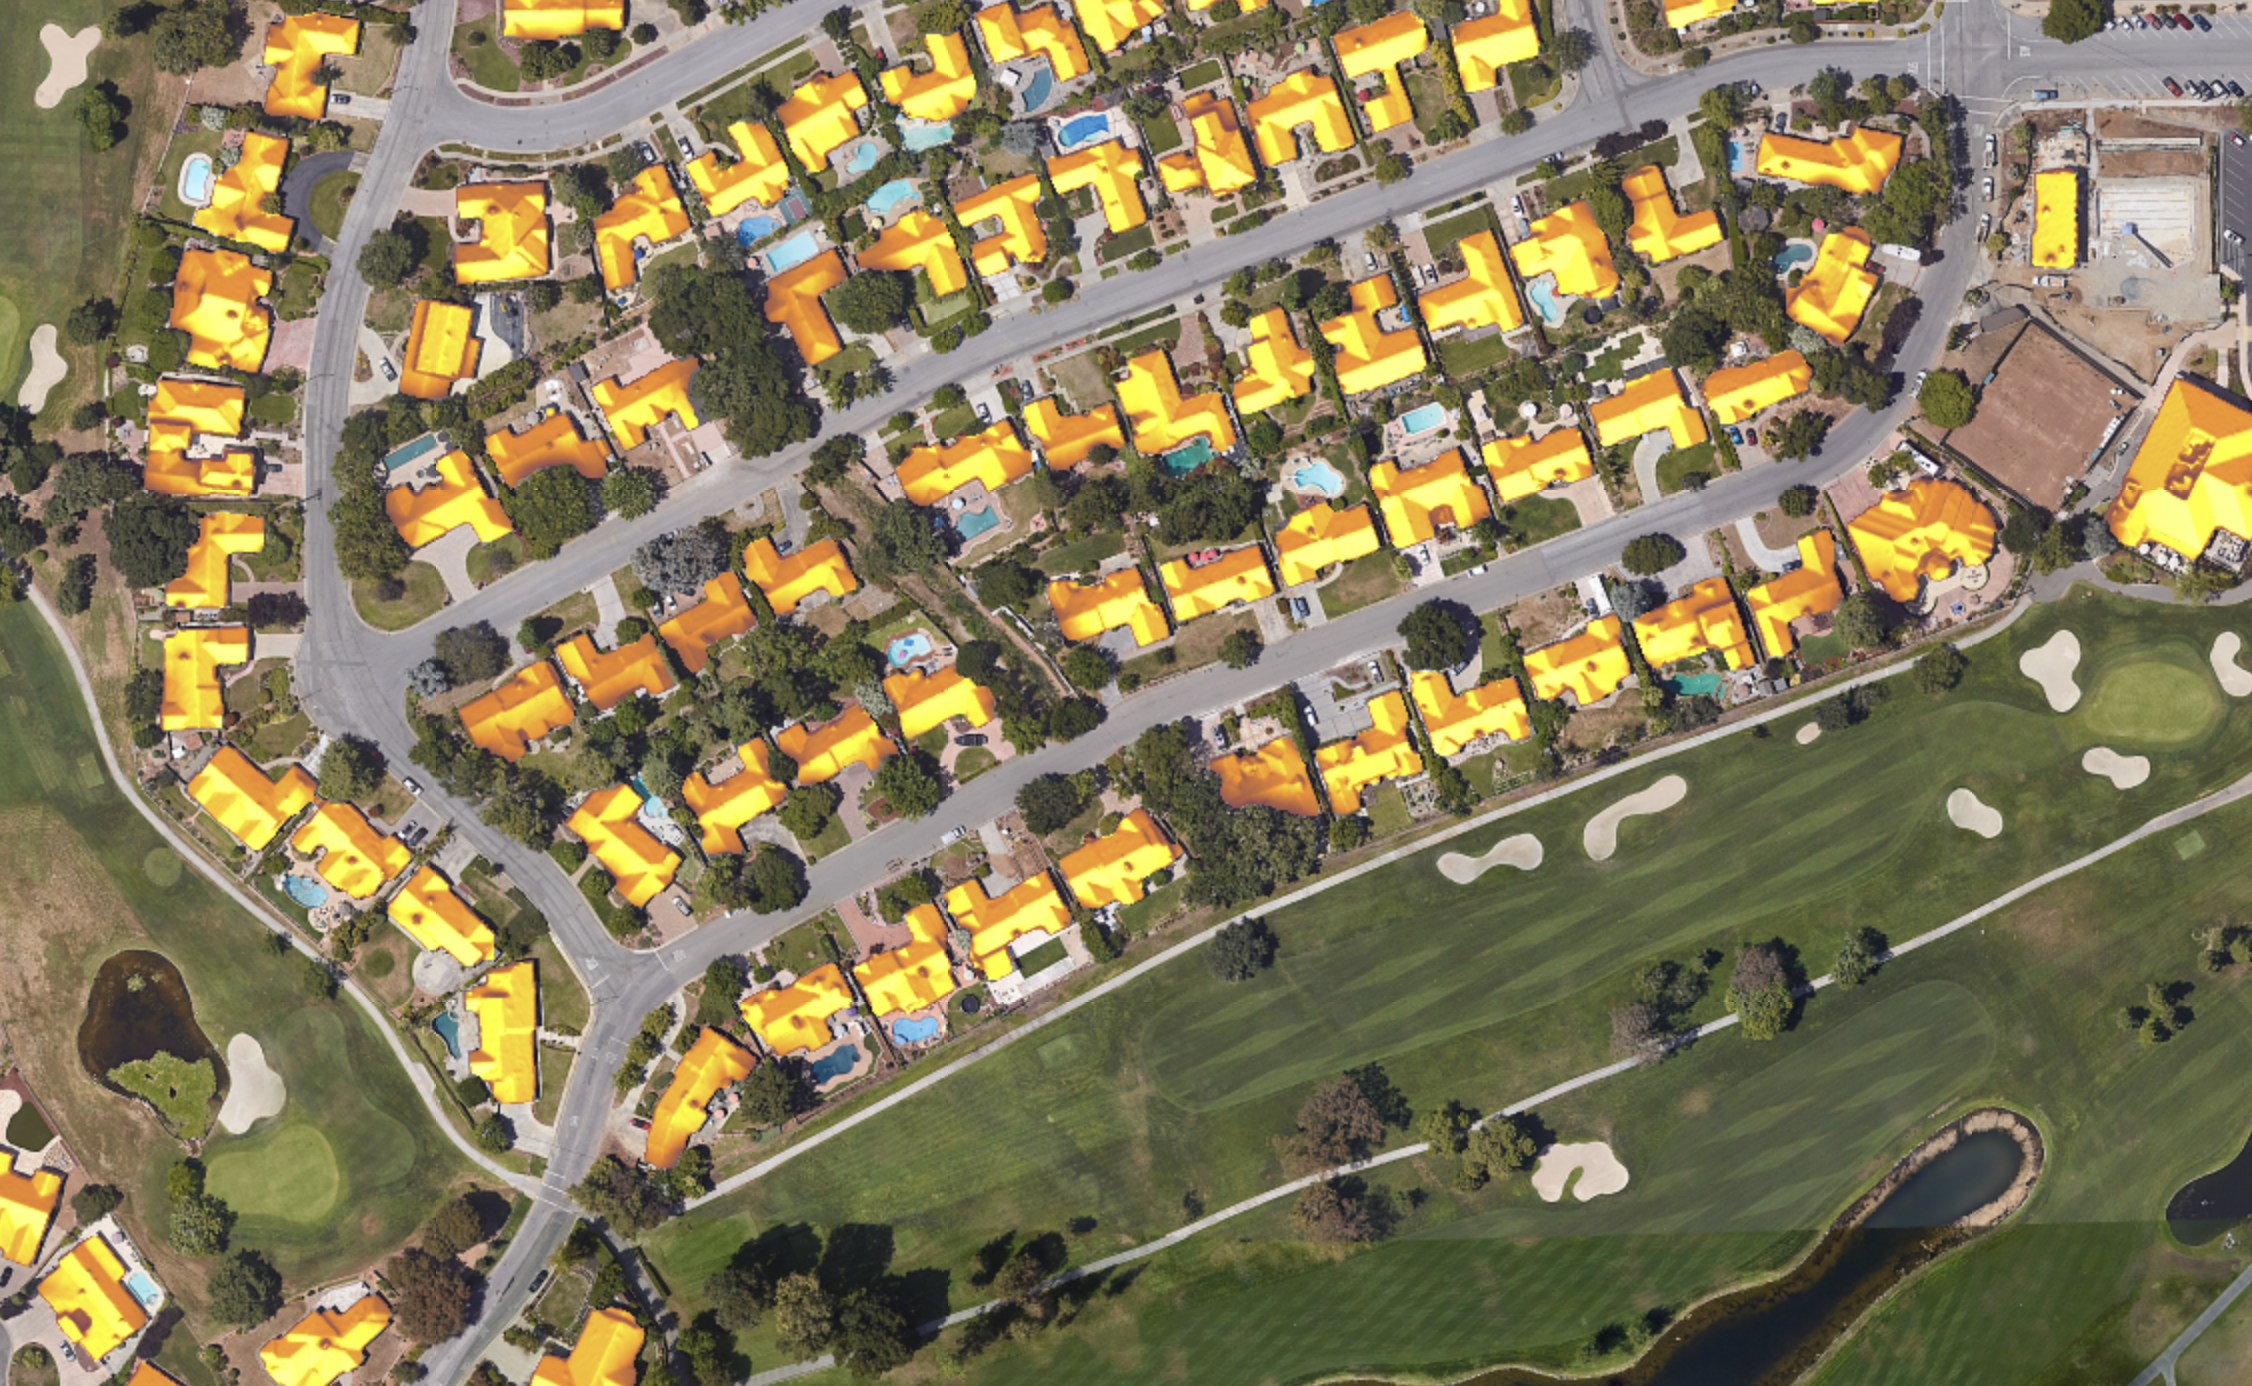
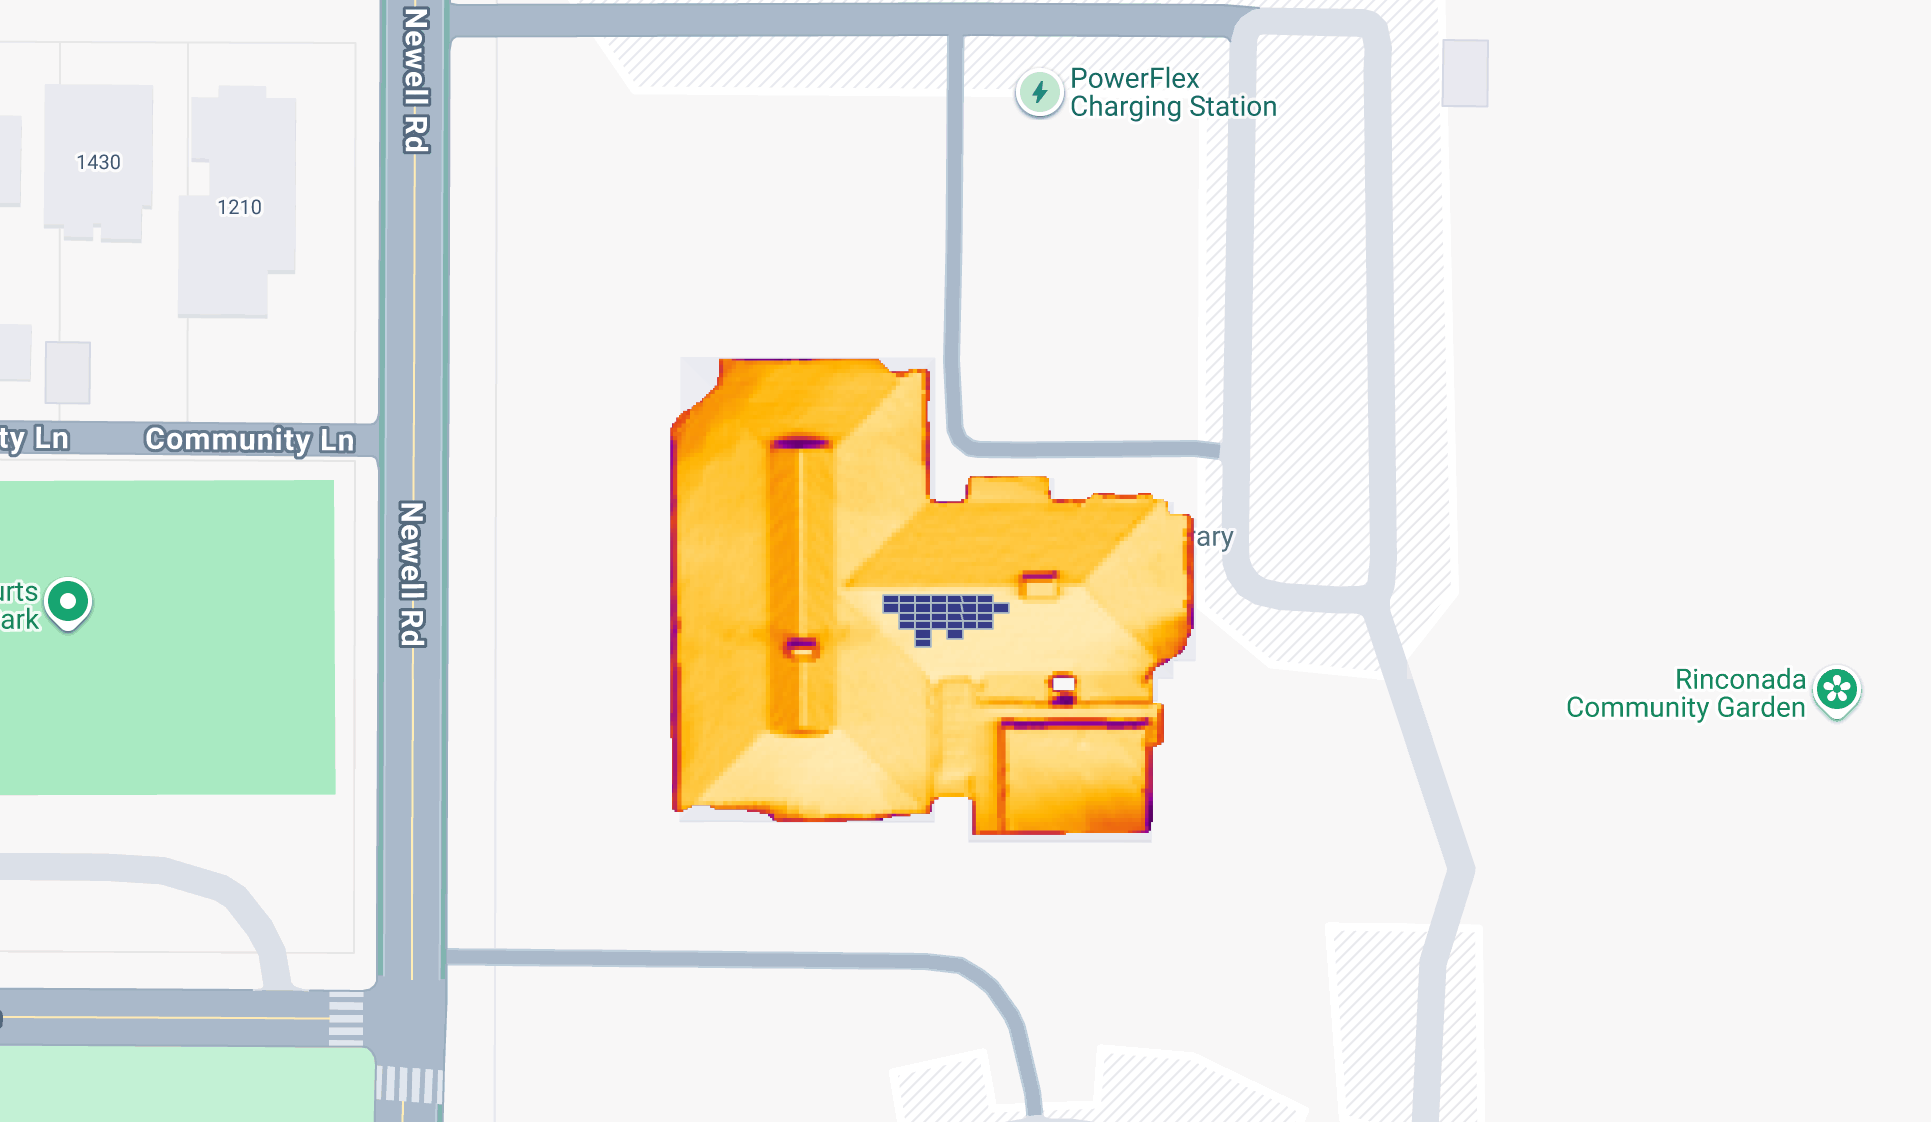
}If you're a solar installer, one of the most useful pieces of data returned by the Google Solar API is the location and orientation of each solar panel in the optimal system layout. As you can see in the images below, the south‑facing roof is filled first because it receives the most sunlight. If your budget only allows for a few solar panels, that’s where you’d want to place them.
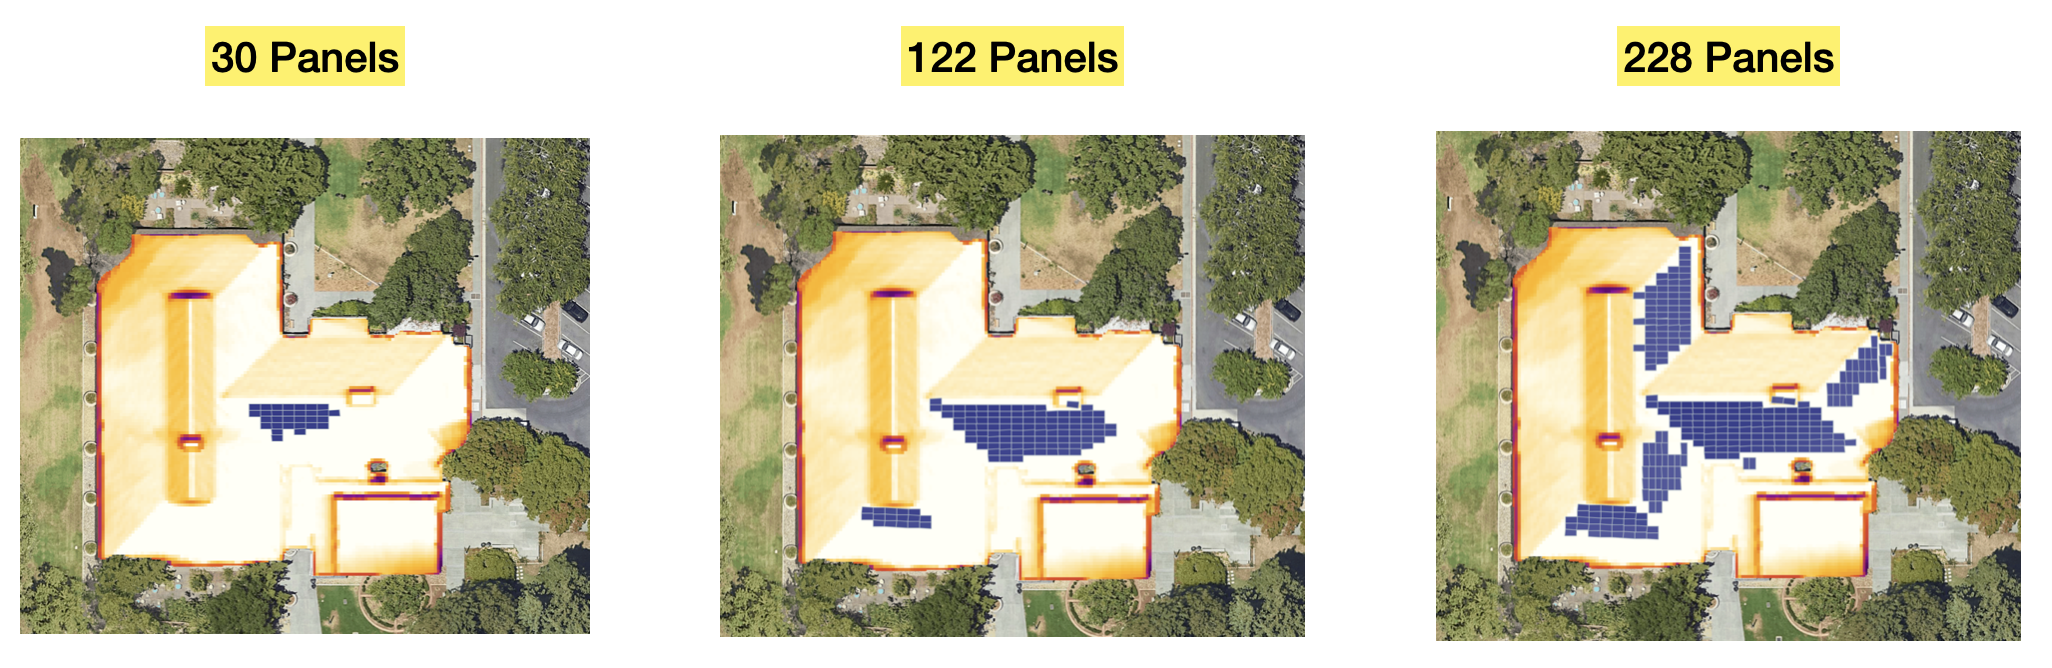
Each object in the solarPanels array has a center.latitutude, center.longitude and . By drawing a rectangle set to panelWidthMeters and panelHeightMeters and rotating it to face azimuthDegrees (the compass direction that the solar panel faces, measured in degrees from true north), you can visualize how your roof will look like when covered with solar panels.
/*** solarPanels[] object ***/
{
    "center": {
        "latitude": 37.4449653,
        "longitude": -122.13911409999999
    },
    "orientation": "LANDSCAPE",
    "yearlyEnergyDcKwh": 746.6432,
    "segmentIndex": 2
}
Annoyingly, azimuthDegrees is not found inside the solarPanels object. You need to match the segmentIndex of the panel to the list of roofSegmentStats to get its direction (azimuthDegrees).
404: Requested entity was not found error, it means that the Solar API does not have the entity (building) in its dataset.Data Layers endpoint
Data Layers returns detailed raw solar information for an area surrounding a location. The data is provided as a set of GeoTIFF files covering the requested region. The GeoTIFF (Geographic Tagged Image File) format is widely used for creating and sharing image based data such as satellite imagery, aerial photography imagery, and raster datasets. Each pixel in a GeoTIFF is mapped to a specific latitude and longitude, making it highly useful for spatial analysis, machine learning, and geospatial visualization.
Each pixel also contains one or more data values, depending on the file’s purpose. In the case of GeoTIFFs returned by the Google Solar API, the pixel values represent solar flux - the total amount of solar energy that reaches each location over the course of a year.
This makes it possible to use the GeoTIFF as a custom overlay in Google Maps, and by applying a color ramp to the data contained in the GeoTIFF file, raw data values can be transformed into visually understandable images.
Endpoint: GET
https://solar.googleapis.com/v1/dataLayers:get?
location.latitude={LATITUDE}
&location.longitude={LONGITUDE}
&radiusMeters={RADIUS_METERS}
&key={YOUR_API_KEY}
{LATITUDE} The latitude coordinates of the building you want to get solar data for.
{LONGITUDE} The longitude coordinates of the building you want to get solar data for.
{RADIUS_METERS} The radius, in meters, defining the region surrounding that centre point for which data should be returned.
{YOUR_API_KEY} This is your Google Maps API key with the Google Solar API enabled.
Using 37.4449095, -122.1392472 (Rinconada Library in Palo Alto) for latitude and longitude gives us:
Endpoint: GET
Response
{
    "imageryDate": {
        "year": 2022,
        "month": 4,
        "day": 6
    },
    "imageryProcessedDate": {
        "year": 2025,
        "month": 4,
        "day": 11
    },
    "dsmUrl": "https://solar.googleapis.com/v1/geoTiff:get?id=MDcyYTRiNzRlM2NiOTQxZDEyNWM1N2Y1YTQ5YTVjYWMtZDFkYzM1YzE3MTcwYTJlN2U5MzM0ZmQ1MmJkNWJkMzY6RFNNOklNQUdFUllfUVVBTElUWV9VTlNQRUNJRklFRA",
    "rgbUrl": "https://solar.googleapis.com/v1/geoTiff:get?id=NWJkZmZmOTYwMjNlN2VjNTI3MjMxY2Q5Y2UyMTYyZjgtMDJmMDIwZGJkOTJmOWIxMTRmNzkwNWNmMGExYTVmY2Q6UkdCOklNQUdFUllfUVVBTElUWV9VTlNQRUNJRklFRA",
    "maskUrl": "https://solar.googleapis.com/v1/geoTiff:get?id=YzYzMzE3OTUwYzU4ZTUzYmM4YmJkOGVhNTU3NzdmZDgtMDQxN2Q2MjI2NDgyODM4MDViMGE2NjNkYWI4MWE1NzQ6TUFTSzpJTUFHRVJZX1FVQUxJVFlfVU5TUEVDSUZJRUQ",
    "annualFluxUrl": "https://solar.googleapis.com/v1/geoTiff:get?id=ZTM0NzMyNTZkMWRjNjE3Njc0NjU2ZTVkNzE0MDRkOGEtMjI0NTQ1ZjEwZTI3ZjhlMmIwYjZiNGU0MmU2ZjA5OTg6QU5OVUFMX0ZMVVg6SU1BR0VSWV9RVUFMSVRZX1VOU1BFQ0lGSUVE",
    "monthlyFluxUrl": "https://solar.googleapis.com/v1/geoTiff:get?id=ZDA0ZTI0ZDhkYjYxMDk4YmE3N2I3MzVlNWEyYzQ1ZWUtMDk0ZGZiMjU1Y2M3MDNhZGMyODA4YTE4OTM4Nzg1MDk6TU9OVEhMWV9GTFVYOklNQUdFUllfUVVBTElUWV9VTlNQRUNJRklFRA",
    "hourlyShadeUrls": [
        "https://solar.googleapis.com/v1/geoTiff:get?id=N2EwOGZkOThkYTQ2N2UyMTlmZDY2NGM5OTZlMDdhY2YtMjI0ZDk1MTExZDBhODNkZmFhZTg2NzgwZjk3YTA4MGE6SE9VUkxZX1NIQURFOklNQUdFUllfUVVBTElUWV9VTlNQRUNJRklFRA",
        //... 11 more entries
    ],
    "imageryQuality": "HIGH"
}
Each string in the Data Layers response is a URL where a corresponding GeoTIFF can be downloaded. These URLs are temporary and rubemain valid for only a few hours after they’re generated.
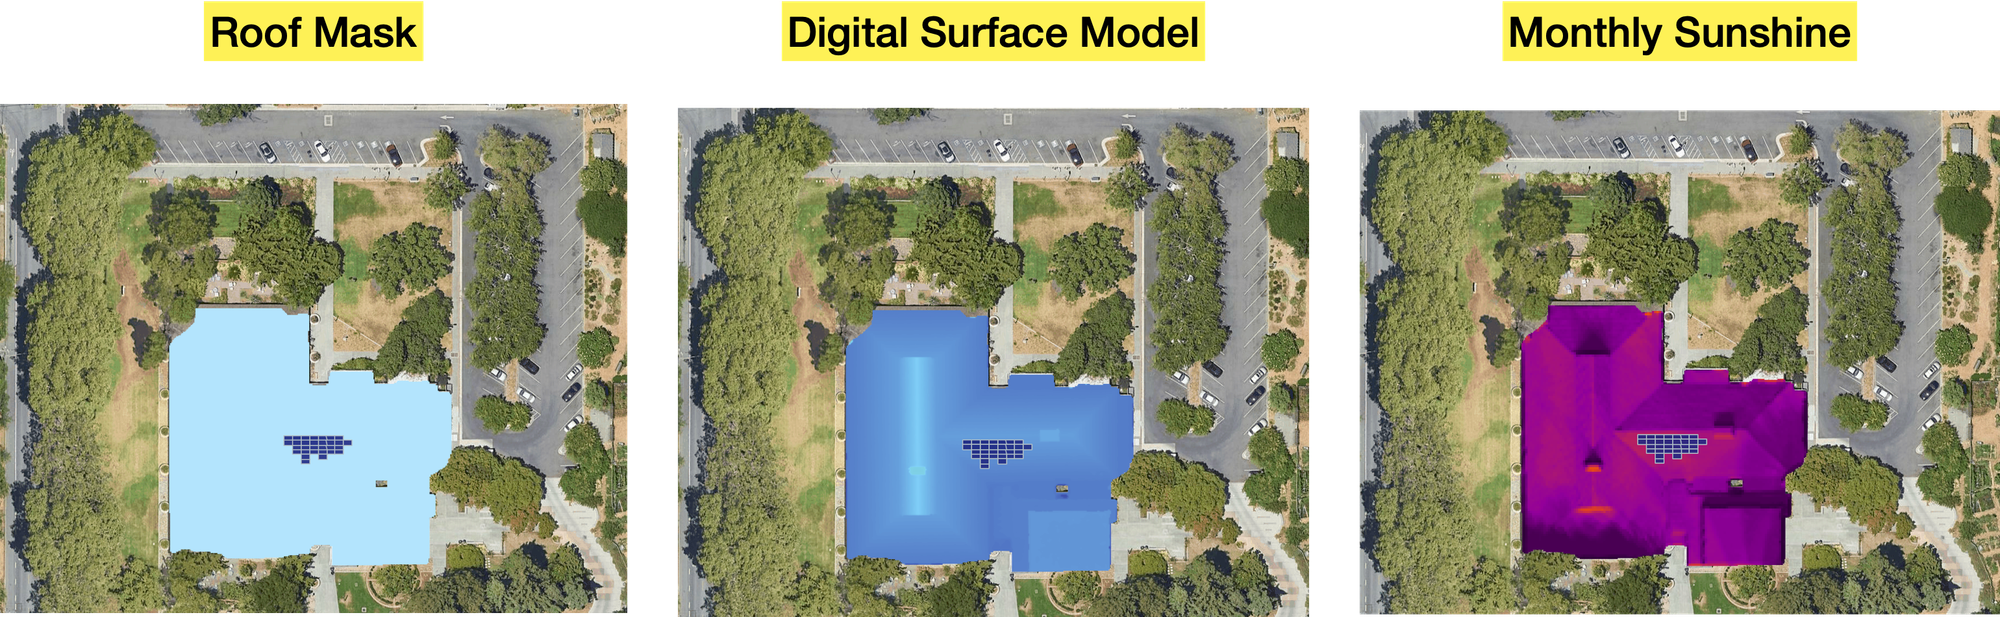
dsmURL is the URL for an image of the Digital Surface Model (DSM) of the building roof.
rgbURL is the URL for an image of RGB data (aerial or satellite photo) of the region.
maskURL is the URL for the building mask image: one bit per pixel saying whether that pixel is considered to be part of a rooftop or not.
annualFluxUrl is the URL for the annual flux map (total annual sunlight) of the region measured in kWh/kW/year.
monthlyFluxUrl is URL for the monthly flux map of the region.
Overlaying a GeoTIFF on Google Maps (with code)
Visualizing solar flux on Google Maps involves two main steps. First, we extract the data from the GeoTIFF file and convert it into a png image. Then, we add that png as a custom overlay on Google Maps.
Converting a GeoTIFF to png
For this task, we'll be using these two libraries.
- https://geotiffjs.github.io/ - to read raster data from the GeoTIFF
- https://github.com/santilland/plotty - to render the raster data onto a
<canvas>with a color ramp.
Step 1: Load the GeoTIFF file
Use geotiff.js to read and parse the file into raster data.
const arrayBuffer = await fetch("**/mnt/data/geoTiff_get (2).tiff**").then(res => res.arrayBuffer());
const tiff = await GeoTIFF.fromArrayBuffer(arrayBuffer);
const image = await tiff.getImage();
Step 2: Extract the raster data
Read the pixel values from the first band of the image (e.g. solar flux, elevation, etc).
const raster = await image.readRasters();
const data = raster[0];  // First band data
const width = image.getWidth();
const height = image.getHeight();
Step 3: Render the data to a canvas with a color ramp
Use plotty, a JavaScript raster renderer, to draw the pixel values as a color-mapped image on a <canvas>.
const canvas = document.getElementById("canvas");
canvas.width = width;
canvas.height = height;

const plot = new plotty.plot({
  canvas: canvas,
  data: data,
  width: width,
  height: height,
  domain: [Math.min(...data), Math.max(...data)],  // scale to data range
  colorScale: "viridis"  // or "jet", "gray", etc.
});
plot.render();
Step 4: Export the canvas as a png
You can now export the canvas to a png file and trigger a download.
const pngDataUrl = canvas.toDataURL("image/png");
const link = document.createElement("a");
link.href = pngDataUrl;
link.download = "converted_geotiff.png";
link.click();
Adding the png as a custom overlay to Google Maps
Step 1: Prepare the PNG image
Using the png image created in the first step:
/downloads/data/rinconada_librarygeotiff_custom.png
Step 2: Define the image bounds (GeoTIFF coordinates)
Define the bounding box of the image to properly place it on the map (you can get from the GeoTIFF metadata).
const imageBounds = {
  north: 37.425,  // top edge latitude
  south: 37.422,  // bottom edge latitude
  east: -122.083, // right edge longitude
  west: -122.087  // left edge longitude
};
Step 3: Add the png as a GroundOverlay in Google Maps
Add the png to Google Maps as a GroundOverlay object.
<!DOCTYPE html>
<html>
  <head>
    <title>GeoTIFF PNG Overlay on Google Maps</title>
    <script src="https://maps.googleapis.com/maps/api/js?key=YOUR_API_KEY"></script>
    <style>
      #map { height: 100vh; width: 100vw; }
    </style>
  </head>
  <body>
    <div id="map"></div>
    <script>
      function initMap() {
        const map = new google.maps.Map(document.getElementById("map"), {
          zoom: 18,
          center: { lat: 37.4235, lng: -122.085 },
          mapTypeId: "satellite"
        });

        const imageBounds = {
          north: 37.425,
          south: 37.422,
          east: -122.083,
          west: -122.087
        };

        const overlay = new google.maps.GroundOverlay(
          "/downloads/data/rinconada_librarygeotiff_custom.png
",  // will be rewritten as URL
          imageBounds,
          { opacity: 0.6 }
        );

        overlay.setMap(map);
      }

      window.onload = initMap;
    </script>
  </body>
</html>
The end result of overlaying a png on a Google Map is a visual layer that sits on top of the map tiles, aligned to real world geographic coordinates.
Google Solar API pricing
The Google Solar API follows a pay-as-you-go pricing model, similar to other Google Maps Platform services. There's a free usage cap of 10,000 calls per month for Building Insights and 1,000 per month for Data layers and past that, calls are billed on a tiered basis according to the schedule below.
| 0 - 100k | 100k - 500k | 500k - 1M | 1M - 5M | 5M - 10M | 10M - 20M | 20M + | |
|---|---|---|---|---|---|---|---|
| Building Insights | $10.00 | $5.00 | $4.50 | $4.00 | $3.50 | $3.50 | $3.50 |
| Data Layers | $75.00 | $37.50 | $33.75 | $30.00 | $26.25 | $26.25 | $26.25 |
* CPM: cost per thousand requests
The first five tiers (up to 5M - 10M) are available to the public. You just need to set up a GCP billing account with your credit card and every month and you'll be charged automatically based on volume. The last two tiers (10M - 20M and 20M +) are only available if you work with a Google Maps Partner.
What next for the Google Solar API?
The Google Solar API originated from Project Sunroof - a free online tool that helped homeowners estimate their rooftop solar potential using 3D roof data and local weather patterns.
As a commercial product however, the Solar API must demonstrate strong revenue potential to justify ongoing investment and maintain its place within the increasingly competitive Google Maps Platform product lineup. In theory, this should be easy:
- The Solar API solves a real world problem at scale. It removes friction from the solar quoting and system design process and reduces the need for costly site visits and manual measurements.
- The Solar API delivers strong business value and shows excellent product–market fit. It helps solar installation companies increase conversion rates (more leads, more closed deals) by providing homeowners with fast, accurate, and transparent data.
- The value it provides solar installation companies far outweighs its cost. For most users, the price of the Solar API is a small fraction of the value it enables (e.g. $0.10 - $0.75 per API call vs thousands of dollars in solar contracts).
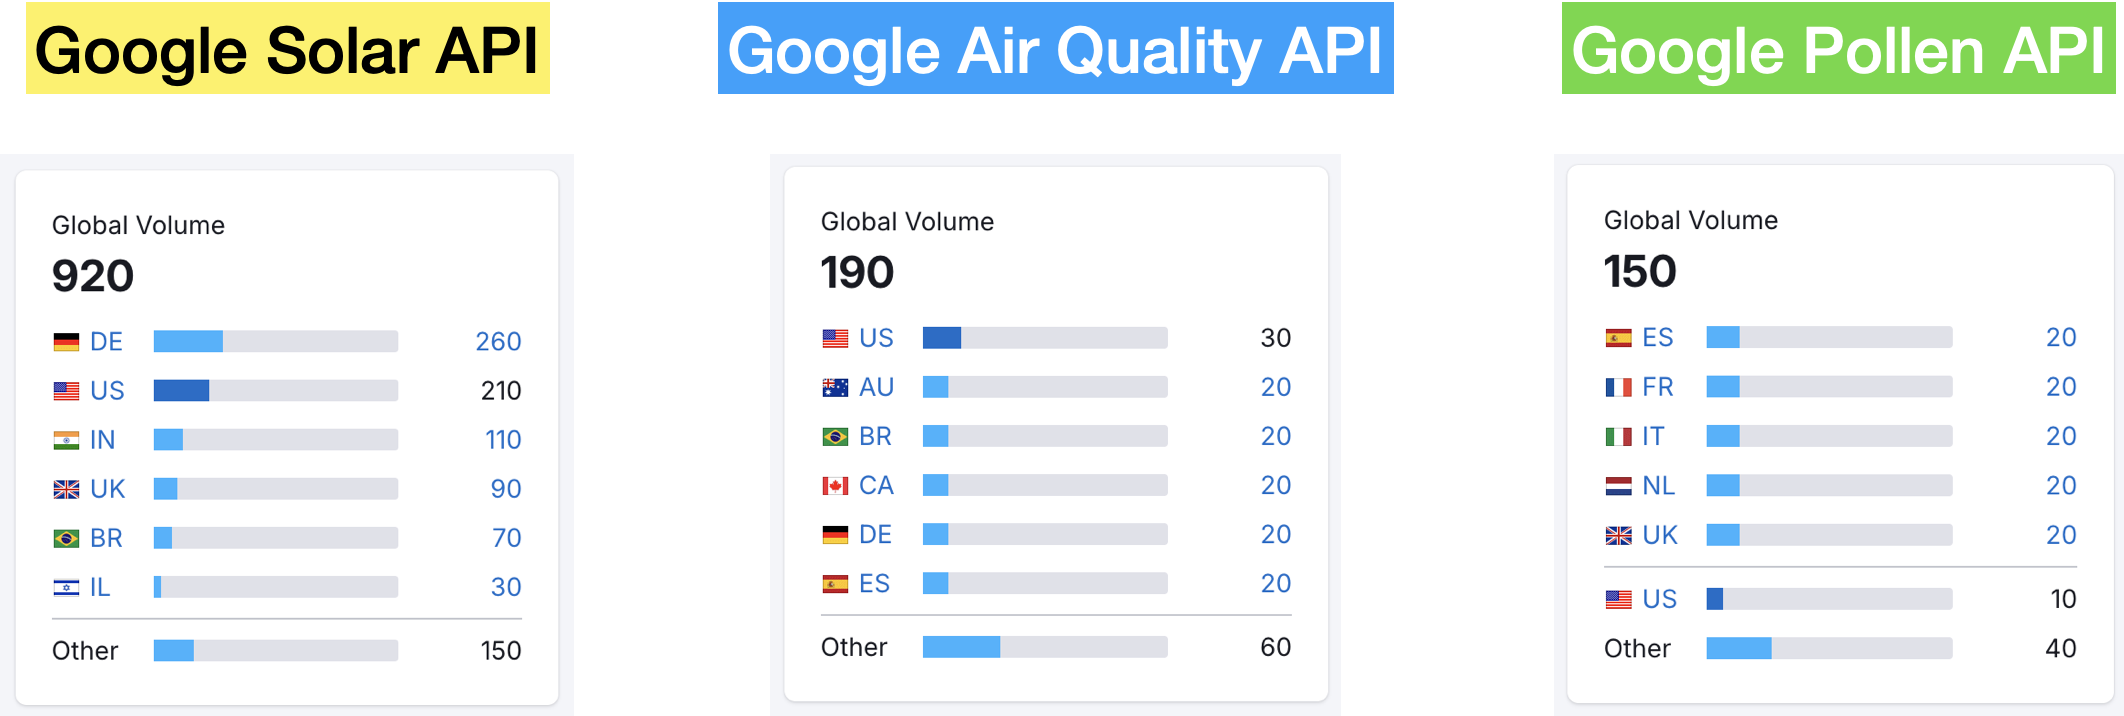
It's also very popular. If you look at monthly search volume, more than 5 times as many people searched for "Google Solar API" compared to "Google Air Quality API" or "Google Pollen API", so there is definitely demand for the product.
The one thing that gives me pause though is that while solar energy is renewable, demand for the Solar API isn't. Once a quote is generated for a specific address, it can be reused indefinitely - there’s no need to call the API again. This contrasts with services like the Routes API, which must be called every time a user requests real time driving directions that take into account current traffic conditions.
Furthermore, demand for residential solar (and services like the Google Solar API) is closely tied to government incentives. With many federal and state tax credits set to expire by 2025, homeowners have a limited window to take advantage of these subsidies. As a result, long term demand may decline, particularly for systems that rely heavily on federal support.
👋 As always, if you have any questions or suggestions for me, please reach out or say hello on LinkedIn.