When trees attack! Build with the Google Pollen API
Get relevant, localized pollen count data and heatmap visualizations with the Google Pollen API.

Pollen allergies are more than just a nuisance. For millions of people, they’re a serious health issue that can affect sleep, breathing, and everyday productivity. According to the CDC, an estimated 19.2 million adults and 5.2 million children in the United States were diagnosed with hay fever (the common term for acute pollen allergies, also known as seasonal allergic rhinitis) in 2021. Each year, billions are spent on medications, doctor visits, and lost productivity.
In this post, I’ll explain why pollen data matters, highlight real world examples of pollen aware applications, and introduce the Google Pollen API, together with how you can use it to enhance your own app’s health and environmental awareness features.
Part 1: Breathe easier with the Google Air Quality API
Part 2: When trees attack! Build with the Google Pollen API (this article)
Part 3: Walking on sunshine: Fun with the Google Solar API
What is pollen and how does it cause allergies?
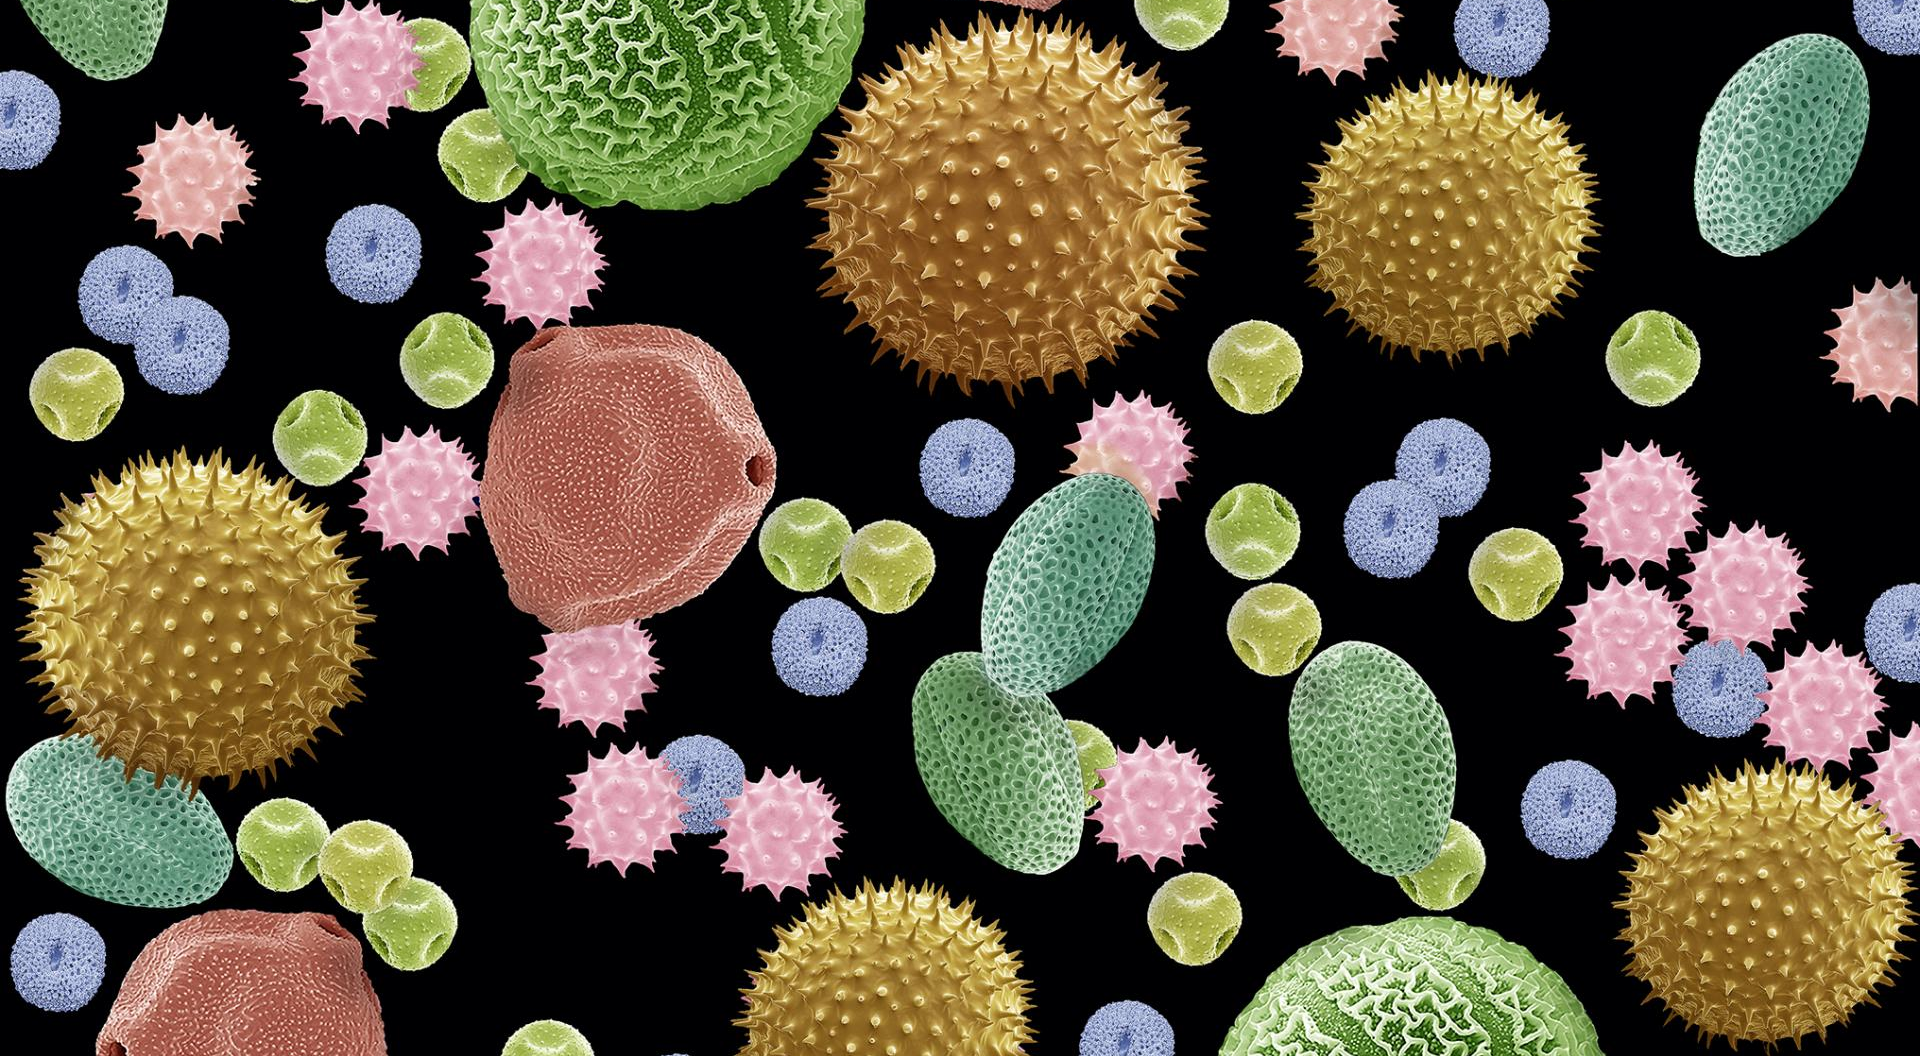
Pollen is a fine, powdery substance made up of microscopic grains that come from the male part of flowering plants, trees, grasses, and weeds. Each pollen grain contains a male gamete (reproductive cell) and when it reaches the female part of a plant (the stigma), fertilization can occur, allowing the plant to fruit and produce seeds.
Some plants rely on insects like bees for pollination, while others depend on the wind. It’s the wind pollinated species (e.g. oak trees) that usually produce large amounts of lightweight pollen, which can travel long distances through the air. When inhaled, the human body often mistakenly treats this harmless pollen as a threat, triggering an immune response that leads to symptoms such as sneezing, nasal congestion, runny noses, sore throats, and itchy eyes.
As the planet warms and carbon dioxide levels rise, plants not only produce more allergenic pollen but also spread to new areas. This results in longer allergy seasons and a global rise in seasonal allergies fueled by climate change.
What is the Google Pollen API?
The Google Pollen API is part of the Google Maps Platform’s new suite of environmental data APIs. It offers localized pollen counts, heatmap visualizations and detailed information about allergenic plants for the most common allergens in over 65 countries.
Traditionally, pollen is measured and forecasted using a combination of manual air sampling, microscopic analysis, and weather based prediction models. It’s a labor intensive process that relies on physical stations and trained technicians. It's also slow, which means that pollen forecasts come out several days too late to be useful.
In contrast, the Google Pollen API uses a computer model to estimate pollen seasonality and daily pollen levels on a 1×1 km grid across more than 65 countries. The model combines data on land cover, climate conditions, and annual pollen production per plant species to provide accurate predictions of local pollen levels and exposure risk. The API supports 5-day forecasts, covers three plant types (trees, weeds, and grasses), and includes data on 15 specific allergenic plant species.
How the Google Pollen API works
The Google Pollen API has two main endpoints:
- Forecast: Gives the 5-day pollen forecast with daily information, including pollen index for types of plants. You can get real time pollen levels by setting
days=1. - Heatmap Tiles: Provides pollen related heatmaps through a tile overlay.
Pollen levels are measured using UPI, or Universal Pollen Index. It's a standardized scale created by Google to quantify daily pollen levels in a way that’s simple, consistent, and easy to understand, regardless of location or plant type. Typically, pollen levels are reported as a daily average concentrations e.g.
- Low: < 15 grains/m³
- Moderate: 15–89 grains/m³
- High: 90–1499 grains/m³
- Very high: 1500+ grains/m³ (varies by region and plant type)
Google simplified this by inventing their own 0 - 5 UPI scale (with categories like "Low", "Moderate" and "High") that combine different pollen types into one exposure score. This makes it better suited for consumer apps because the UPI can be easily shown as color coded badges, alerts, or widgets.
Google Pollen API examples
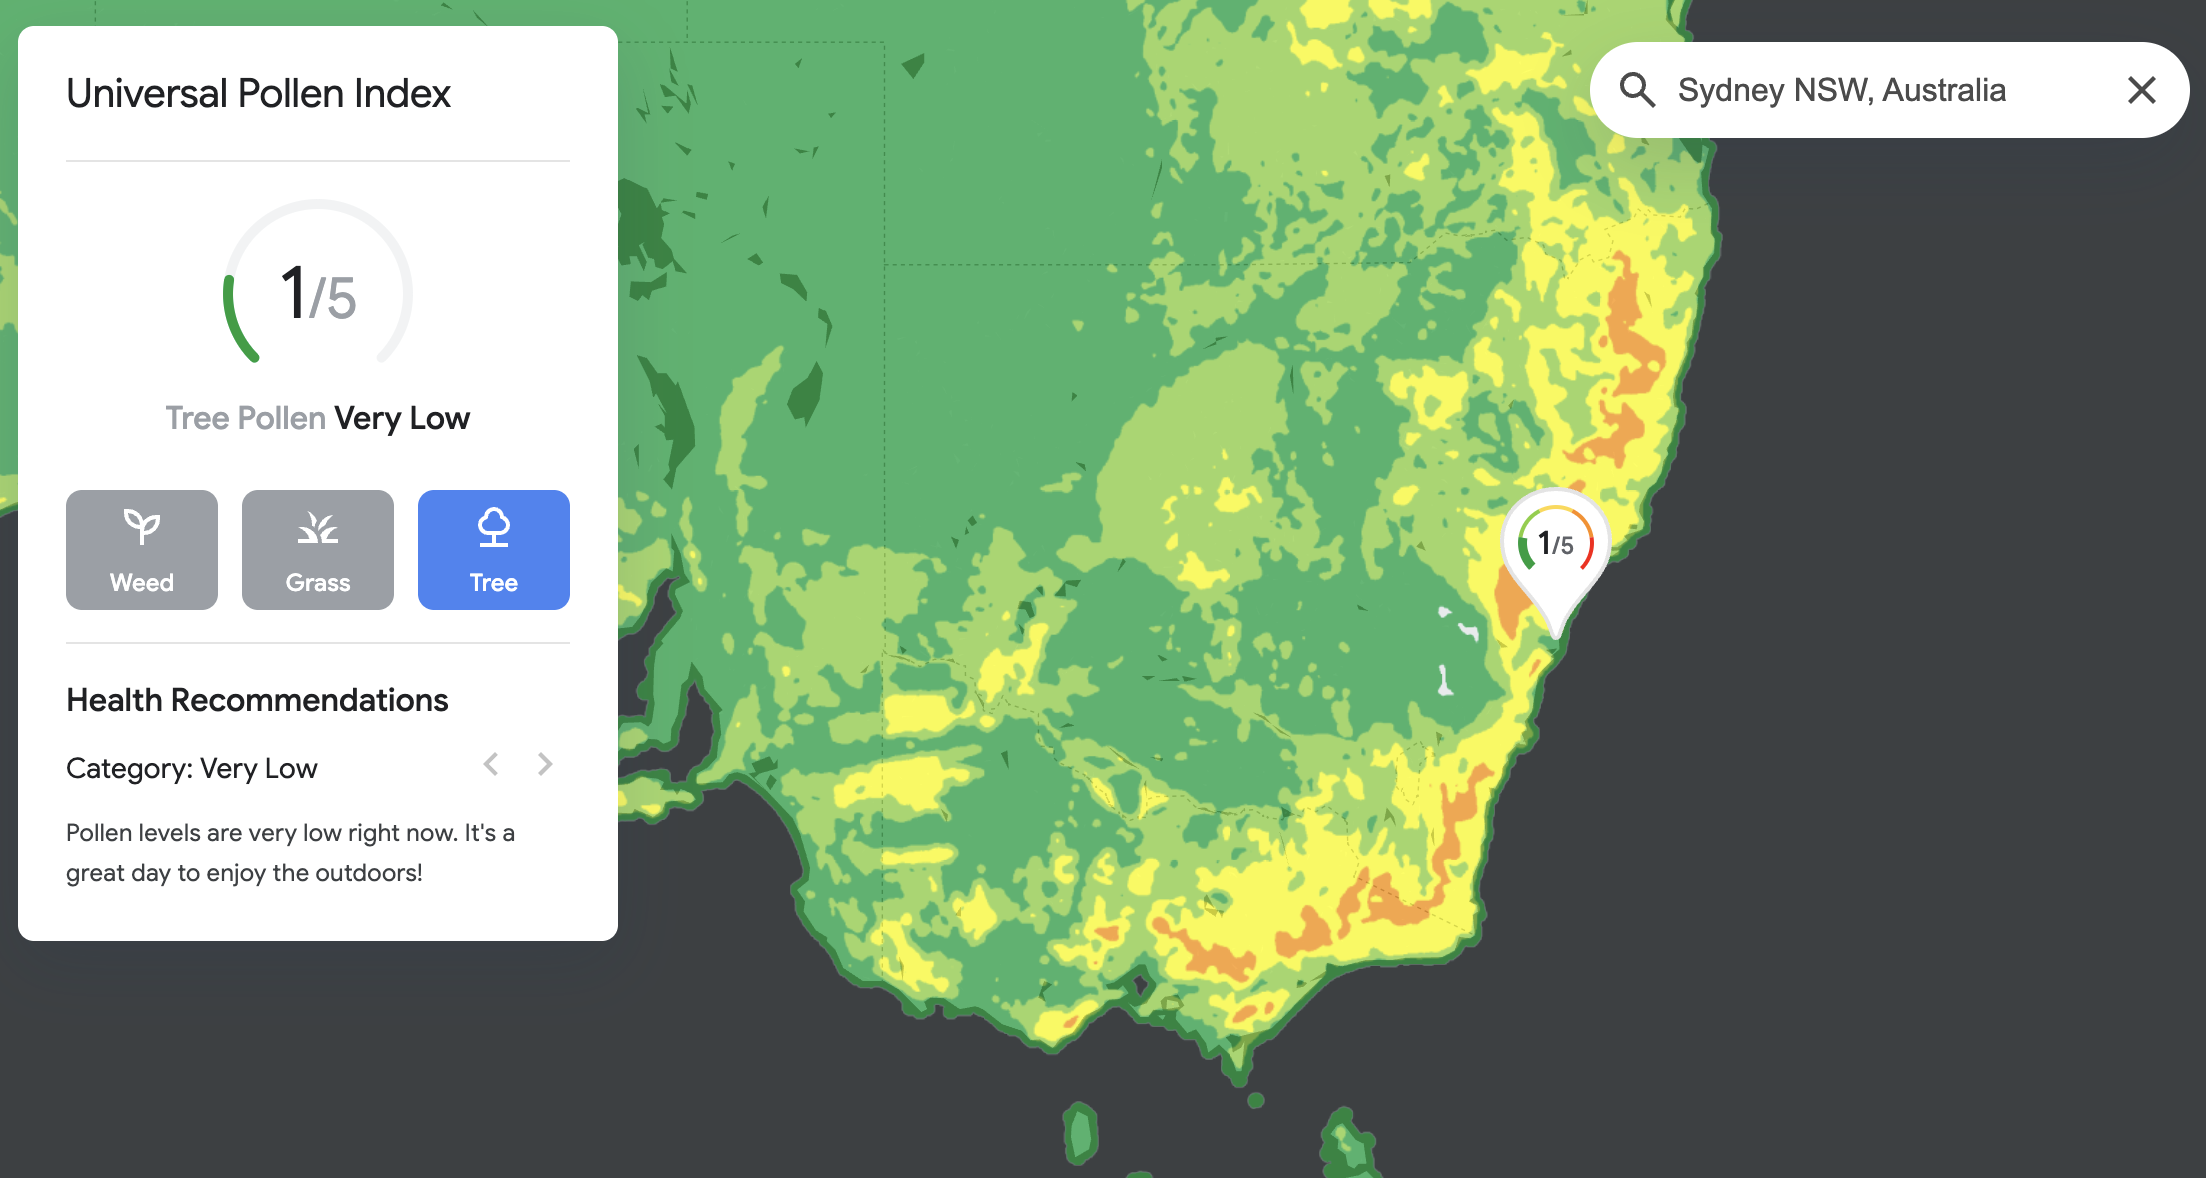
Here's what the data returned by the Pollen API looks like for Sydney, Australia (-33.8478053,150.6023371).
Forecast
The Forecast endpoint returns the 5-day pollen forecast for a specific geographic location (latitude & longitude).
Endpoint: GET
https://pollen.googleapis.com/v1/forecast:lookup?key={YOUR_API_KEY}
&location.latitude={LATITUDE}
&location.longitude={LONGITUDE}
&days={DAYS}
{YOUR_API_KEY} This is your Google Maps API key with the Google Pollen API enabled.
{LATITUDE} The latitude coordinates of the location you want to get weather for.
{LONGITUDE} The longitude coordinates of the location you want to get weather for.
{DAYS} is the number of days you want to get the forecast for. If you don't set it, it defaults to the maximum of 5 days.
Using 2 days and -33.8478053, 150.6023371 for latitude and longitude gives us:
Endpoint: GET
Response
{
"regionCode": "AU",
"dailyInfo": [
{
"date": {
"year": 2025,
"month": 10,
"day": 8
},
"pollenTypeInfo": [
{
"code": "TREE",
"displayName": "Tree",
"inSeason": true,
"indexInfo": {
"code": "UPI",
"displayName": "Universal Pollen Index",
"value": 3,
"category": "Moderate",
"indexDescription": "People with allergy to pollen are likely to experience symptoms",
"color": {
"red": 1,
"green": 1
}
},
"healthRecommendations": [
"It's important to shower and wash your hair after spending a lot of time outdoors.",
"When spending time outside, use sunglasses and a cap to keep pollen out of your face and eyes.",
"Wash clothes worn outdoors to remove any remnants of pollen grains.",
"If possible, wear glasses instead of contact lenses.",
"Did you hang any laundry outside? Now is a good time to hang clothes indoors or use a dryer if possible."
]
},
{
"code": "GRASS",
"displayName": "Grass",
"inSeason": false,
"indexInfo": {
"code": "UPI",
"displayName": "Universal Pollen Index",
"value": 1,
"category": "Very Low",
"indexDescription": "People with very high allergy to pollen are likely to experience symptoms",
"color": {
"green": 0.61960787,
"blue": 0.22745098
}
},
"healthRecommendations": [
"Pollen levels are very low right now. It's a great day to enjoy the outdoors!"
]
}
],
"plantInfo": [
{
"code": "CYPRESS_PINE",
"displayName": "Cypress Pine",
"inSeason": true,
"indexInfo": {
"code": "UPI",
"displayName": "Universal Pollen Index",
"value": 3,
"category": "Moderate",
"indexDescription": "People with allergy to pollen are likely to experience symptoms",
"color": {
"red": 1,
"green": 1
}
},
"plantDescription": {
"type": "TREE",
"family": "Cupressaceae (the Cypress family)",
"season": "Late winter, early spring",
"specialColors": "None",
"specialShapes": "Evergreen needle leaves. The leaves are scaly and are borne in whorls of three.",
"crossReaction": "Juniper, Cedar and other Cypress pollen. In addition, there may be a higher risk of food allergy to peach.",
"picture": "https://storage.googleapis.com/pollen-pictures/cypress_pine_full.jpg",
"pictureCloseup": "https://storage.googleapis.com/pollen-pictures/cypress_pine_closeup.jpg"
}
},
{
"code": "GRAMINALES",
"displayName": "Grasses",
"inSeason": false,
"indexInfo": {
"code": "UPI",
"displayName": "Universal Pollen Index",
"value": 1,
"category": "Very Low",
"indexDescription": "People with very high allergy to pollen are likely to experience symptoms",
"color": {
"green": 0.61960787,
"blue": 0.22745098
}
},
"plantDescription": {
"type": "GRASS",
"family": "Poaceae",
"season": "Late spring, summer",
"specialColors": "None",
"specialShapes": "The leaves are alternate, long and narrow and the leaf margin is smooth.",
"crossReaction": "Plantain (Plantago) pollen. In addition, there may be a higher risk for food allergies like melons, oranges, tomatoes, peanuts, soy, potato, and other legumes.",
"picture": "https://storage.googleapis.com/pollen-pictures/graminales_full.jpg",
"pictureCloseup": "https://storage.googleapis.com/pollen-pictures/graminales_closeup.jpg"
}
}
]
},
//... 1 more entry
]
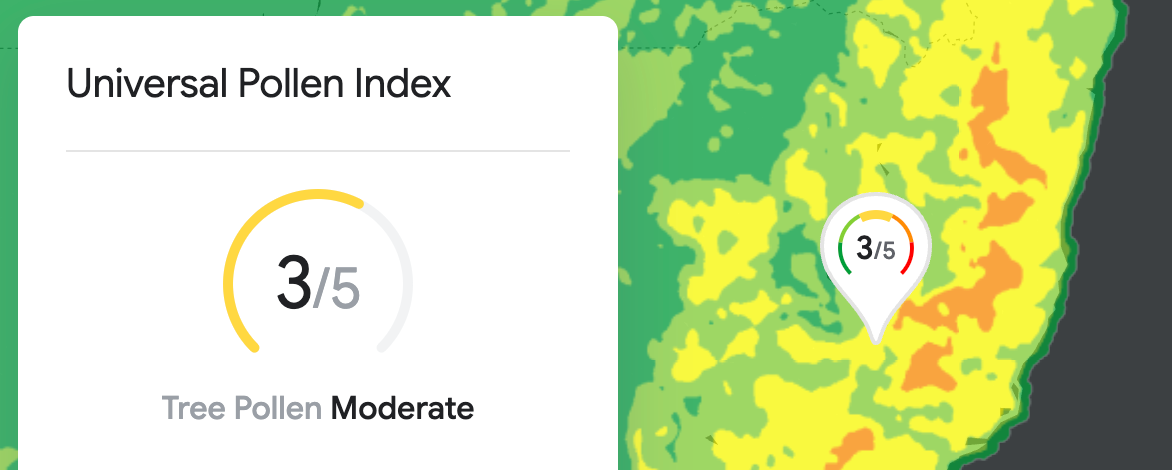
}The response is an array, dailyInfo, that contains the daily pollen forecast information for each day. Inside each dailyInfo entry:
date provides a human readable date (year, month, and day) that you can use to determine the day of the week and display in your app.
pollenTypeInfo is an array that includes up to three pollen types ("GRASS", "WEED", "TREE") that affects the location specified in the request. The indexInfo object inside pollenTypeInfo contains the Universal Pollen Index (UPI) data for the specified pollen type.
{
    "code": "TREE",
    "displayName": "Tree",
    "inSeason": true,
    "indexInfo": {
        "code": "UPI",
        "displayName": "Universal Pollen Index",
        "value": 3,
        "category": "Moderate",
        "indexDescription": "People with allergy to pollen are likely to experience symptoms",
        "color": {
            "red": 1,
            "green": 1
        }
    },
    "healthRecommendations": [
        "It's important to shower and wash your hair after spending a lot of time outdoors.",
        "When spending time outside, use sunglasses and a cap to keep pollen out of your face and eyes.",
        "Wash clothes worn outdoors to remove any remnants of pollen grains.",
        "If possible, wear glasses instead of contact lenses.",
        "Did you hang any laundry outside? Now is a good time to hang clothes indoors or use a dryer if possible."
    ]
}
For example, for the "TREE" pollen type, the API returns the UPI value (3), category ("Moderate") and an indexDescription ("People with allergy to pollen are likely to experience symptoms"). It also includes healthRecommendations, a list of helpful tips and health insights based on the given pollen levels e.g. "It's important to shower and wash your hair after spending a lot of time outdoors.".
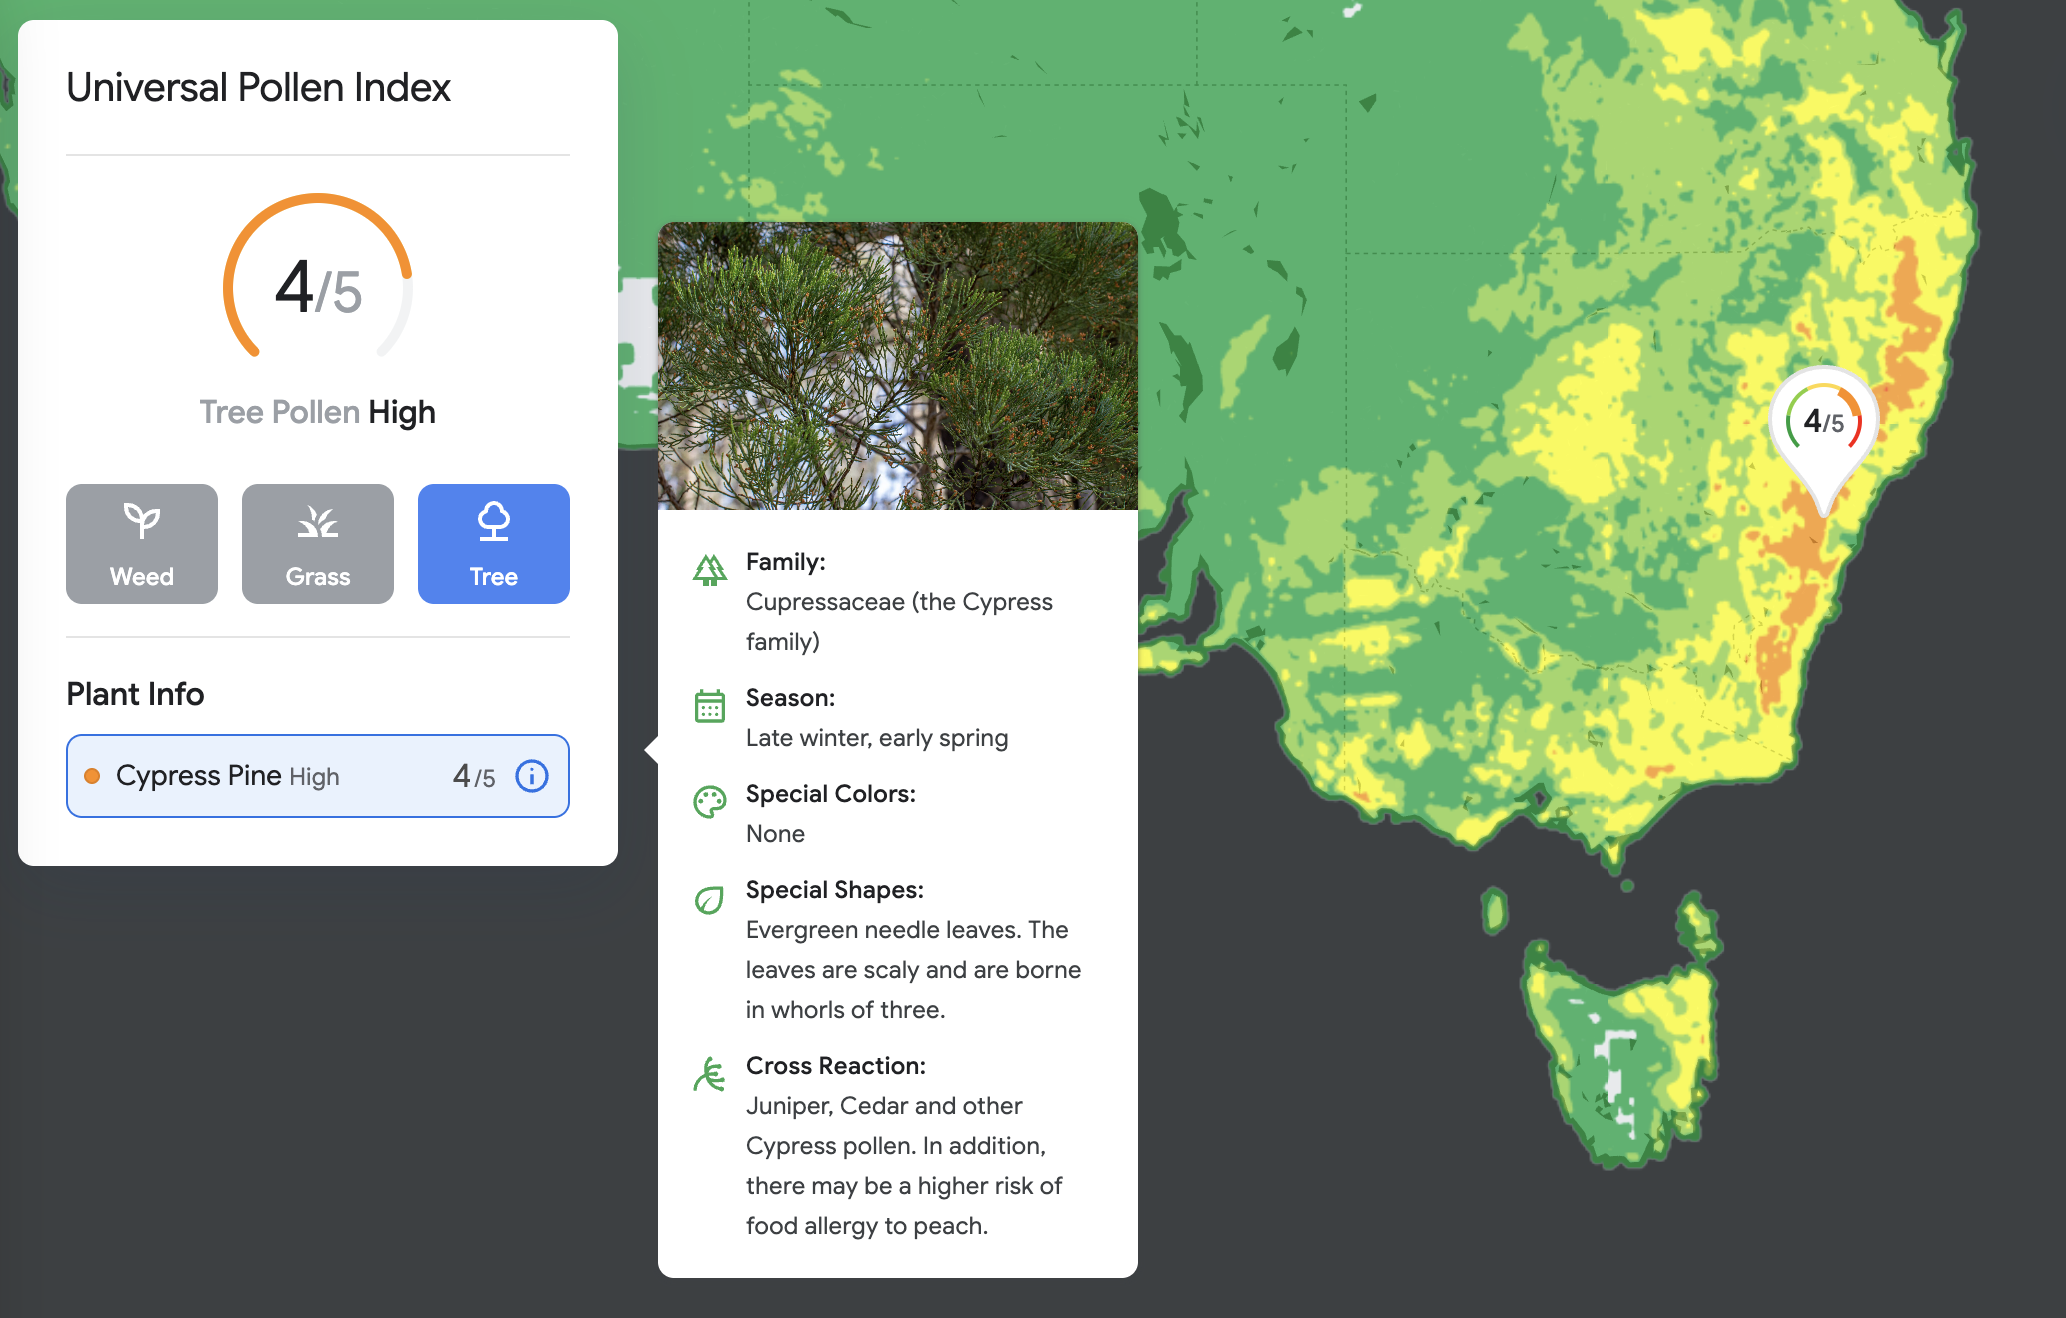
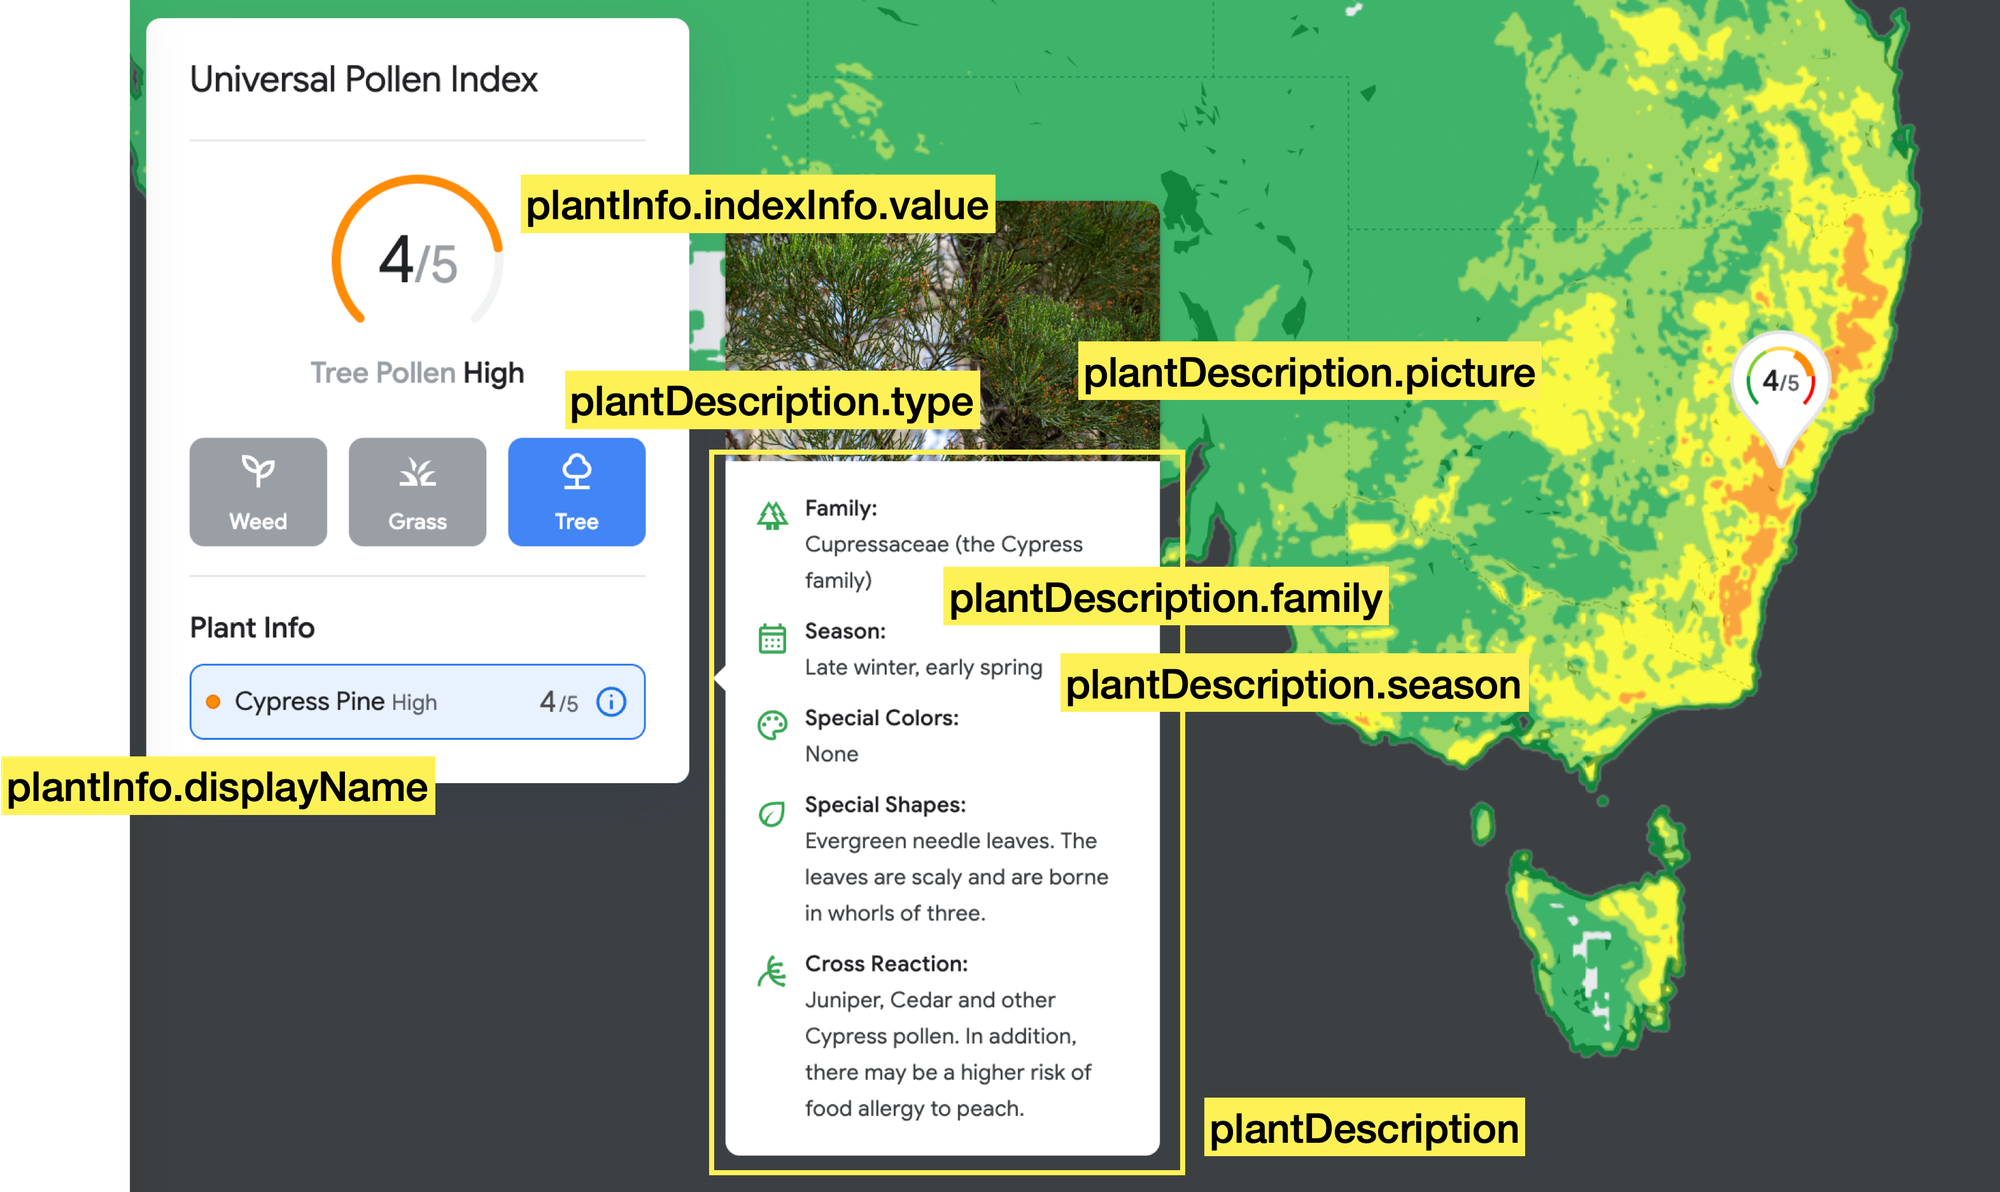
The last piece of information included in dailyInfo is the plantInfo array, which provides detailed information about the specific pollen producing plant species currently active.
{
    "code": "CYPRESS_PINE",
    "displayName": "Cypress Pine",
    "inSeason": true,
    "indexInfo": {
        "code": "UPI",
        "displayName": "Universal Pollen Index",
        "value": 3,
        "category": "Moderate",
        "indexDescription": "People with allergy to pollen are likely to experience symptoms",
        "color": {
            "red": 1,
            "green": 1
        }
    },
    "plantDescription": {
        "type": "TREE",
        "family": "Cupressaceae (the Cypress family)",
        "season": "Late winter, early spring",
        "specialColors": "None",
        "specialShapes": "Evergreen needle leaves. The leaves are scaly and are borne in whorls of three.",
        "crossReaction": "Juniper, Cedar and other Cypress pollen. In addition, there may be a higher risk of food allergy to peach.",
        "picture": "https://storage.googleapis.com/pollen-pictures/cypress_pine_full.jpg",
        "pictureCloseup": "https://storage.googleapis.com/pollen-pictures/cypress_pine_closeup.jpg"
    }
}
plantInfo gives the displayName ("Cypress Pine"), the UPI value (3) attributable to that plant species, a detailed plantDescription with picture and pictureCloseup fields that you can use to display images of the plant in your app.
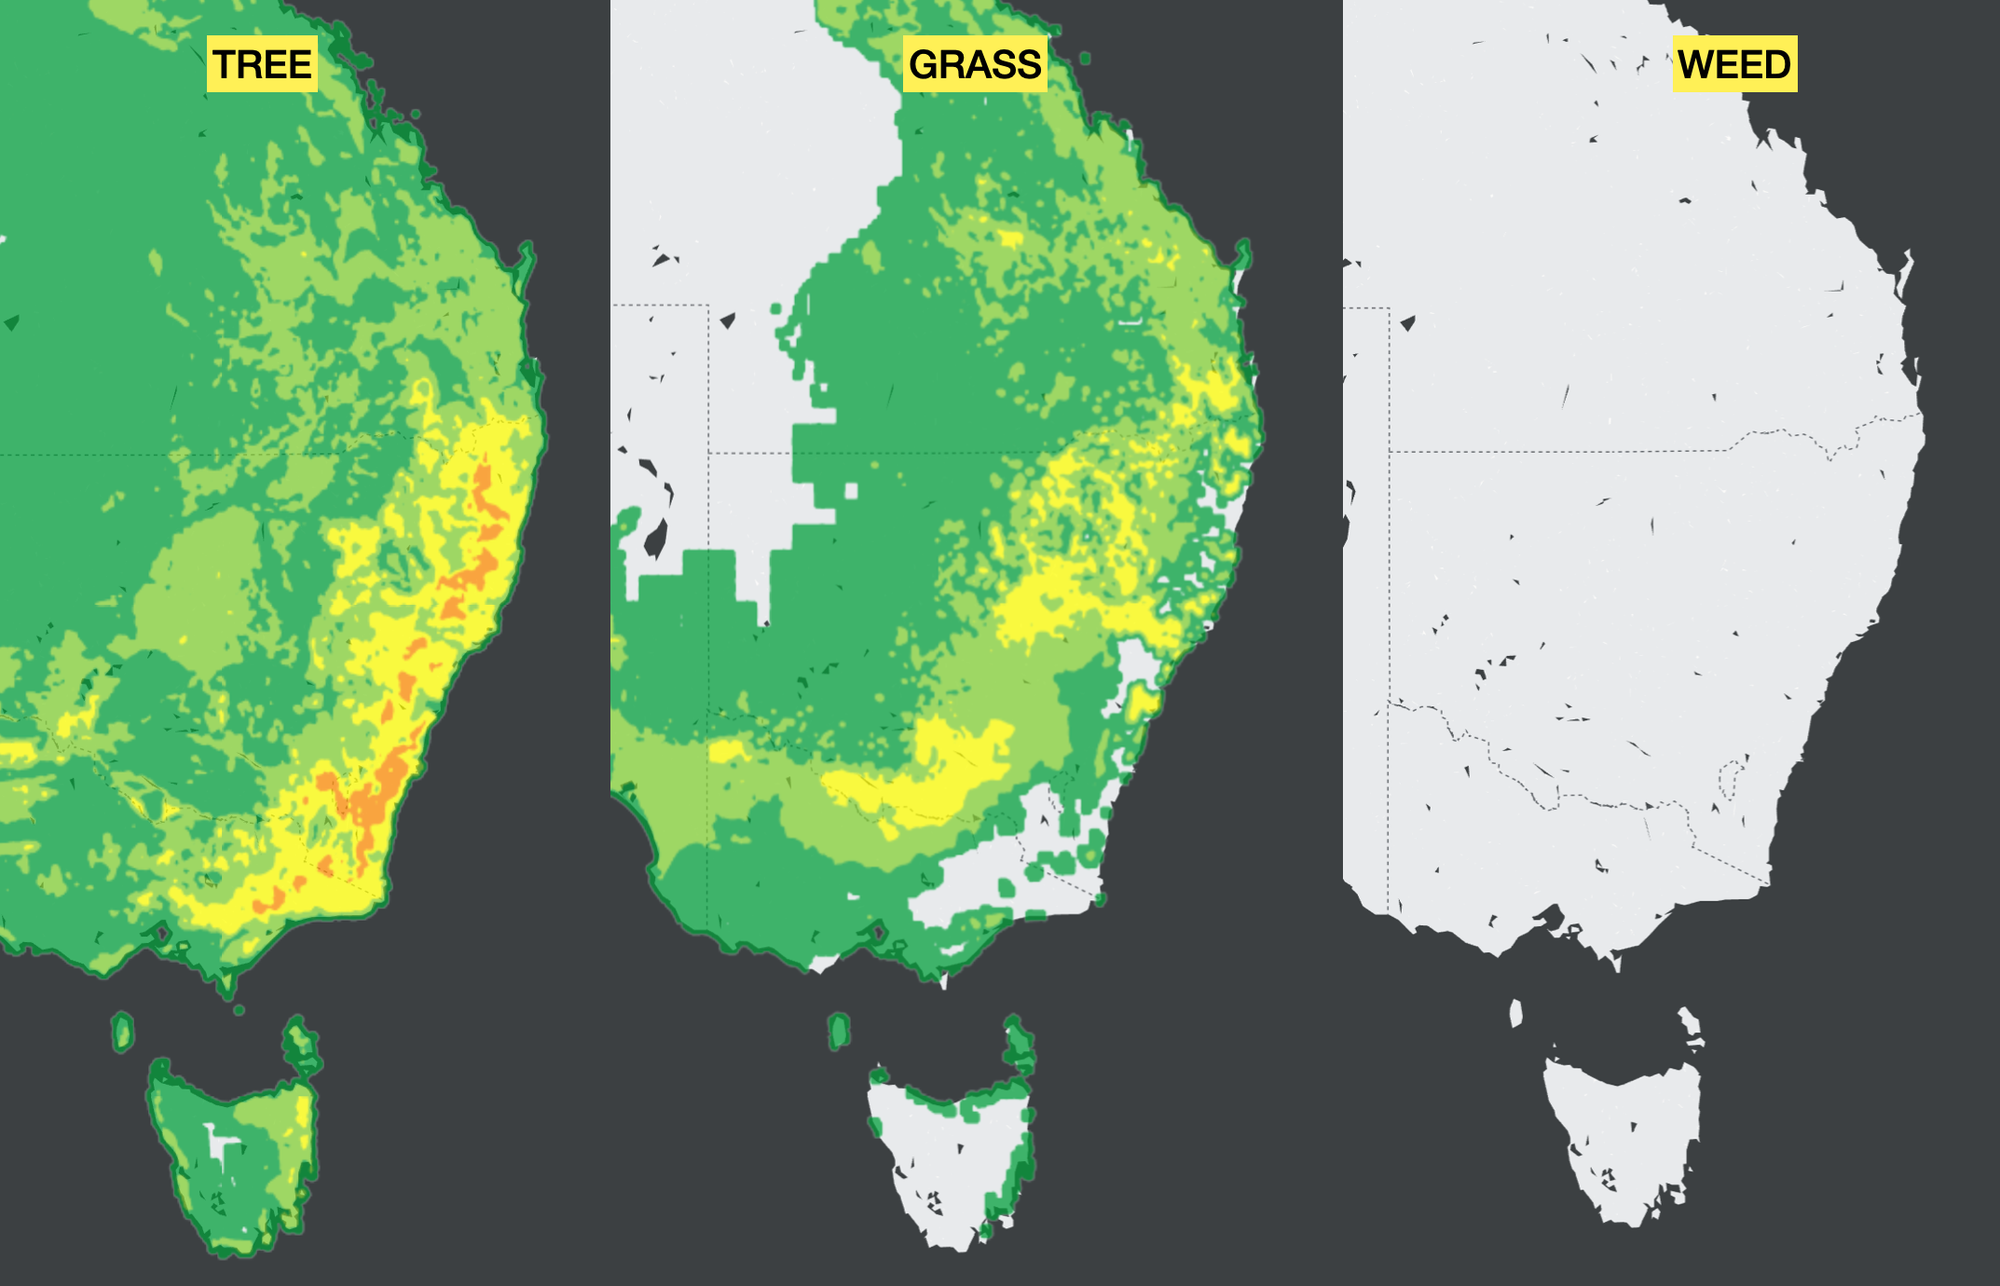
Heatmap Tiles
The Heatmap Tiles endpoint returns a collection of pollen index image tiles that can be displayed on a Google Map.
Endpoint GET https://pollen.googleapis.com/v1/mapTypes/{mapType}/heatmapTiles/{zoom}/{x}/{y}?key={YOUR_API_KEY}
{YOUR_API_KEY} is your Google Maps API key with the Pollen API enabled.
{mapType} is the type of the pollen heatmap to display. Choose one of "TREE_UPI", "GRASS_UPI" and "WEED_UPI".
{zoom} is the zoom level that determines how large or small the contents of a map appear in a map view. Allowed values are 0-16, where a value of 0 displays the entire world in a single tile.
{x} and {y} are the coordinates of the tile to retrieve, relative to the north west corner (0,0). {x} values are increasing from west to east and {y} values are increasing from north to south.
Endpoint: GET
https://pollen.googleapis.com/v1/mapTypes/TREE_UPI/heatmapTiles/2/3/2?key={YOUR_API_KEY}
Response
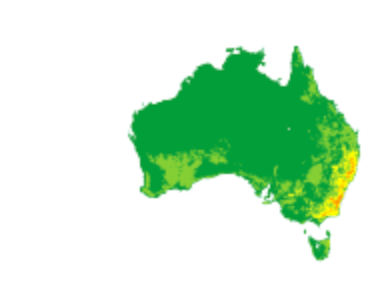
The tile appears as a .png image that can be used as a Google Map custom overlay. Here's a simple example of how to do this using basic Javascript and HTML.
<!DOCTYPE html>
<html>
  <head>
    <title>Google Pollen API Heatmap Overlay</title>
    <meta charset="utf-8" />
    <style>
      html, body, #map {
        height: 100%;
        margin: 0;
        padding: 0;
      }
    </style>
    <script>
      function initMap() {
        const center = { lat: -33.8688, lng: 151.2093 }; // Sydney

        const map = new google.maps.Map(document.getElementById("map"), {
          zoom: 8,
          center,
          mapTypeId: "roadmap"
        });

        // Pollen tile overlay (tree, grass, or weed)
        const mapType = "tree_pollen"; // or grass_pollen / weed_pollen
        const tileSize = 256;

        const pollenTiles = new google.maps.ImageMapType({
          getTileUrl: function (coord, zoom) {
            return `https://pollen.googleapis.com/v1/mapTypes/${mapType}/heatmapTiles/${zoom}/${coord.x}/${coord.y}?key=YOUR_API_KEY`;
          },
          tileSize: new google.maps.Size(tileSize, tileSize),
          name: "Pollen",
          maxZoom: 15,
          minZoom: 4,
          opacity: 0.6
        });

        map.overlayMapTypes.insertAt(0, pollenTiles);
      }
    </script>

    <script async
      src="https://maps.googleapis.com/maps/api/js?key=YOUR_API_KEY&callback=initMap">
    </script>
  </head>
  <body>
    <div id="map"></div>
  </body>
</html>
Just remember to add your API key and change ${mapType} to one of "TREE_UPI", "GRASS_UPI" or "WEED_UPI" and ${zoom} to your desired zoom level.
Google Pollen API use cases
Although not as well known as some of the more popular Google Maps APIs such as the Geocoding API and the Routes API, the Pollen API has its niche, especially in industries related to health and the environment. Here are some key use cases where the Pollen API has proven valuable:
- Air filtration systems. Many "smart" (internet connected) air filtration devices, air purifiers and HVAC systems these days don't have on-device sensors. Instead, they rely on web services such as the Google Air Quality API and the Pollen API to detect changes in pollution levels so that different settings can automatically be applied. A smart air purifier could use the Pollen API to switch to a HEPA filter whenever pollen levels in the area exceed a preset level, like in Tesla's new Bioweapon Defense Mode.
- Advertising. Allergy medication is a $22.8 bil market. This includes popular antihistamines such as Claritin and Benadryl as well as nasal sprays, nasals sprays and decongestants. But allergy medications are typically only purchased during early spring and late fall, when pollen levels peak. A smart pharmaceutical company could use the Pollen API to time hyperlocal advertising to reach allergy sufferers right when pollen levels are at their highest, thereby maximizing the impact of their advertising spend. See Live pollen count billboards to help hay fever sufferers for a real world example of this.
- Travel. An online travel agency such as Trip.com or Booking.com could use the Pollen API to show pollen forecasts for destinations during a hotel search or trip booking e.g. by adding a "pollen risk" badge to destination results. They could even recommend hotels with air purifiers, filtered air systems, or sealed windows during high pollen days.
To get started with the Google Air Quality API, begin by creating a project in the Google Cloud Console. Then, navigate to APIs & Services, search for "Pollen," and select the Pollen API from the results. Click [Enable] to activate it for your project.
Google Pollen API pricing
The Pollen API is considered a premium "pro" product, and pricing starts at $10.00 CPM (cost per thousand), double the $5.00 CPM cost of Air Quality API. There's a free usage cap of 5,000 API calls per month and past that, calls are billed on a tiered basis.
| 0 - 5,000 | 5,000 - 100k | 100k - 500k | 500k - 1M | 1M - 5M | 5M+ | |
|---|---|---|---|---|---|---|
| Air Quality API | FREE | $10.00 | $8.00 | $6.00 | $4.00 | $1.00 |
As with other Google Maps services, working with a Google Maps Partner can provide access to discounted pricing at higher volumes.
Last thoughts on the Google Pollen API
With its 2022 acquisition of environmental intelligence company Breezometer, Google Maps moved beyond just navigation. The platform introduced a new environment category that integrated BreezoMeter’s high resolution weather, solar, pollen, and air quality data directly into the core Google Maps Platform APIs. The acquisition fit Google Map's mission of providing helpful, contextual information and gave it a way to offer consumer friendly APIs to power smart devices, wearables, and health/lifestyle apps.
However, Google Maps now faces a key challenge: growing this new category without letting it fade into the background. BreezoMeter was a standout company and laser focused on its niche. It was highly effective at selling its APIs to major global brands like Dyson, Tesla, L'Oréal, Pfizer, and Apple. As a small company, every deal mattered, and BreezoMeter built a repeatable, niche-driven sales strategy around that focus.
In contrast, Google is massive and already generates billions in revenue from its core APIs like Routes, Geocoding, and Places. For a Google salesperson, it’s a tough pitch to push a newer, less proven API like the Pollen API when Google's established products can make him more money with less effort.
So what should Google do? If Google believes that Maps revenue has peaked, and that as a leader in a mature market there's limited room for growth, it should consider incentivizing a small group of sales reps solely based on Environment API adoption. This would help drive incremental revenue from a new and potentially meaningful product category like the Pollen or Air Quality APIs.
On the other hand, if Google sees continued growth potential in Google Maps, especially with the rising demand for combining AI and geospatial data (e.g. the new Grounding with Google Maps is now available in Vertex AI), then assigning dedicated sales reps to niche APIs would be a waste of resources. In that case, it would make more sense to let sales teams focus on whatever products generate the most revenue - and if Environment APIs are part of those deals, great, but they shouldn't be the priority.
👋 As always, if you have any questions or suggestions for me, please reach out or say hello on LinkedIn.