Cloud based map styling for Google Maps
How to customize Google Maps with cloud based map styling. No code, instant updates, and access to modern map features.

Cloud based map styling is the newest way to customize a Google Map, and lets you style landscapes, water, urban areas, and point of interest (POI) labels without writing any code. In this blog post, we'll cover what cloud based map styling is and why you'd use it, then put it into practice by styling a Google Map with a Monet inspired color palette.
Part 1: Style a Google Map any way you want
Part 2: Apply styles for Google Maps using JSON style arrays
Part 3: Cloud based map styling for Google Maps (this article)
Part 4: Google Maps data driven styling for boundaries
Part 5: Create a heatmap in Google Maps with data driven styling
Part 6: Upload and style datasets using the Maps Datasets API
Part 7: Add data to Google Maps with data driven styling
What is Google Maps cloud based map styling?
Cloud based map styling is Google's preferred way to change how a Google Map looks. You build your style in a visual editor in the Google Cloud Console, save it under a Map ID, and reference that ID in your code. The style itself lives in the cloud, not in your codebase, so you can update it without redeploying
Why did Google Maps launch cloud based map styling?
If JSON style arrays were so popular and easy to use, why did Google push users to adopt cloud based map styling in the first place? Three main reasons come to mind:
- Update styles without redeploying code. With JSON arrays, changing your map's look means editing the array in your codebase, committing, building, and redeploying. With cloud based styling, you edit the style in the Cloud Console and the change goes live immediately on every app using that Map ID (both web and mobile). No code changes needed.
- Alignment with the Google Maps Platform roadmap. JSON arrays are walled off from most of what Google has built in the last several years. This includes data driven styling, vector maps, Web GL overlays (for heat maps and 3D overlays) and Advanced Markers, all of which require a Map ID.
- More styles and better control over them. Cloud based styling exposes nearly 100 individual map features across four categories and lets users fine tune POI density and visibility.
There's a fourth, unspoken reason: competition from Mapbox. For nearly a decade (2015–2022), Mapbox built a reputation as a developer-friendly alternative to Google Maps that was both less expensive and easier to style. Their Mapbox Studio product was the gold standard for no-code map styling, and Google had no real answer until cloud based map styling launched in 2022.
Setting up your first styled map with Google cloud based map styling
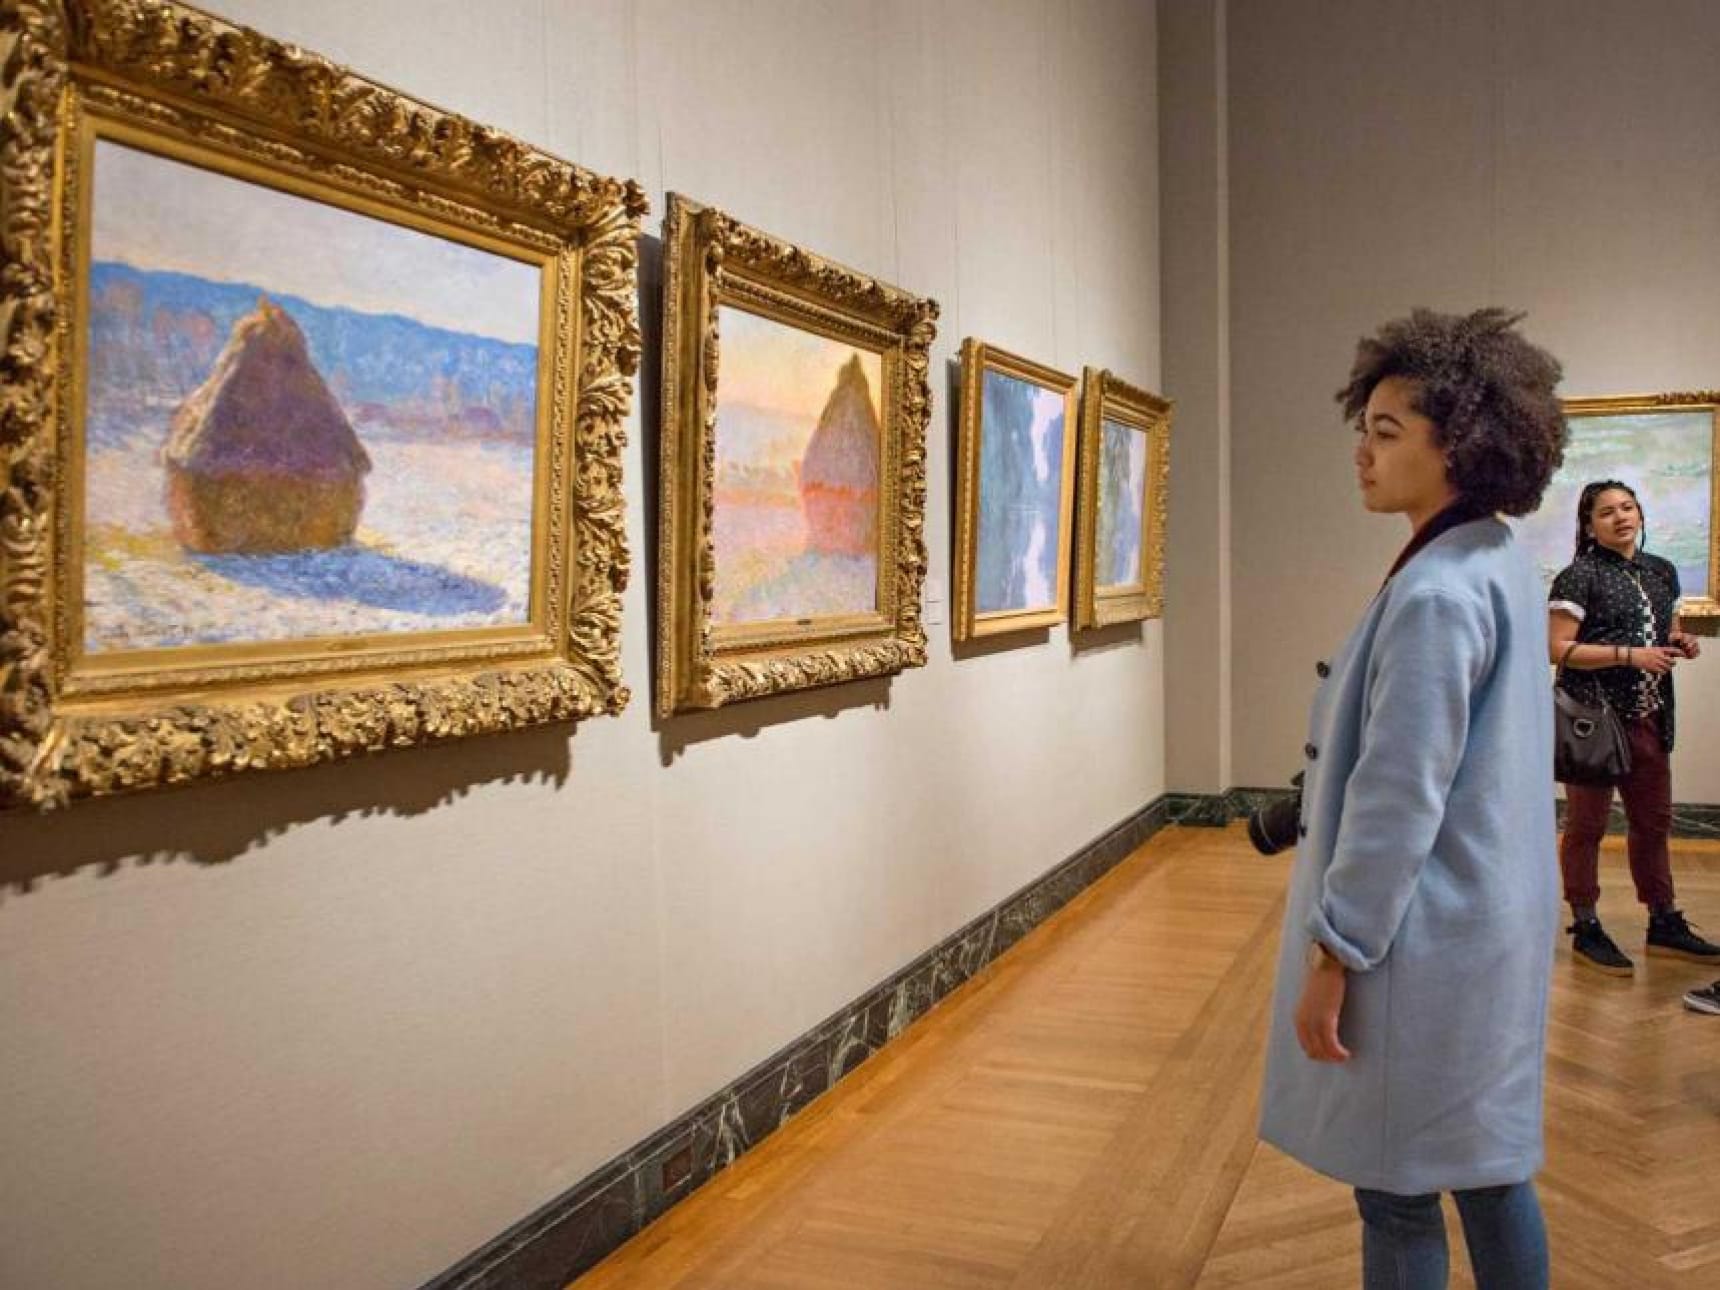
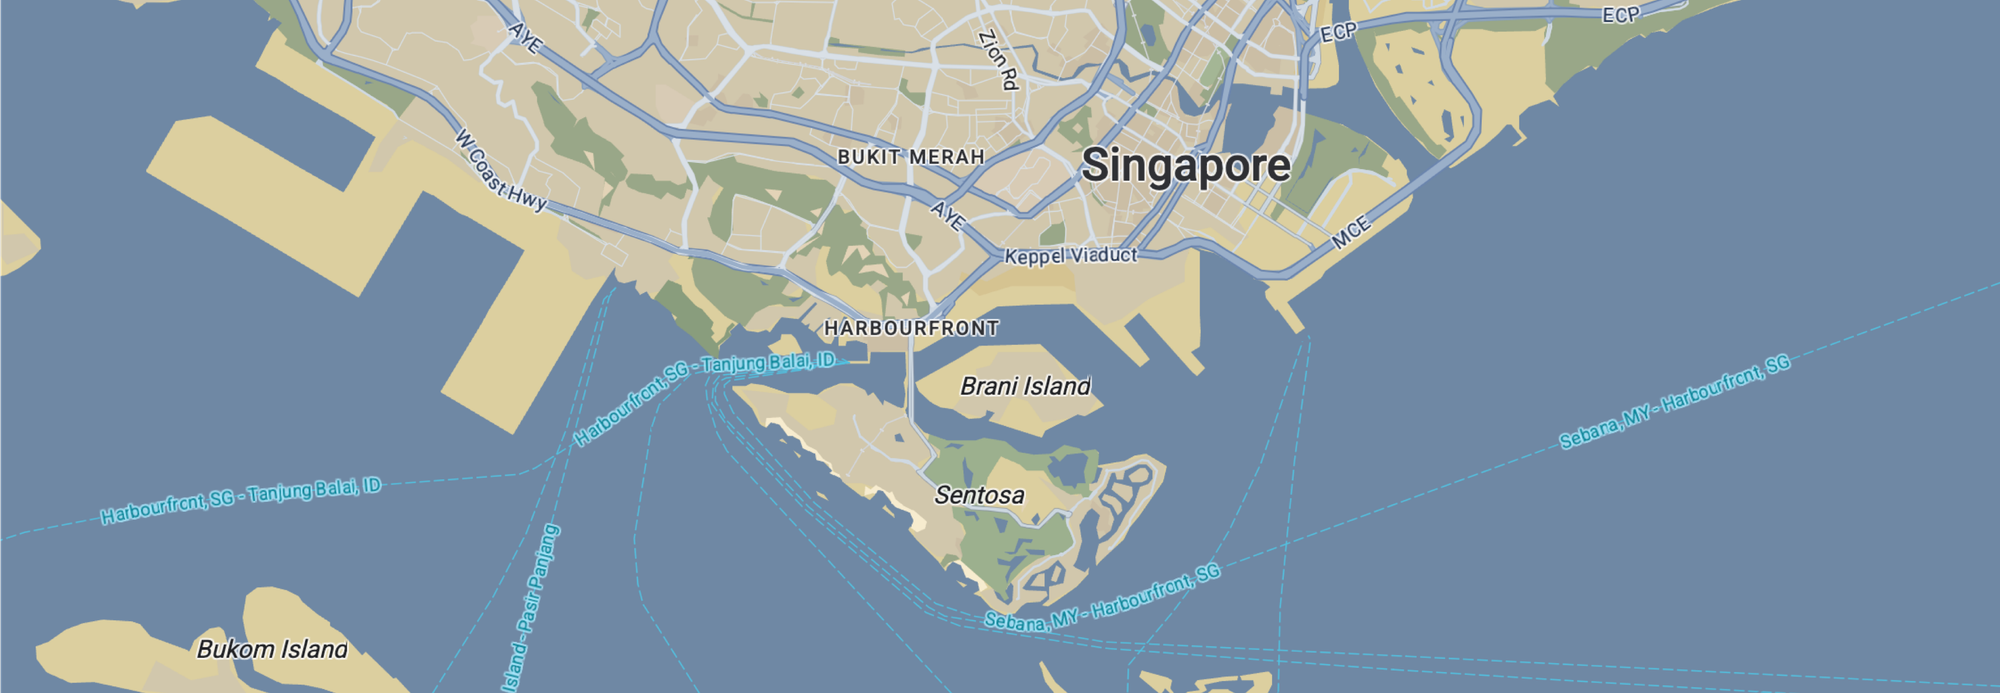
When I lived in Boston, my favorite art gallery was the Museum of Fine Arts, which houses one of the largest collections of Claude Monet paintings outside France. The Impressionist painted plenty of subjects - water lilies, irises, sunflowers and cathedrals but my favorite was always his haystacks in the French countryside. So in this first example, we'll style a Google Map using the color palette from Monet's Grainstacks, in Bright Sunlight (1890).
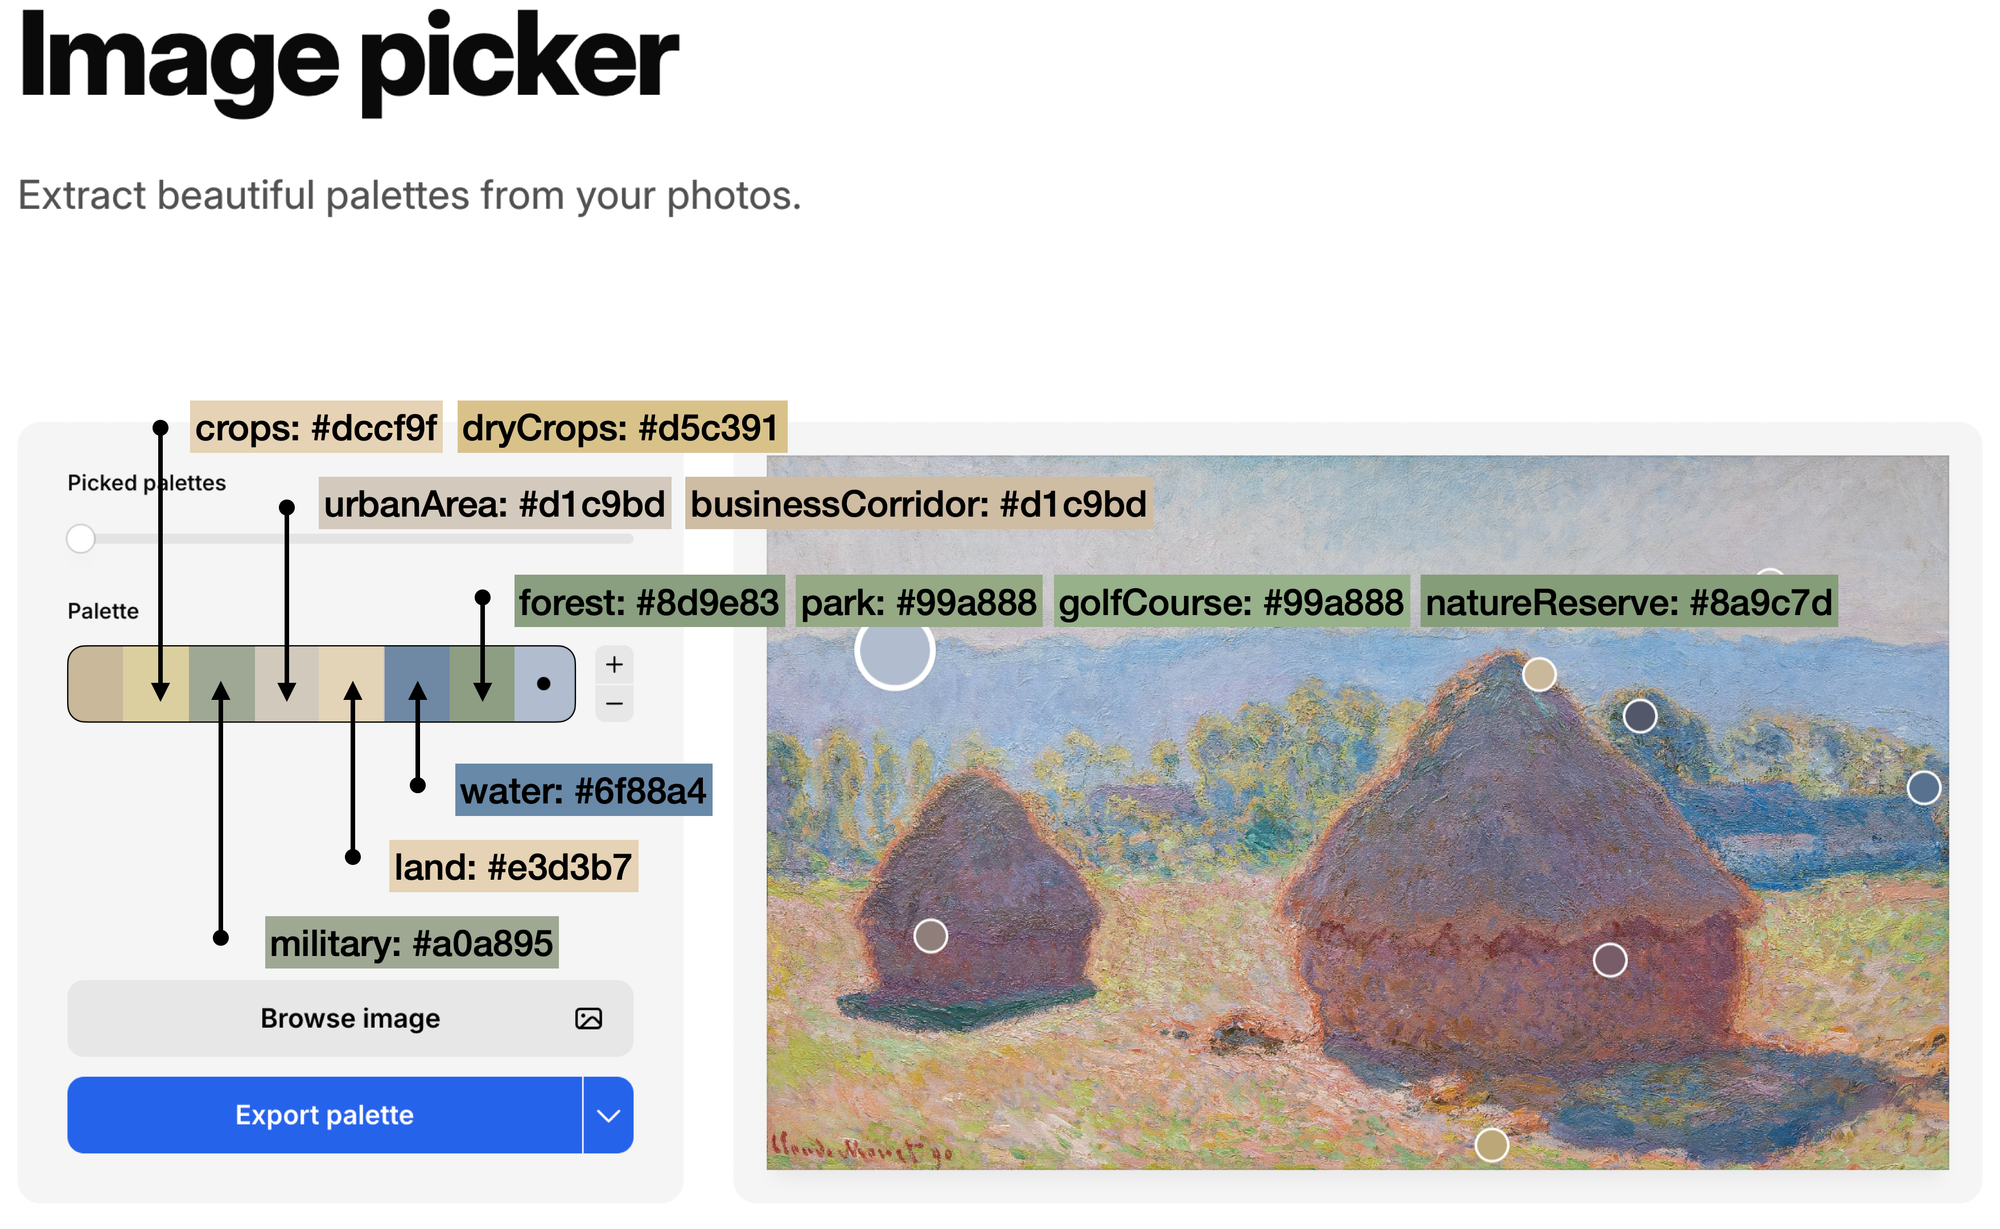
To get our map colors, we'll use the image picker tool at coolors.co, a popular free color palette generator. First, upload a digital copy of Grainstacks (get a copy here) to the palette generator app at https://coolors.co/image-picker. The app analyzes the image and suggests a palette based on its most representative colors. We'll use these to style our map. Browns for land, greens for forests, and blues for water.
?ref=blog.afi.io#/media/File:Claude_Monet_-_Grainstacks_in_Bright_Sunlight_(1890)_Google_Art_Project.jpg)
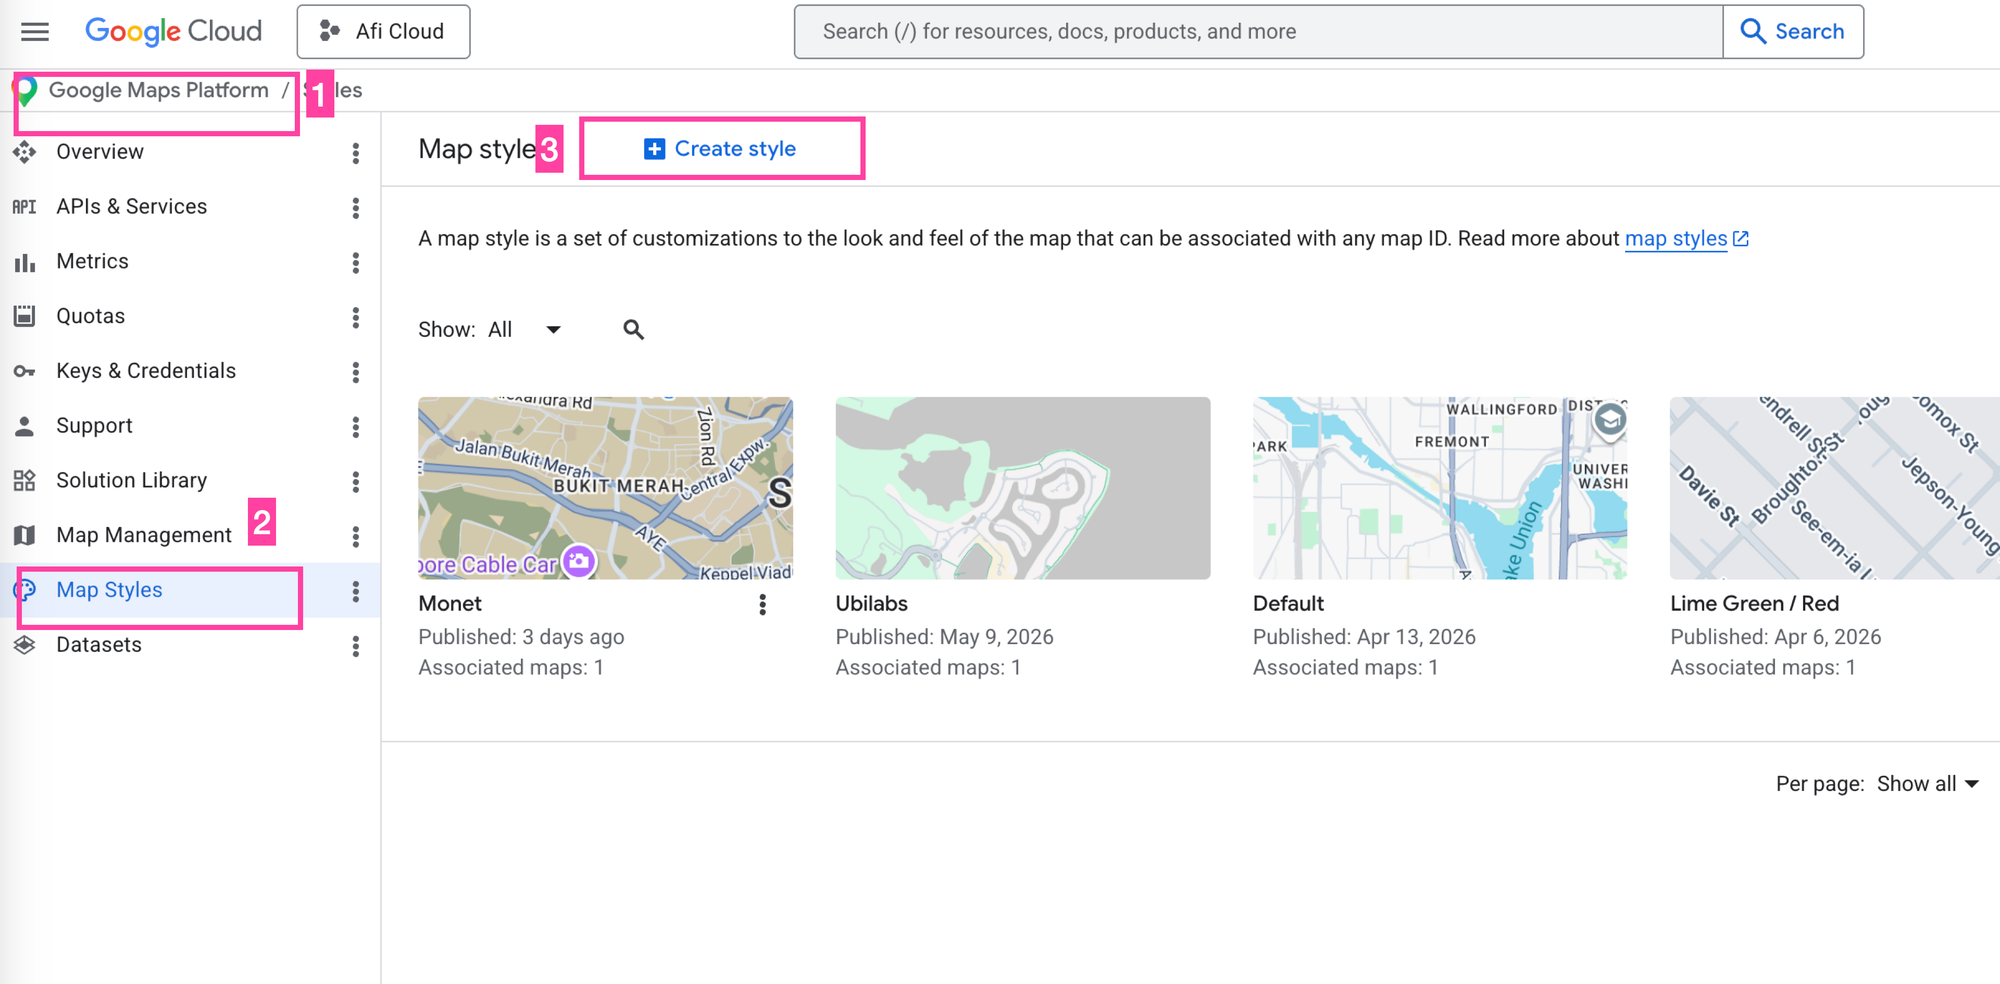
Second, log into your Google Cloud Console, choose a Project and select [Google Maps Platform], [Map Styles] and click on [+ Create Style].
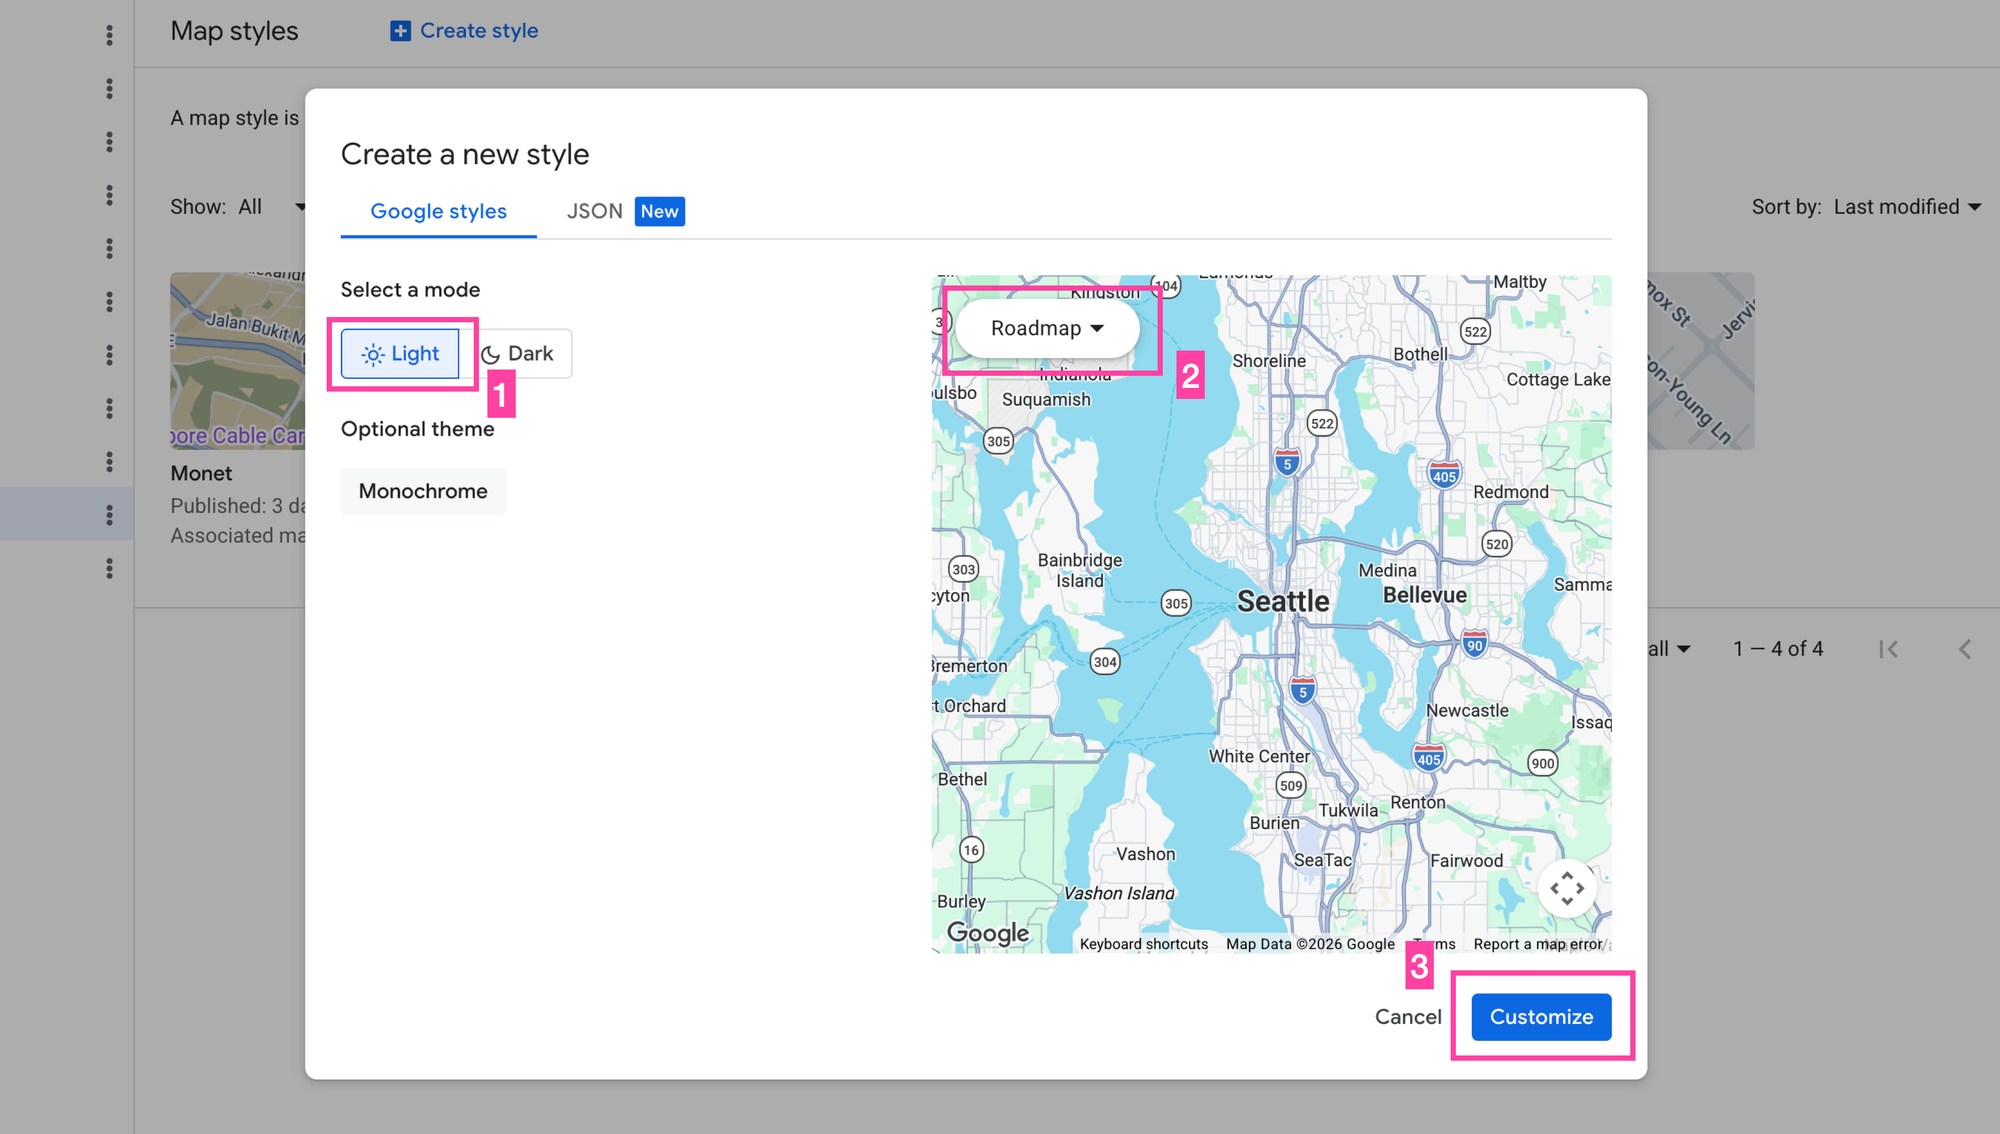
Third, when the Create a new style dialog box pops up choose [Light] mode on a [Roadmap] base map. Click [Customize].
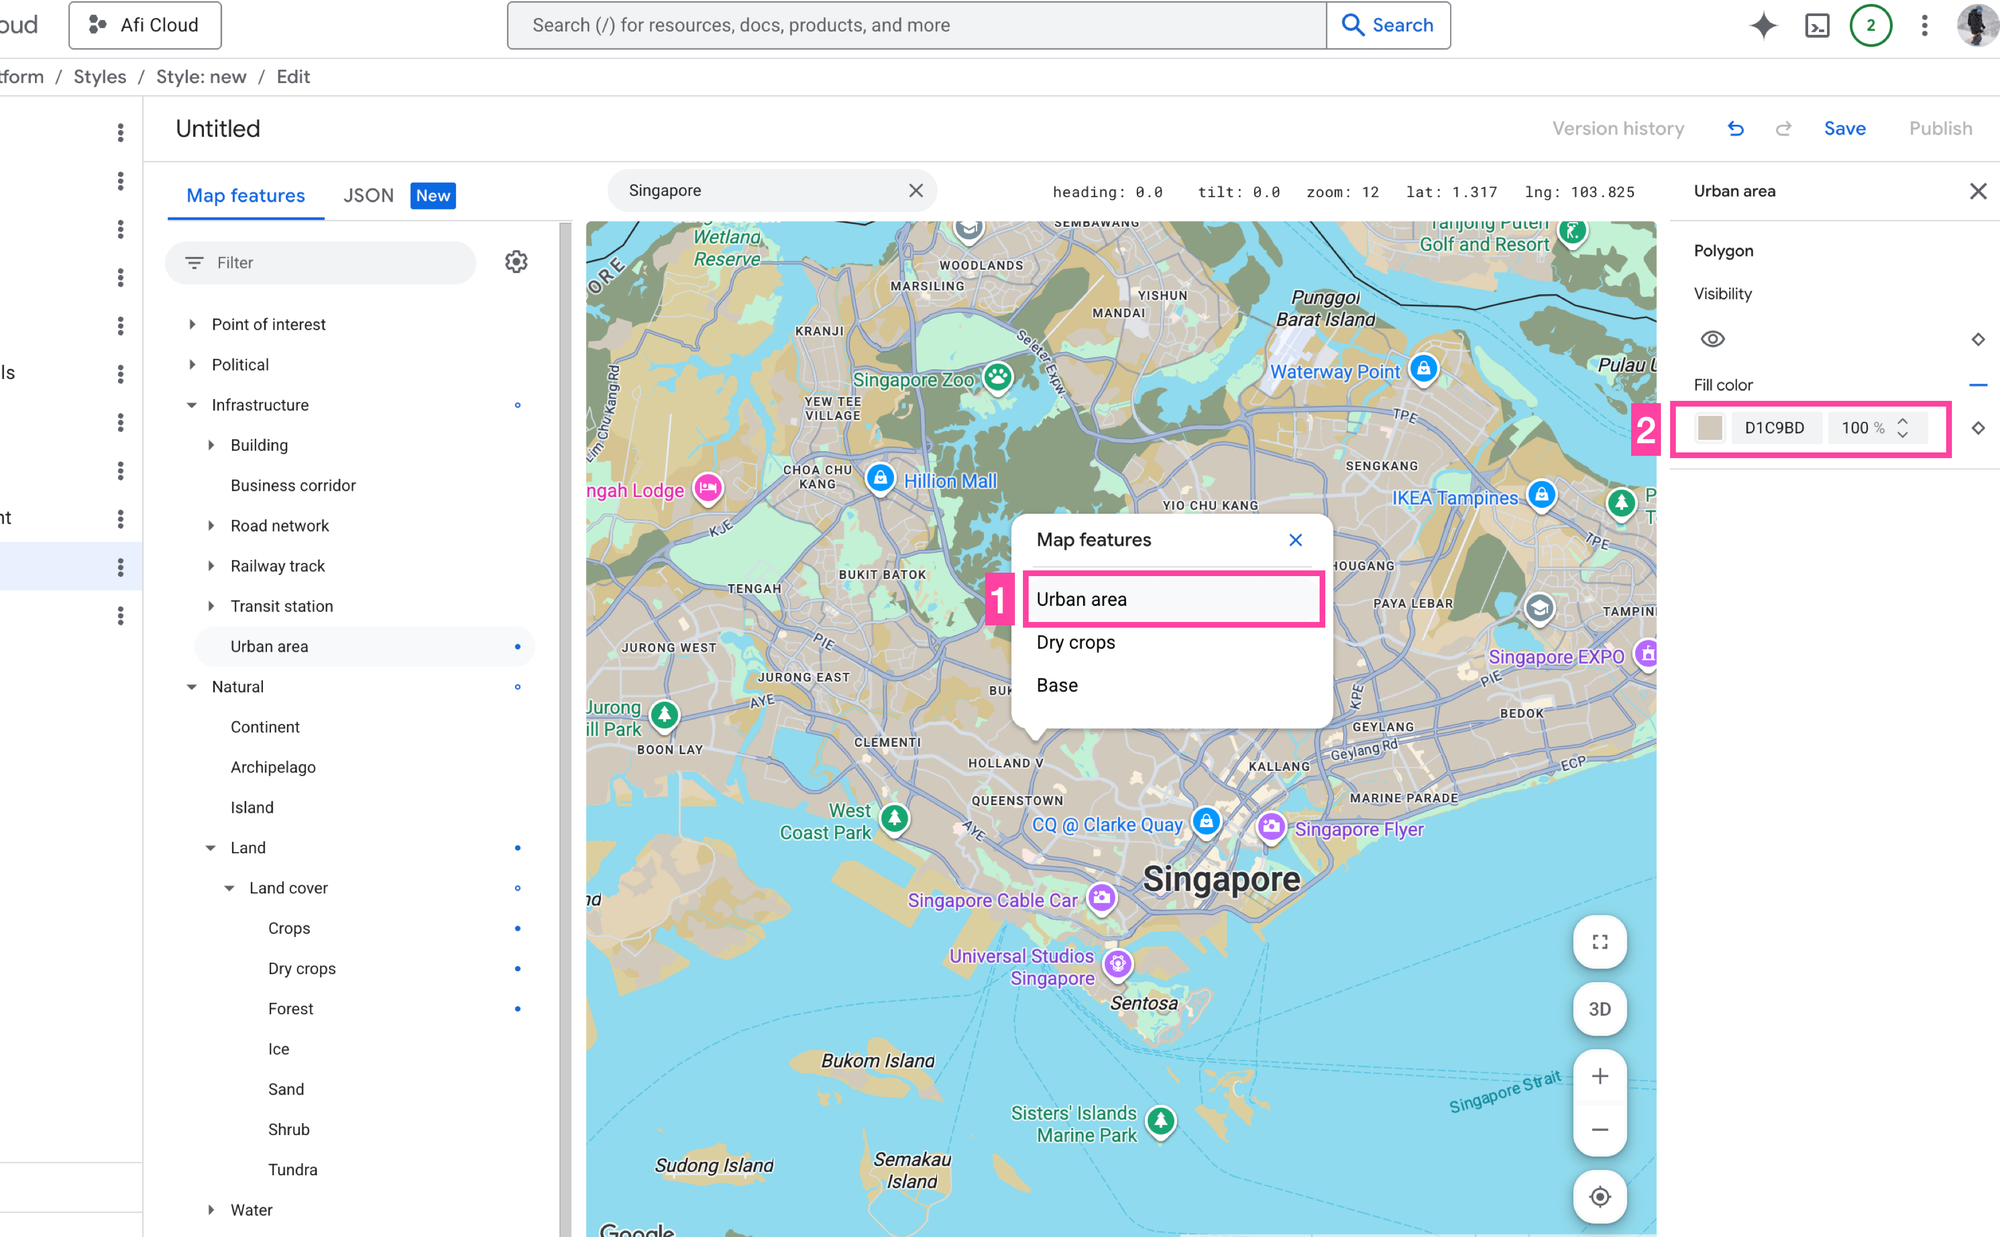
To style the map, click anywhere on it and choose the first map feature that appears in the popup window. In the example below, its urban area, which Google Maps uses to designate the built environment. Select it, and enter #d1c9bd as the fill color.
Repeat this for the remaining color hex codes that the palette generator extracted from the Monet painting.
crops: #dccf9f, dryCrops: #d5c391, urbanArea: #d1c9bd, businessCorridor: #d1c9bd, forest: #8d9e83, park: #99a888, golfCourse: #99a888, natureReserve: #8a9c7d, water: #6f88a4, land: #e3d3b7, military: #a0a895.
Alternatively, copy and paste the following JSON into the JSON editor tab. Note: JSON styles generated by cloud based styling are not compatible with the JSON format used in the styles array.
{
"variant": "light",
"styles": [
{
"id": "infrastructure.businessCorridor",
"geometry": {
"fillOpacity": 1,
"fillColor": "#cbbda6"
}
},
{
"id": "infrastructure.urbanArea",
"geometry": {
"fillOpacity": 1,
"fillColor": "#d1c7ac"
}
},
{
"id": "natural.base",
"geometry": {
"visible": false,
"fillOpacity": 1,
"fillColor": "#c8ae8c"
}
},
{
"id": "natural.land",
"geometry": {
"visible": true,
"fillOpacity": 1,
"fillColor": "#e3d3b7"
}
},
{
"id": "natural.land.landCover",
"geometry": {
"fillOpacity": 1,
"fillColor": "#d4c5a6"
}
},
{
"id": "natural.land.landCover.crops",
"geometry": {
"fillOpacity": 1,
"fillColor": "#dccf9f"
}
},
{
"id": "natural.land.landCover.dryCrops",
"geometry": {
"fillOpacity": 1,
"fillColor": "#d5c391"
}
},
{
"id": "natural.land.landCover.forest",
"geometry": {
"fillOpacity": 1,
"fillColor": "#8d9e83"
}
},
{
"id": "natural.land.landCover.sand",
"geometry": {
"fillOpacity": 1,
"fillColor": "#e8dce6"
}
},
{
"id": "natural.water",
"geometry": {
"fillOpacity": 1,
"fillColor": "#6f88a4"
}
},
{
"id": "pointOfInterest.emergency.hospital",
"geometry": {
"fillOpacity": 1,
"fillColor": "#d8cbb5"
}
},
{
"id": "pointOfInterest.landmark",
"label": {
"visible": false
}
},
{
"id": "pointOfInterest.other.cemetery",
"geometry": {
"fillOpacity": 1,
"fillColor": "#b8c0a8"
}
},
{
"id": "pointOfInterest.other.military",
"geometry": {
"fillOpacity": 1,
"fillColor": "#a0a895"
}
},
{
"id": "pointOfInterest.recreation.beach",
"label": {
"visible": false
}
},
{
"id": "pointOfInterest.recreation.golfCourse",
"geometry": {
"fillOpacity": 1,
"fillColor": "#9cb08e"
}
},
{
"id": "pointOfInterest.recreation.natureReserve",
"geometry": {
"fillOpacity": 1,
"fillColor": "#8a9c7d"
}
},
{
"id": "pointOfInterest.recreation.park",
"geometry": {
"fillOpacity": 1,
"fillColor": "#99a888"
}
},
{
"id": "pointOfInterest.recreation.sportsComplex",
"geometry": {
"fillOpacity": 1,
"fillColor": "#a4b595"
}
},
{
"id": "pointOfInterest.recreation.sportsField",
"geometry": {
"fillOpacity": 1,
"fillColor": "#b5c2a5"
}
},
{
"id": "pointOfInterest.recreation.zoo",
"geometry": {
"fillOpacity": 1,
"fillColor": "#a8b598"
}
},
{
"id": "pointOfInterest.transit.airport",
"geometry": {
"fillOpacity": 1,
"fillColor": "#c8c0b0"
}
},
{
"id": "political.reservation",
"geometry": {
"fillOpacity": 0.3,
"fillColor": "#c8b9d6"
}
}
]
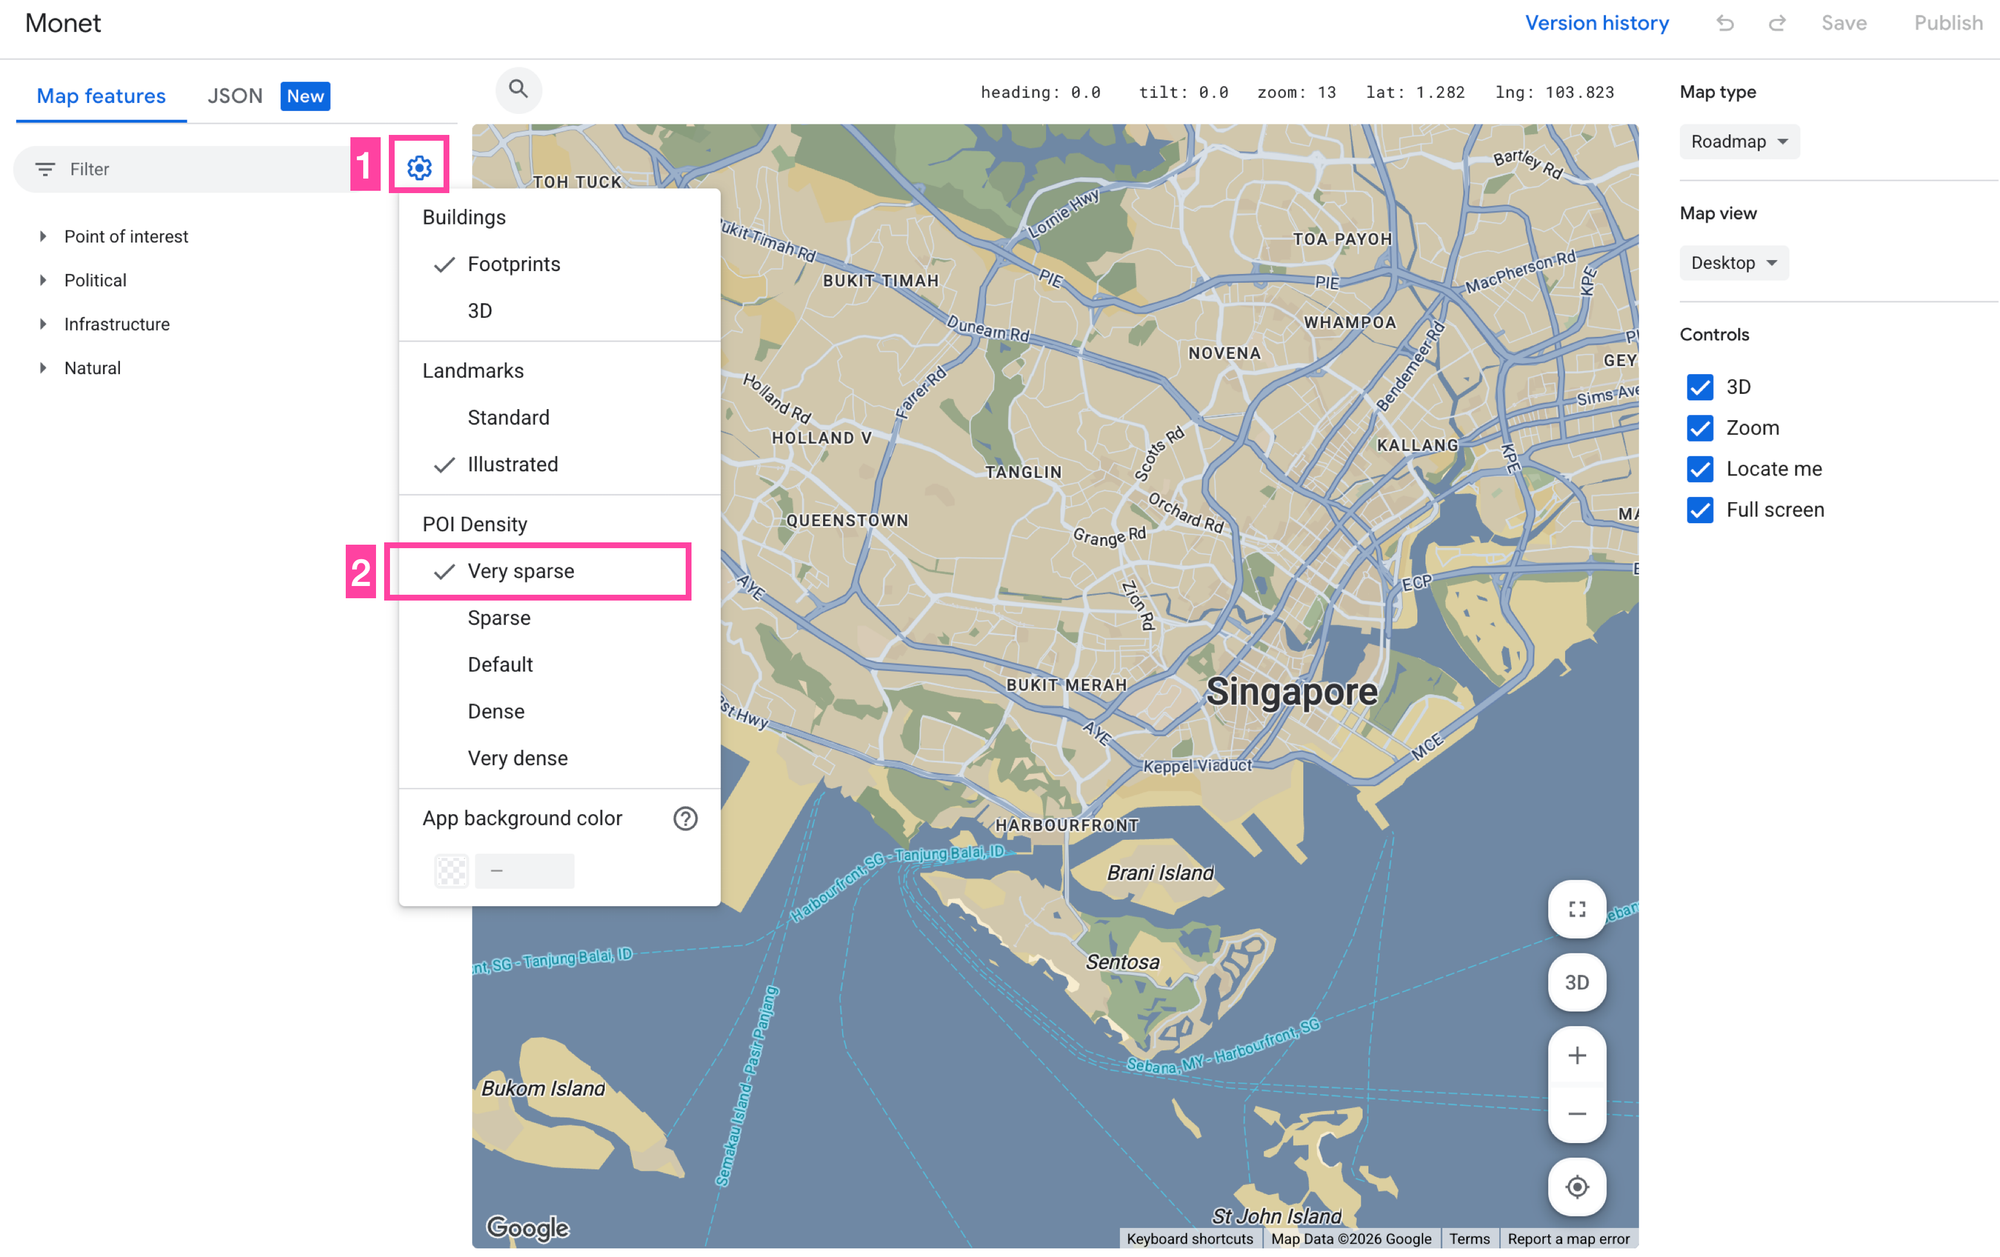
}One feature that's exclusive to cloud based map styling is POI density control. It's a genuinely useful way to reduce map clutter that JSON style arrays simply can't do. Click the [⚙️] icon on the left and pick a POI density level. The preview updates instantly as you change it.
Lastly, click the [Save] button in the top right hand corner and give your style an easy to remember name and description.
But we aren't done just yet. Now we need to create a Map ID and associate that map with the style we just created.
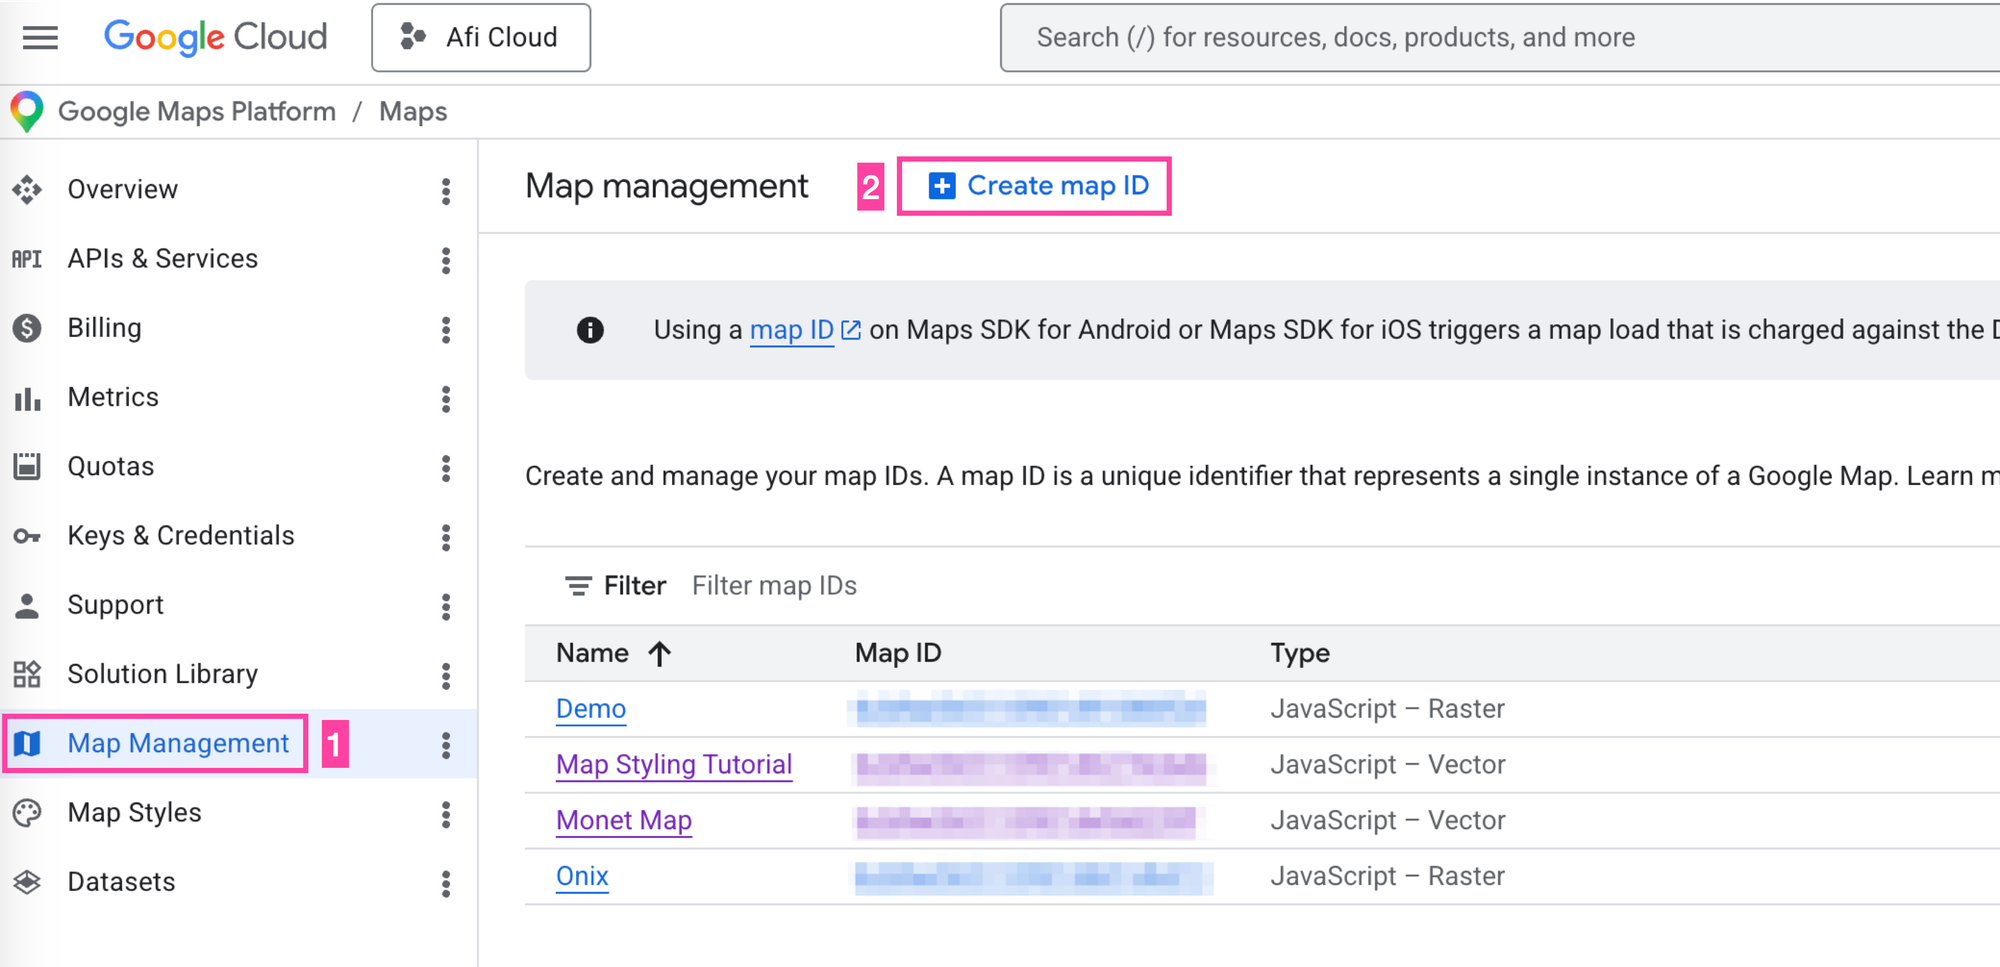
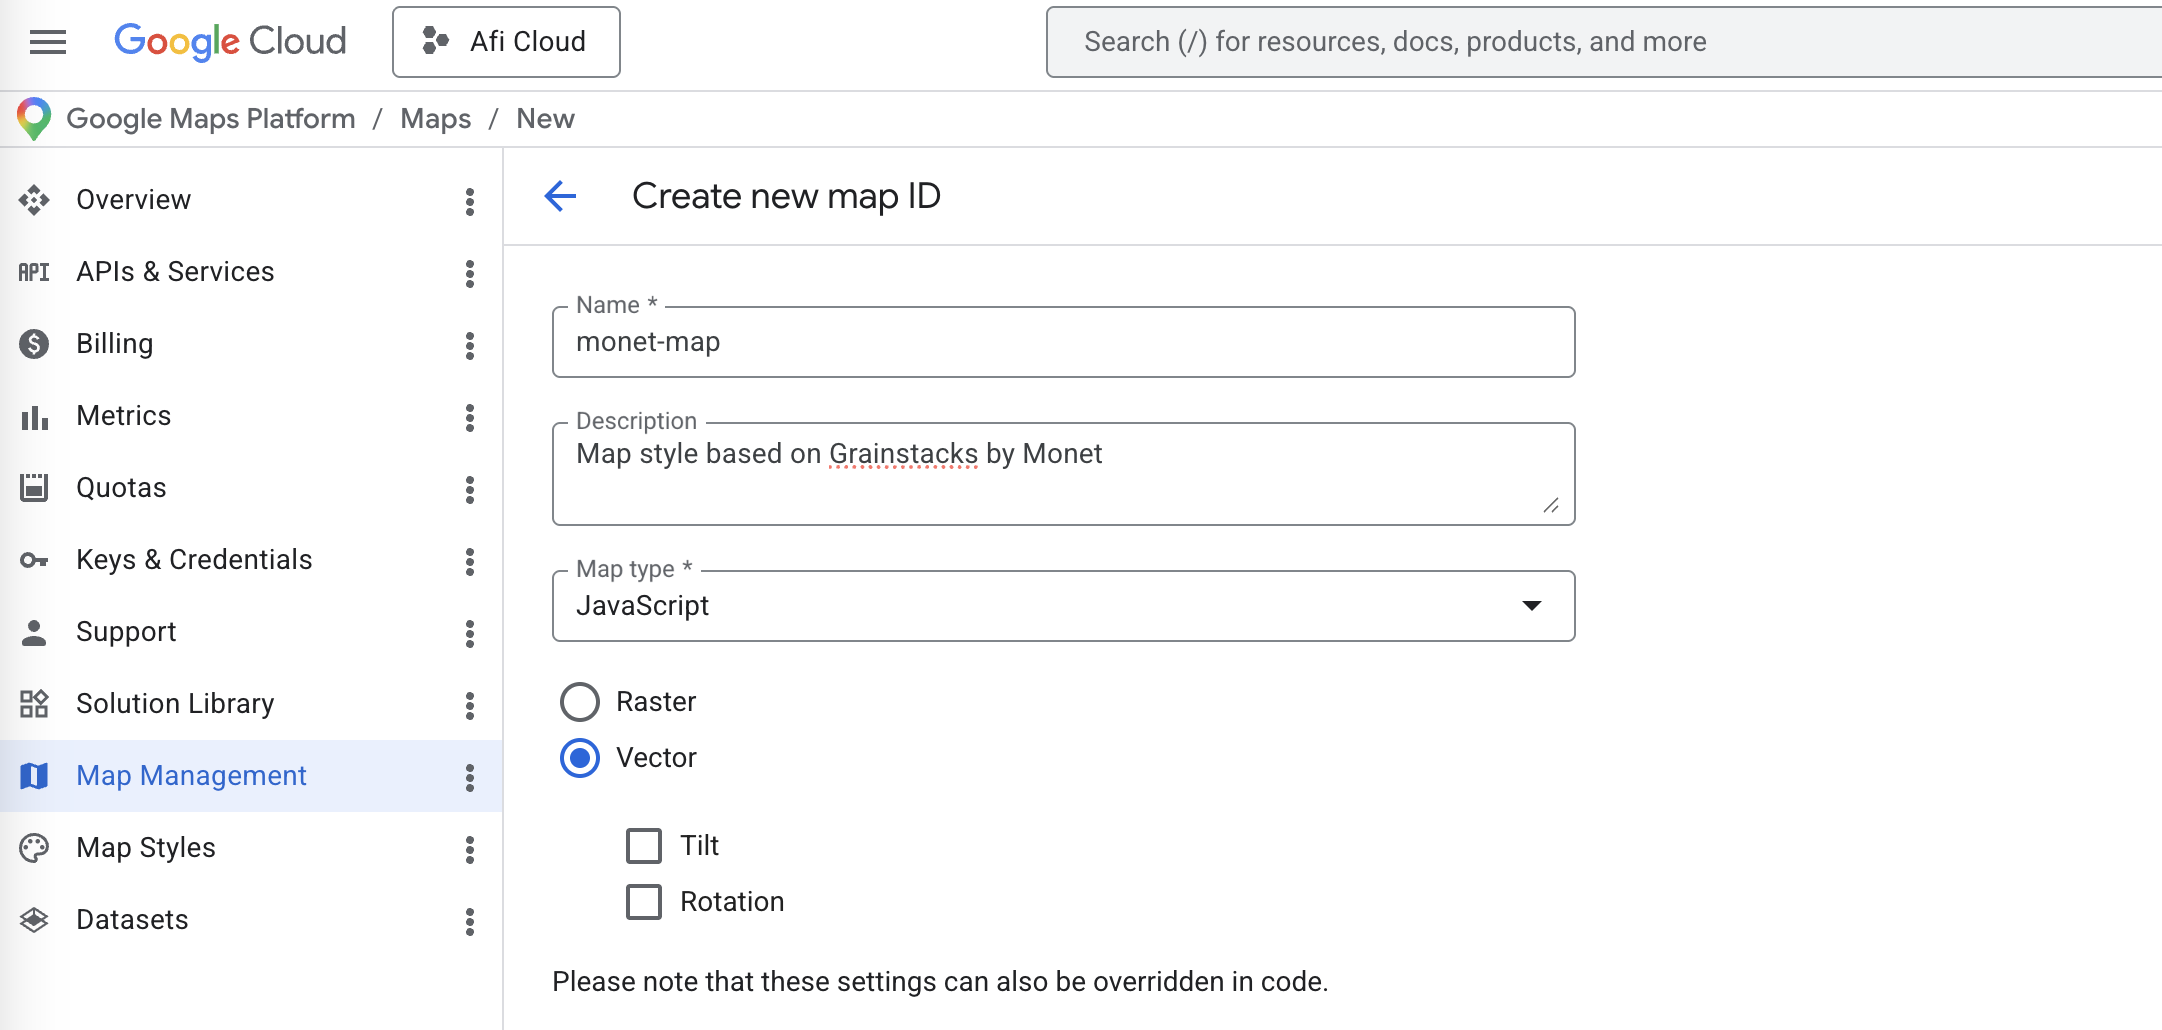
Click on [Map Management] in the left hand navigation bar followed by [Create Map ID] in the top navigation bar. Give your map a name and description and make you choose Javascript Vector map as your map type. This is going to be important later on because only vector maps can be used with data driven styling.
Click [Save] in the bottom left. Next, associate the Map ID with the Monet inspired style. Open the map detail screen, click the [✏️] icon at the bottom, pick your style from the list, and click [Done].
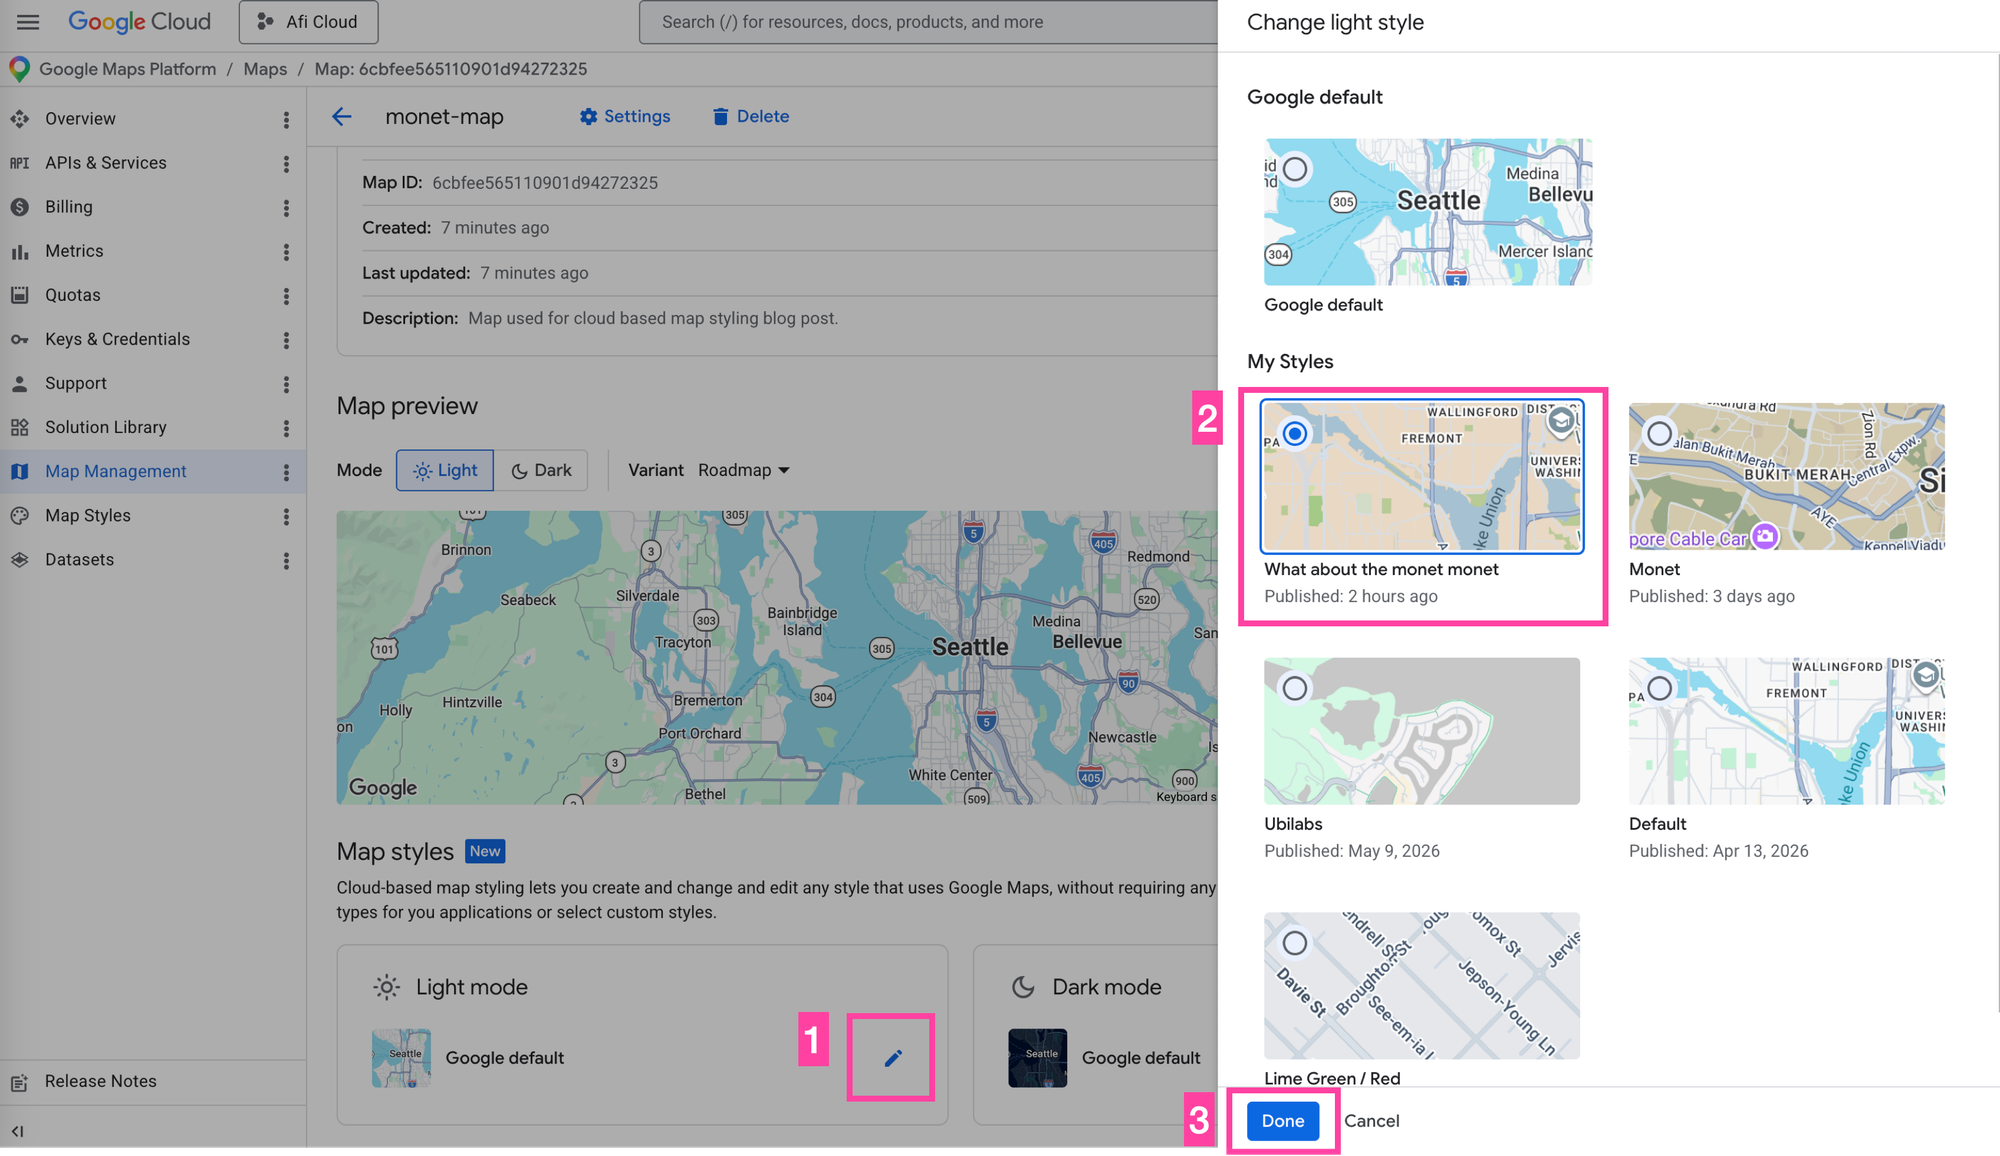
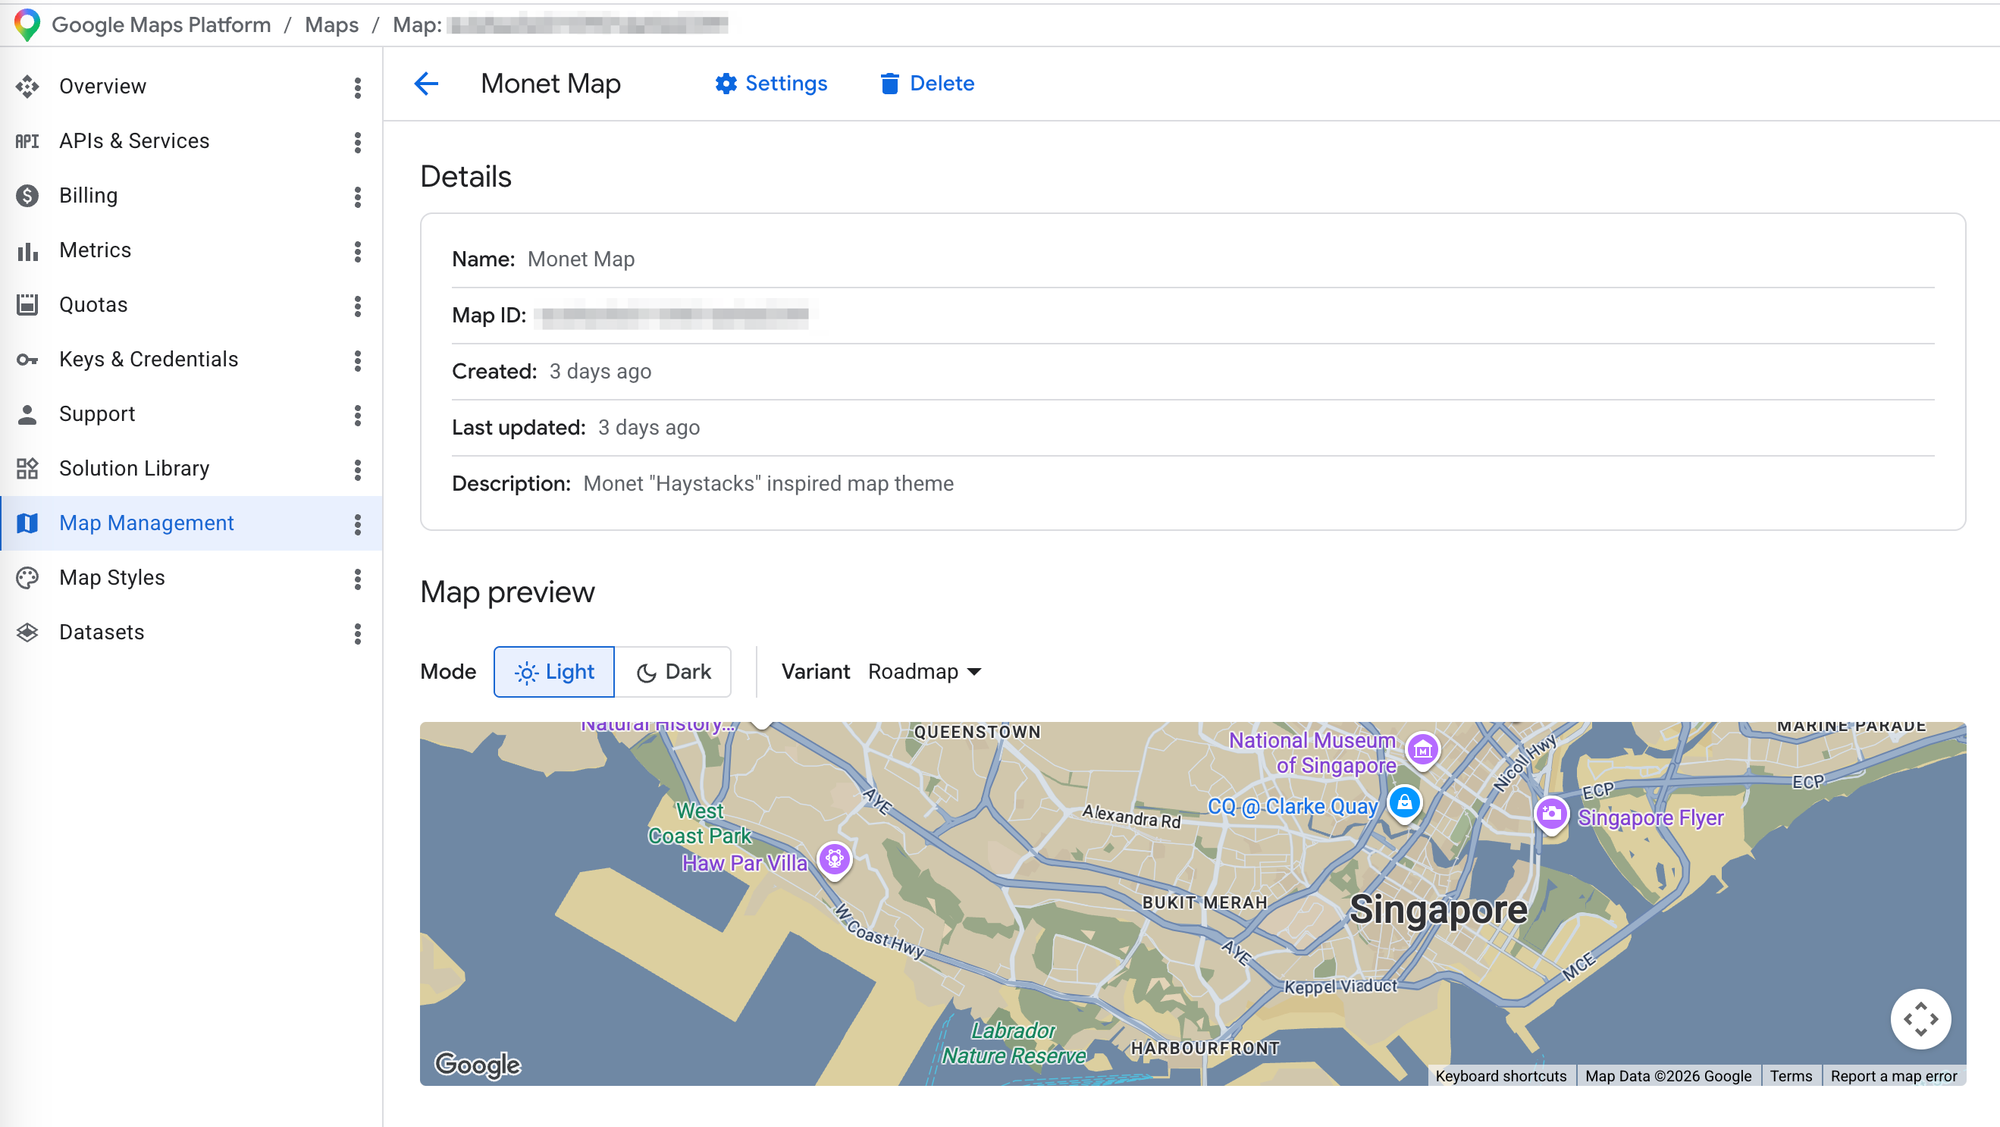
You should now see the style applied to the basemap.
Using AI to generate Google Maps map styles
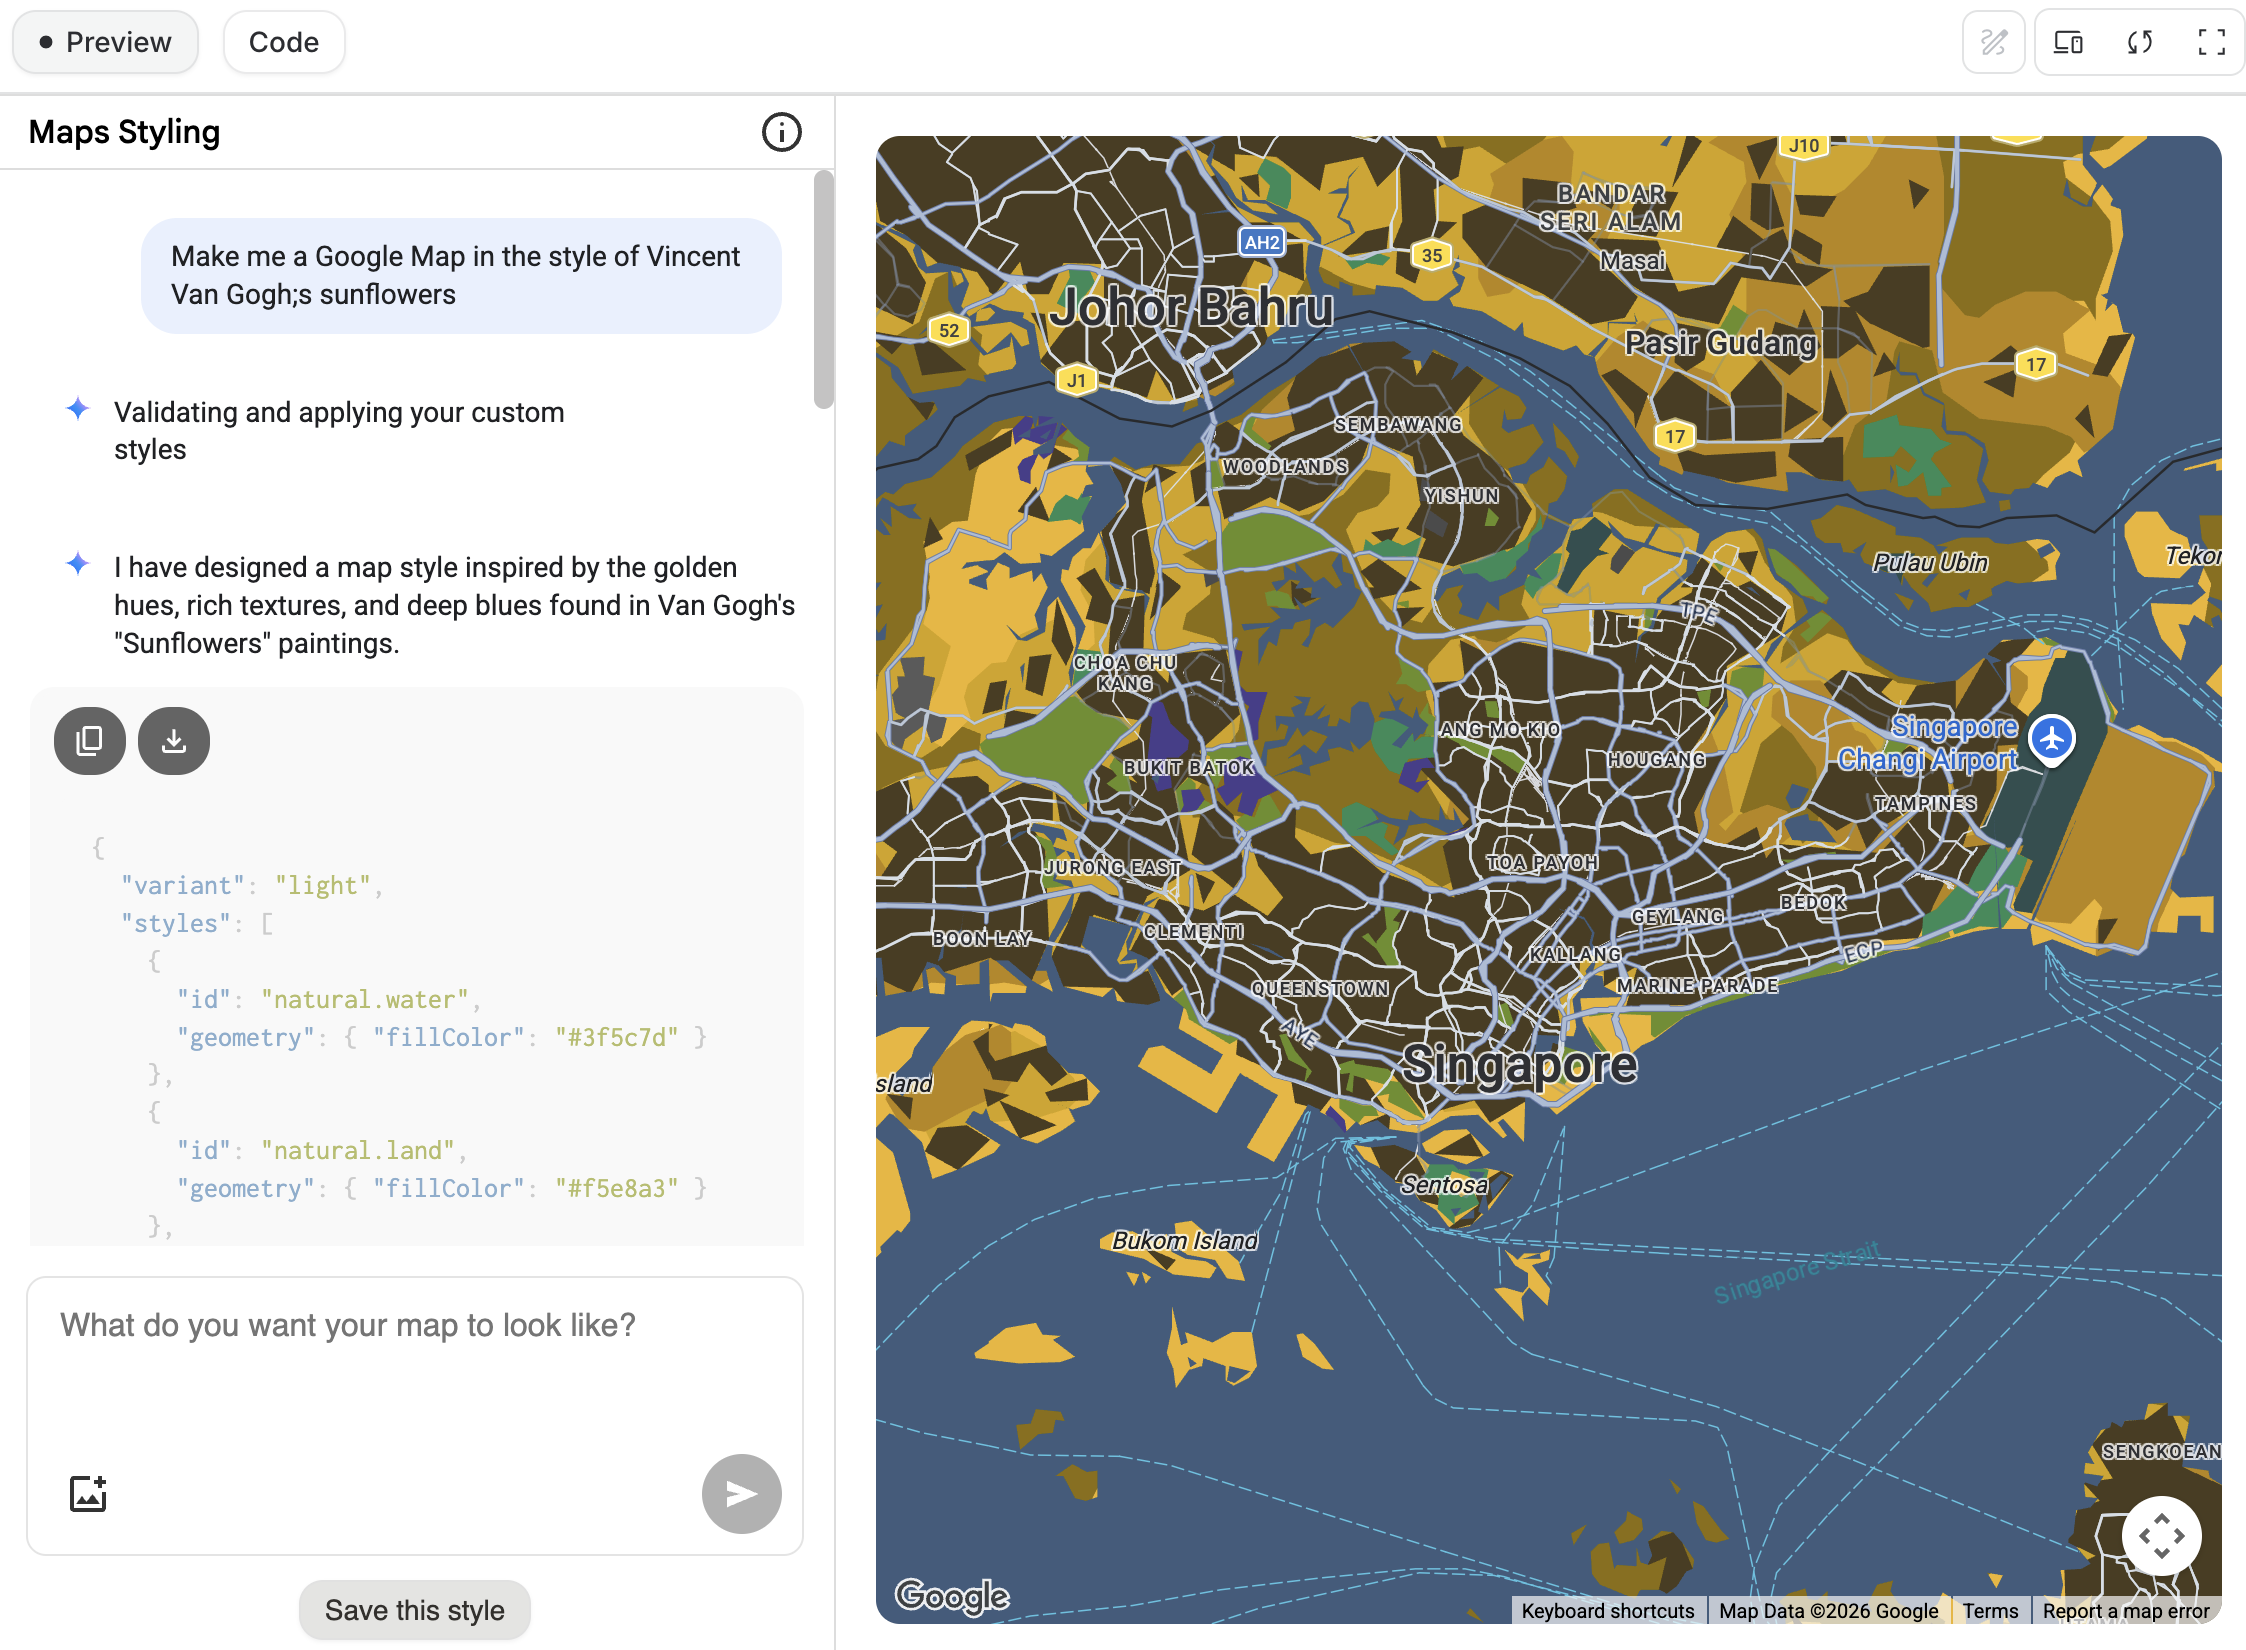
One disadvantage of cloud based styling is the lack of a community. You can't browse or build on other people's work, the way you can with JSON style arrays through sites like Snazzy Maps, and you can't share your own styles either. Every style starts from scratch. However, you can ask Google AI Studio to generate a style for you.
- Click this link to open up the Maps Styling App in Google AI Studio.
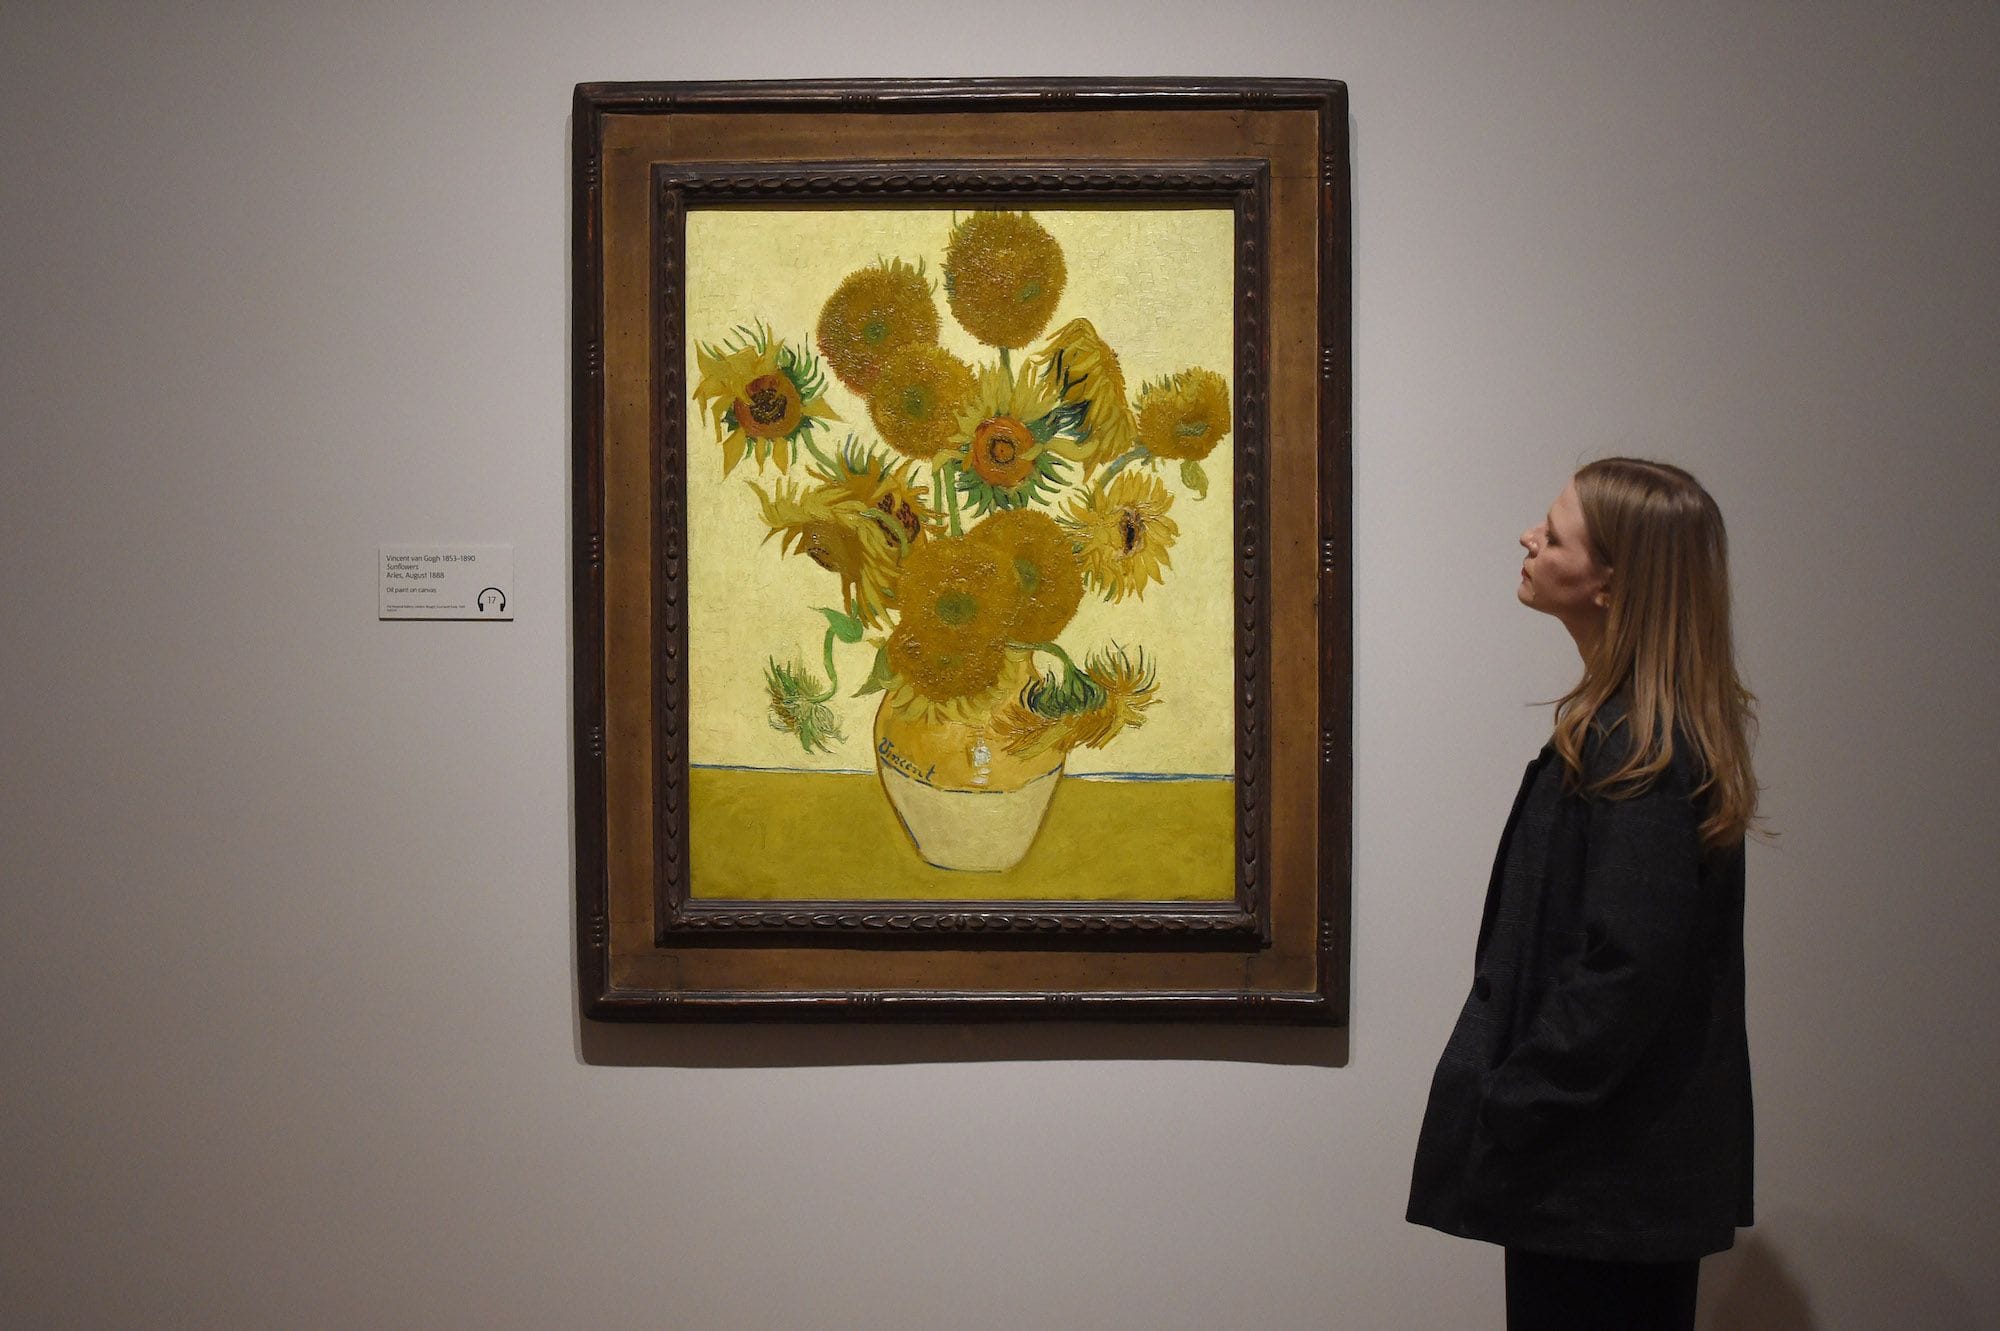
- Type in a prompt. I tried "Make me a Google Map in the style of Van Gogh's Sunflowers."
- Copy your JSON style array into the cloud based styling editor and tweak it however you like.
Where do we go from here?
Cloud based map styling is a clear upgrade over JSON style arrays. Separating map design from code lets design and product teams iterate faster, and with over 3x the customizable features and POI categories (source), it gives users far more control over what shows up on the map.
However, the Cloud Console UI is confusing. The docs lag the product and its harder than it should be to associate a style with a map. Many of my personal and professional projects still use JSON style arrays because its easy to understand and easy to implement. You also usually only need to set the map's design once, at the start of the project. Once I find a design I'm happy with, I rarely change it.
For the rest of this tutorial, we'll build on what we've done with cloud based map styling by adding data (both Google's and our own) to a map and styling it.
This article was written by Afi Labs, a Google Maps Platform Premier Partner and reseller. We build route optimization, navigation, and fleet tracking software on Google Maps, and offer volume pricing on GMP licensing. Talk to an engineer or follow Afian on LinkedIn.
Next: Part 4: Google Maps data driven styling for boundaries