Google Maps data driven styling for boundaries
Learn how to use Google Maps data driven styling for boundaries to build an interactive choropleth map of San Francisco postal codes.

Data driven styling for boundaries lets you color and style regions on a Google Map using Google's own boundary data (countries, states, postal codes, and more), which Google curates, updates and manages. In this post, I'll show you how to build a choropleth map of US postal code boundaries in San Francisco.
Part 1: Style a Google Map any way you want
Part 2: Apply styles for Google Maps using JSON style arrays
Part 3: Cloud based map styling for Google Maps
Part 4: Google Maps data driven styling for boundaries (this article)
Part 5: Create a heatmap in Google Maps with data driven styling
Part 6: Upload and style datasets using the Maps Datasets API
Part 7: Add data to Google Maps with data driven styling
What is Google Maps data driven styling for boundaries?
Data driven styling for boundaries gives you the ability to build maps with the same boundaries and polygons used in Google Maps.
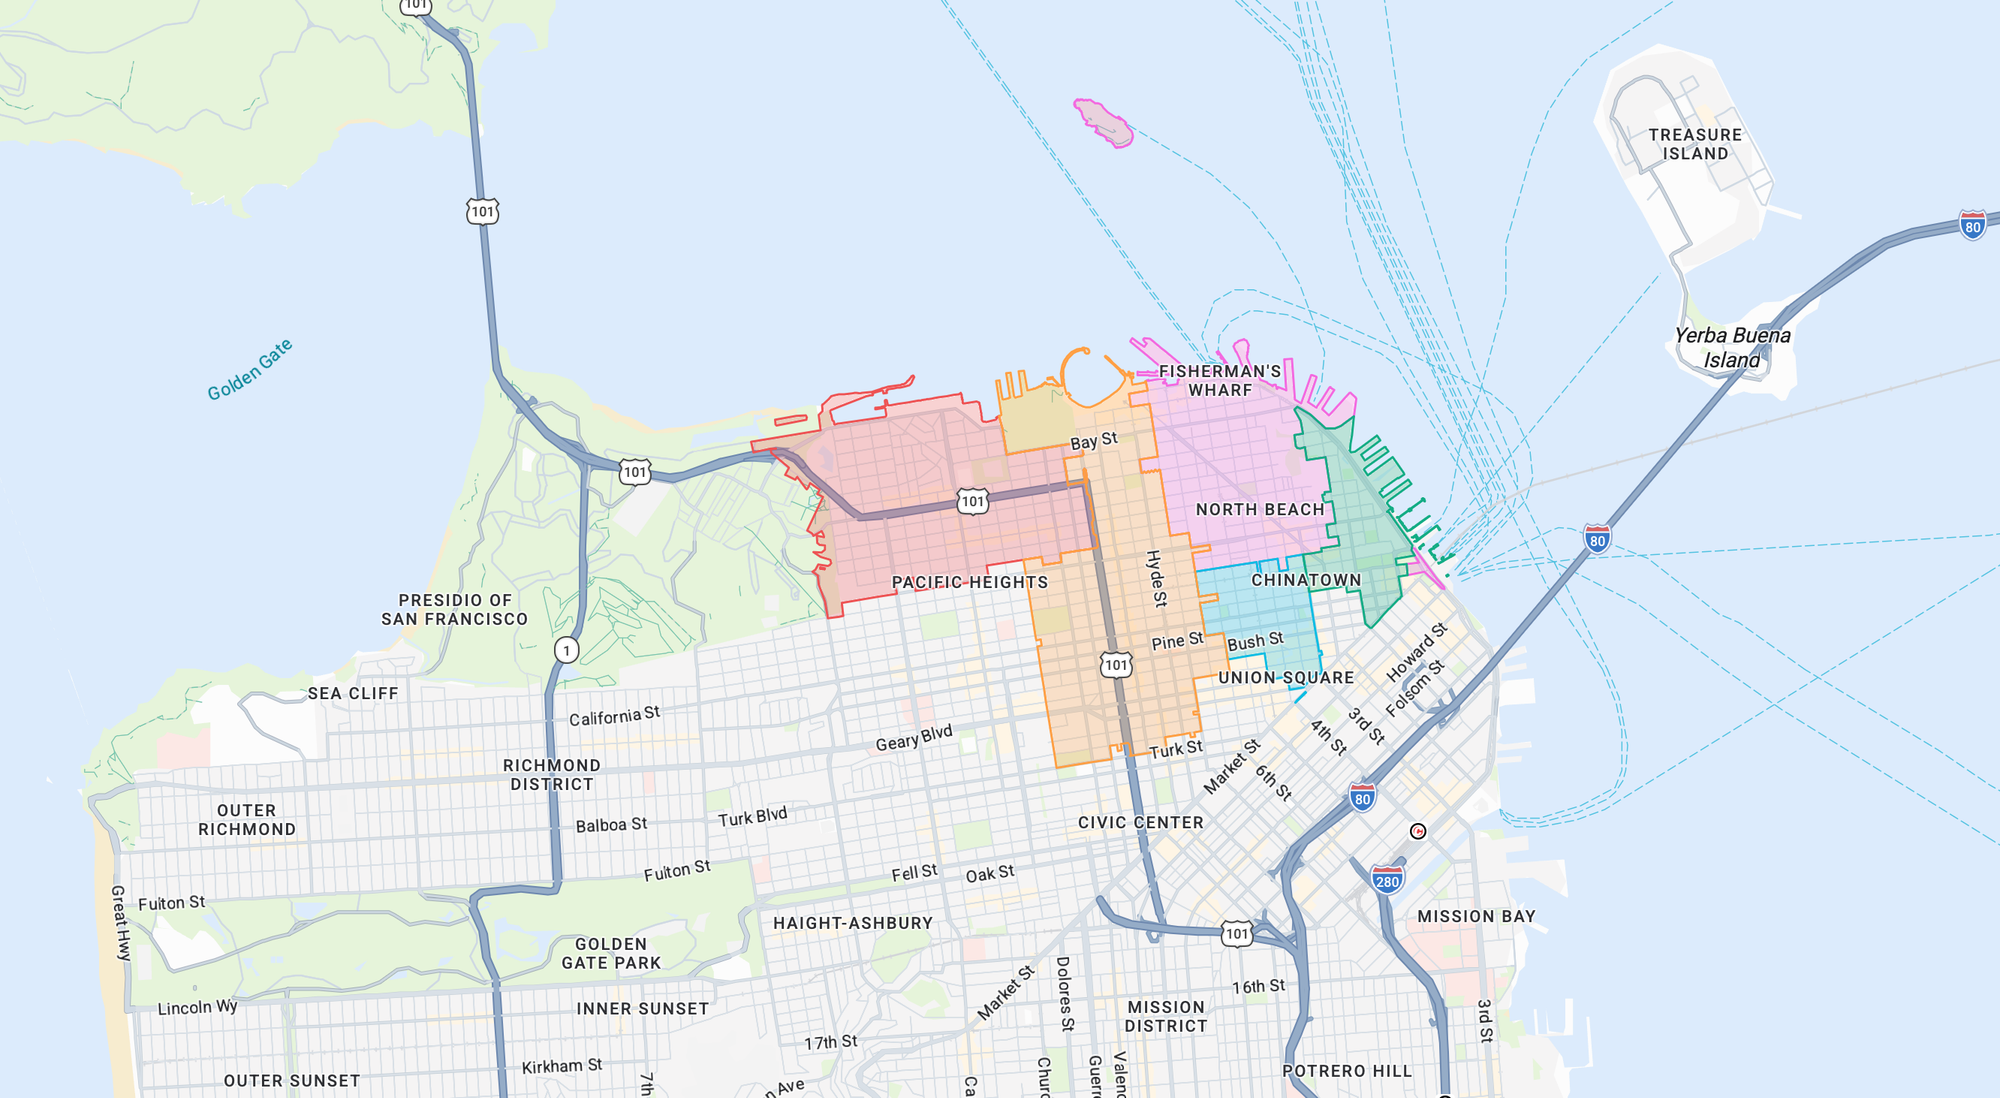
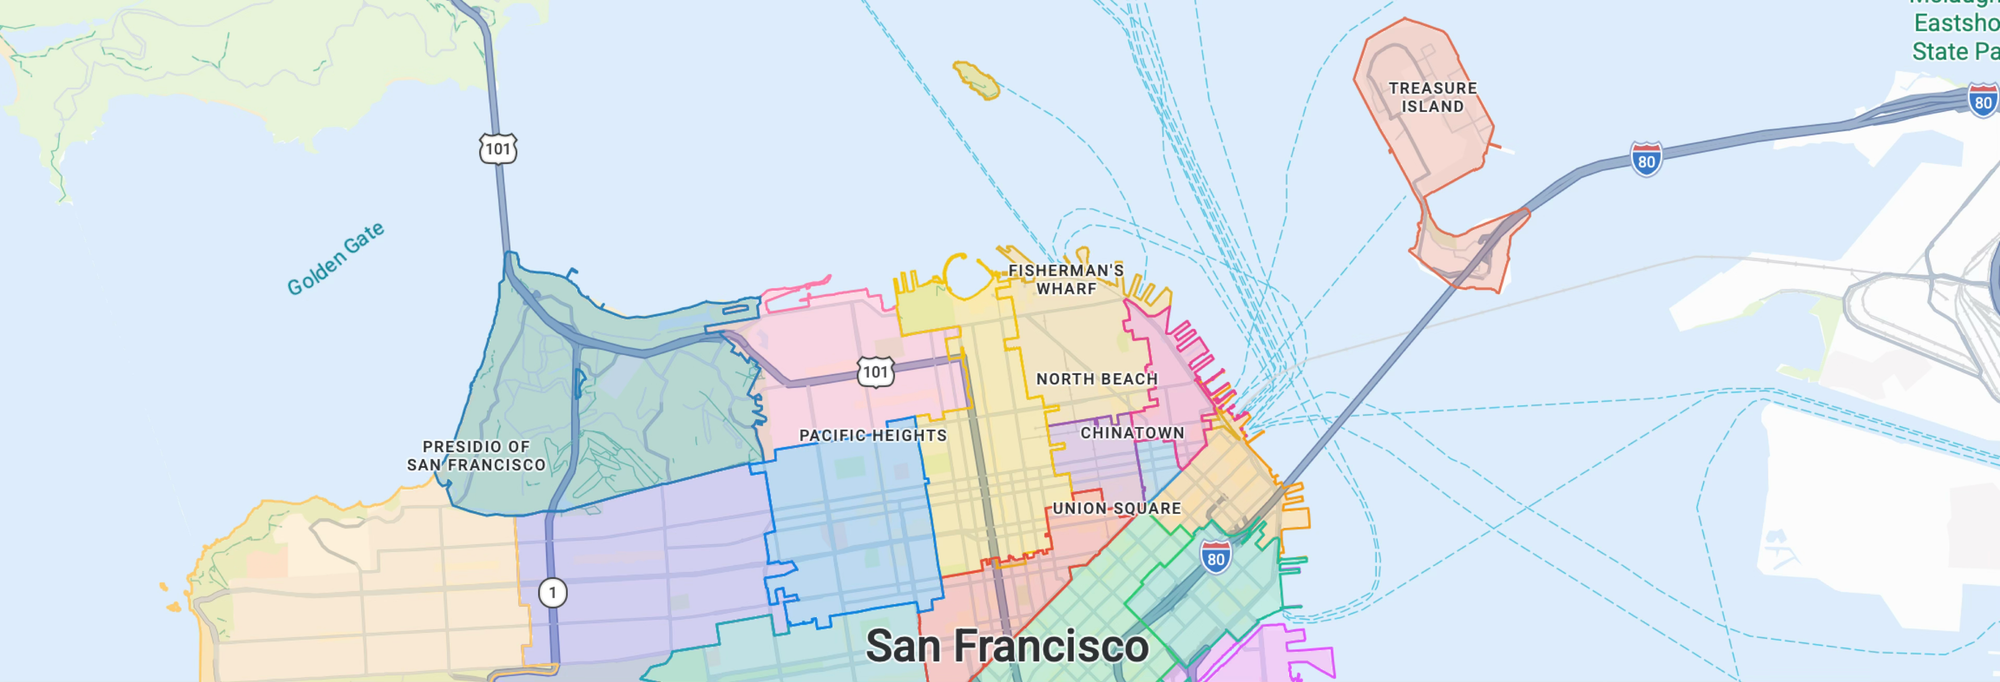
Once Google's boundary polygons are on the map, the styling becomes a function of your data. You provide a lookup keyed by place ID e.g. postal code to median income, school district to SAT scores etc and return a style object based on the value. The following style function assigns a different color to each postal code in downtown San Francisco (see map above).
const colorByPlaceId = {
  ChIJ61hhQeGAhYARo_x_aAlCar8: "#f368e0", // CA 94133
  ChIJy0ilcOmAhYARCLOo6oZQNxk: "#ff9f43", // CA 94109
  ChIJrYrvSdeAhYARtJlHJMWNQzY: "#ee5253", // CA 94123
  ChIJx5rJUYyAhYARxagLGBVGeFs: "#0abde3", // CA 94108
  "ChIJ49w0El-AhYAR9WVSnuOiWM8": "#10ac84", // CA 94111
};

layer.style = (params) => {
  const placeId = params.feature.placeId;
  if (!SF_ZIP_PLACEIDS.has(placeId)) return null;

  return {
    strokeColor: colorByPlaceId[placeId],
    strokeOpacity: 1,
    strokeWeight: 1.5,
    fillColor: colorByPlaceId[placeId],
    fillOpacity: 0.25,
  };
};
How does Google Maps data driven styling work?
Just like with cloud based map styling, data driven styling for boundaries plugs into Google Cloud Console. You enable the boundary layers you want on a Map Style, attach that style to a Map ID, and reference the Map ID when you load the map. That's the same Map ID mechanism that powers cloud based map styling.
When a feature layer e.g. postal codes, for example, is enabled on a map style and attached to a Map ID, feature metadata (namely the place ID) arrives with the vector tiles. Your style function then runs once per feature, synchronously, and the return value tells the renderer how to paint that polygon (fill, opacity, stroke) during the tile's draw call. Because of this, data driven styling is fast. The polygons are baked into vector tiles and are rendered through WebGL directly on the GPU. Each polygon becomes a triangulated mesh that the graphics card paints in parallel.
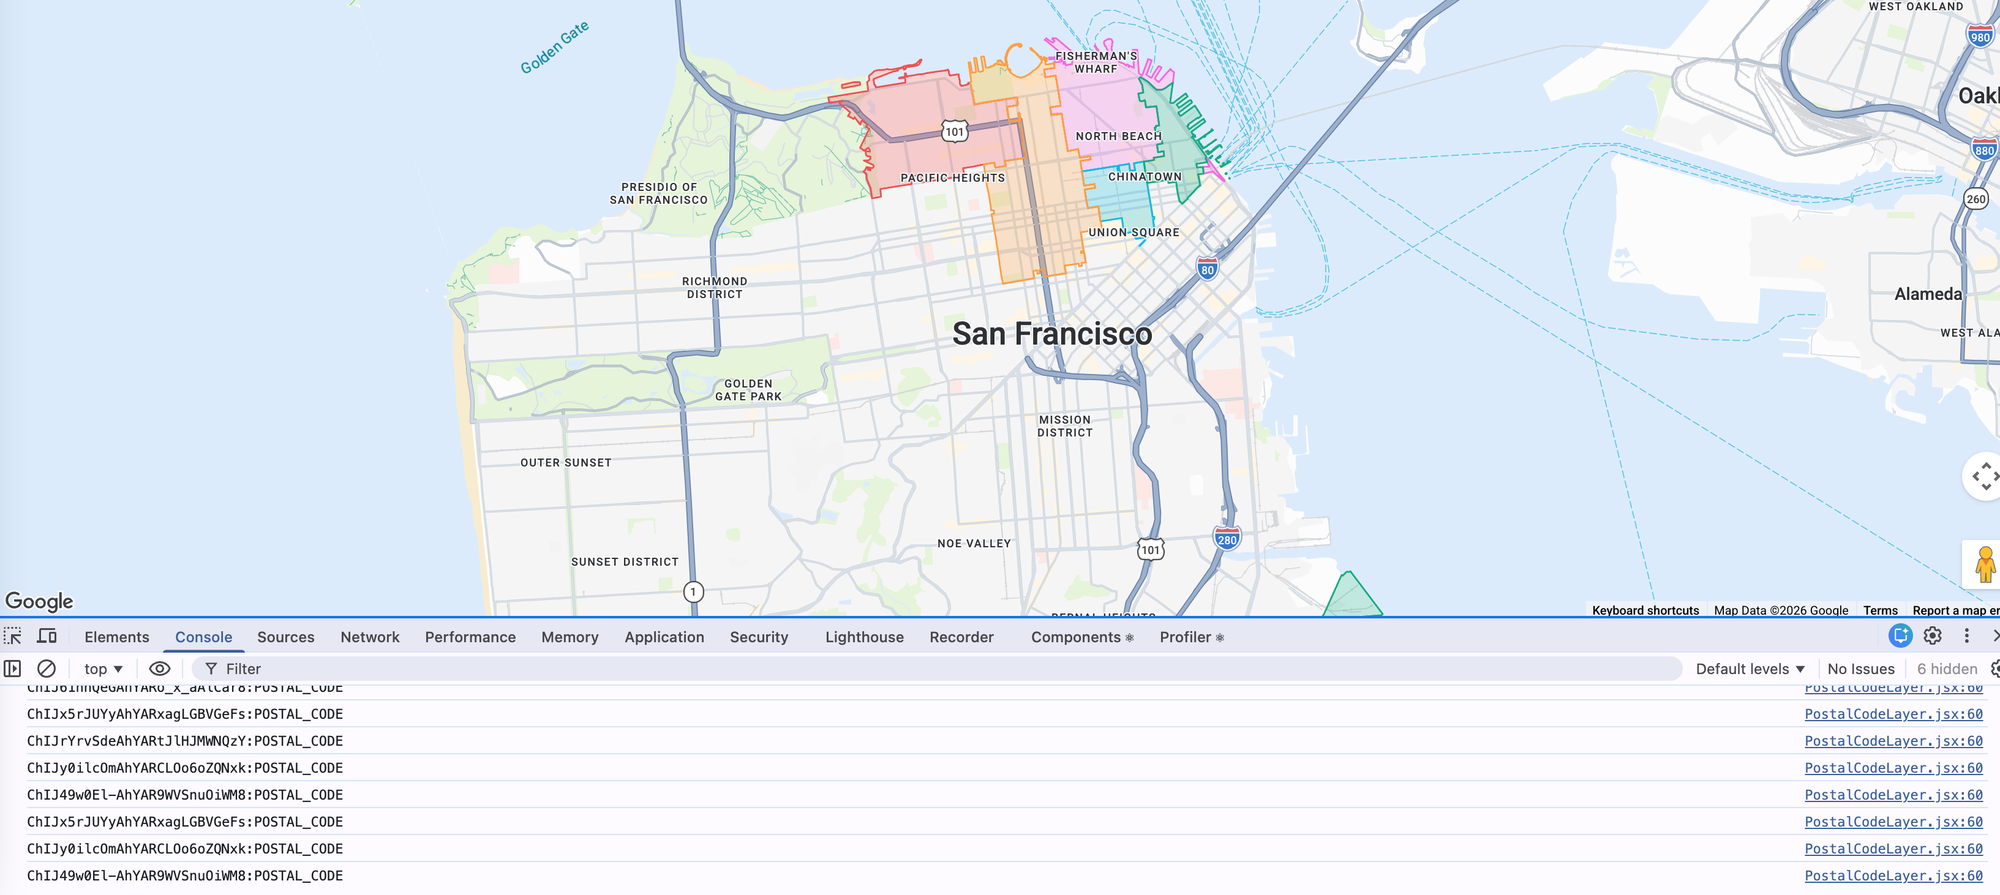
The tradeoff then is that Google Maps doesn't return the boundary geometry or other metadata you might expect. A feature only exposes its placeId and featureType (POSTAL_CODE, LOCALITY, SCHOOL_DISTRICT, and so on). No coordinates, no bounds, no centroid, no GeoJSON. If you need anything more, like the boundary's name or viewport, you have to make a separate call to the Place Details API. We'll walk through a worked example shortly.
Google Maps data driven styling worked example (single feature)
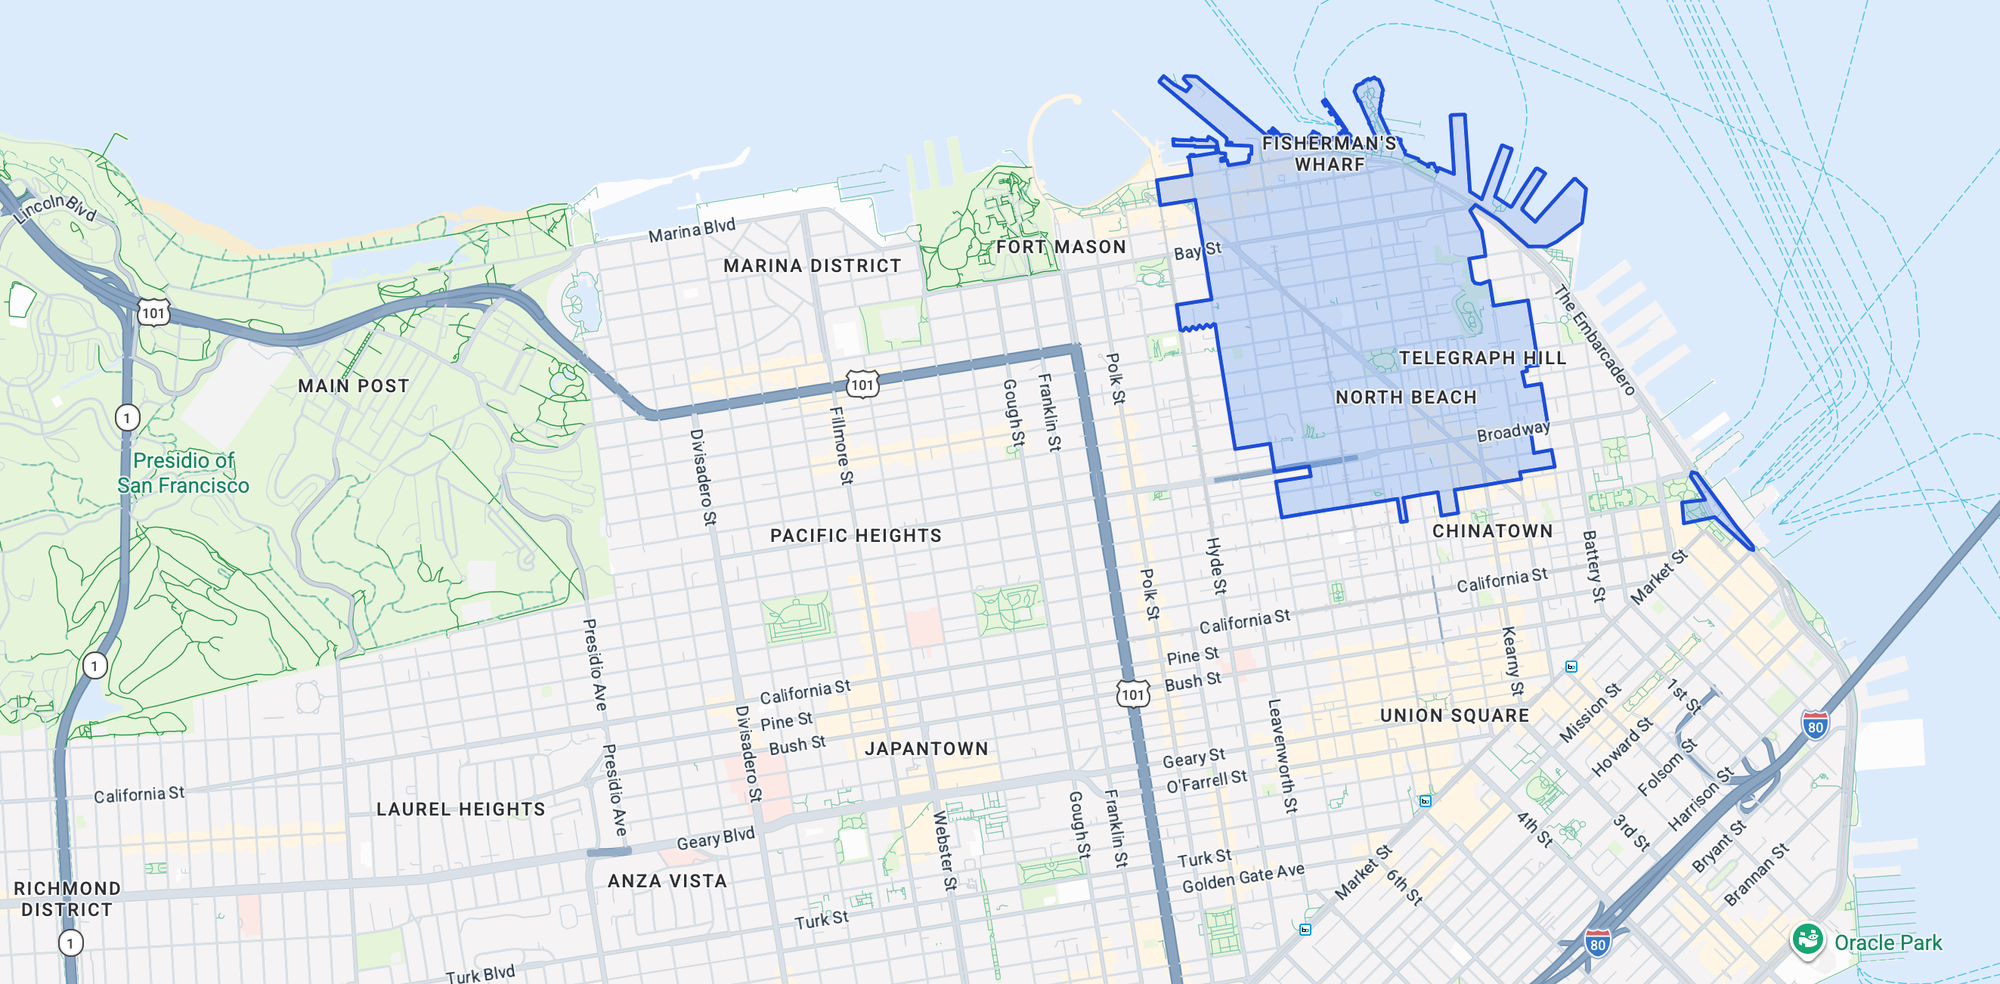
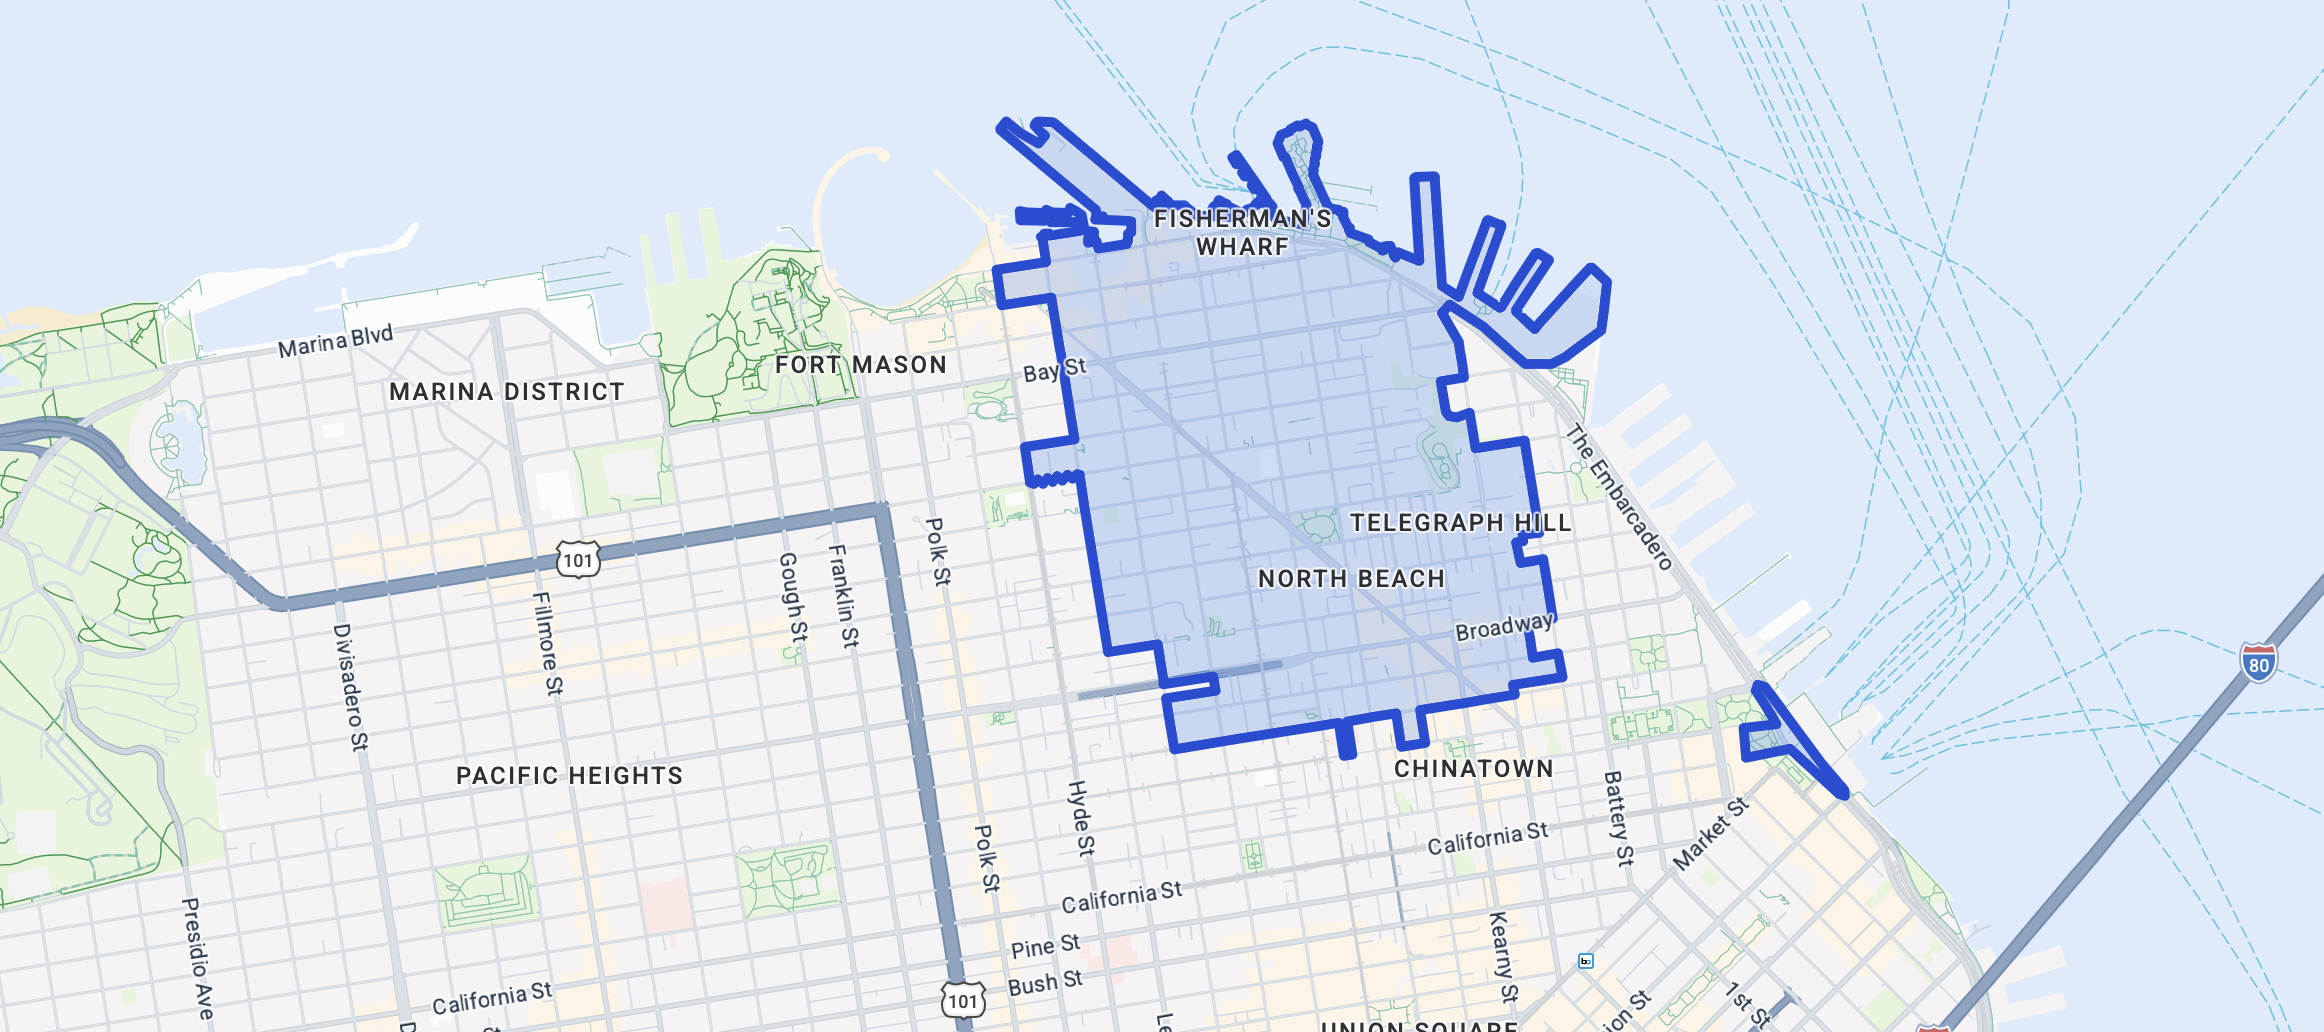
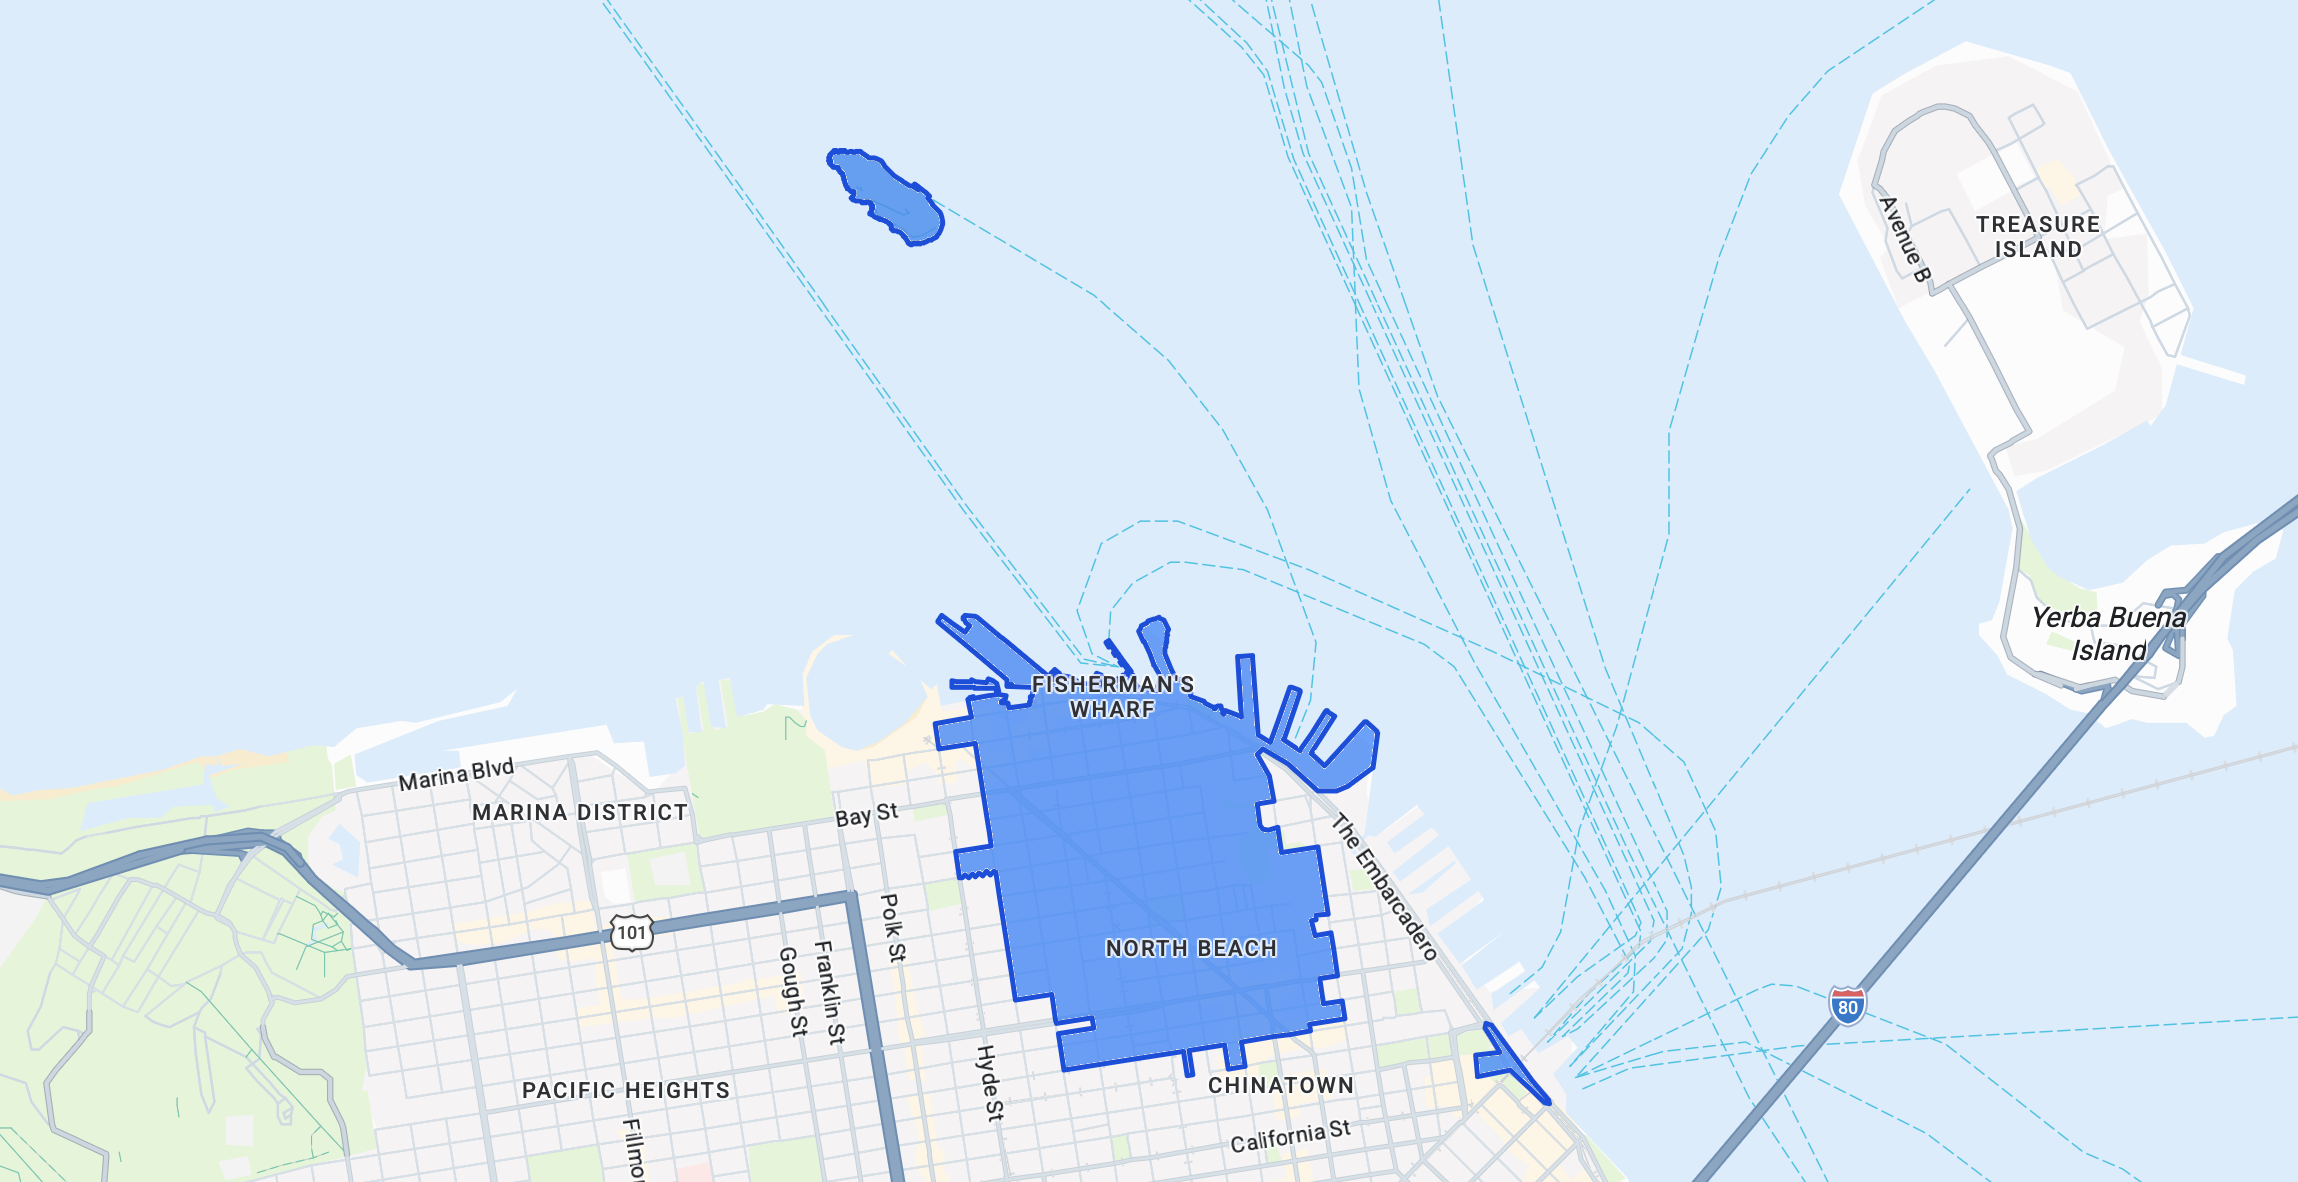
To get started with data driven styling for boundaries, we'll style a single postal code: 94133, which covers North Beach (Little Italy), Telegraph Hill, and the touristy Fisherman's Wharf in San Francisco. It's one of my must visit neighborhoods each time I'm in San Francisco.
First, we'll need to make sure that the postal code data layer is enabled in our Google Map (or you could just use my Map ID 6cbfee565110901d8c6f781f).
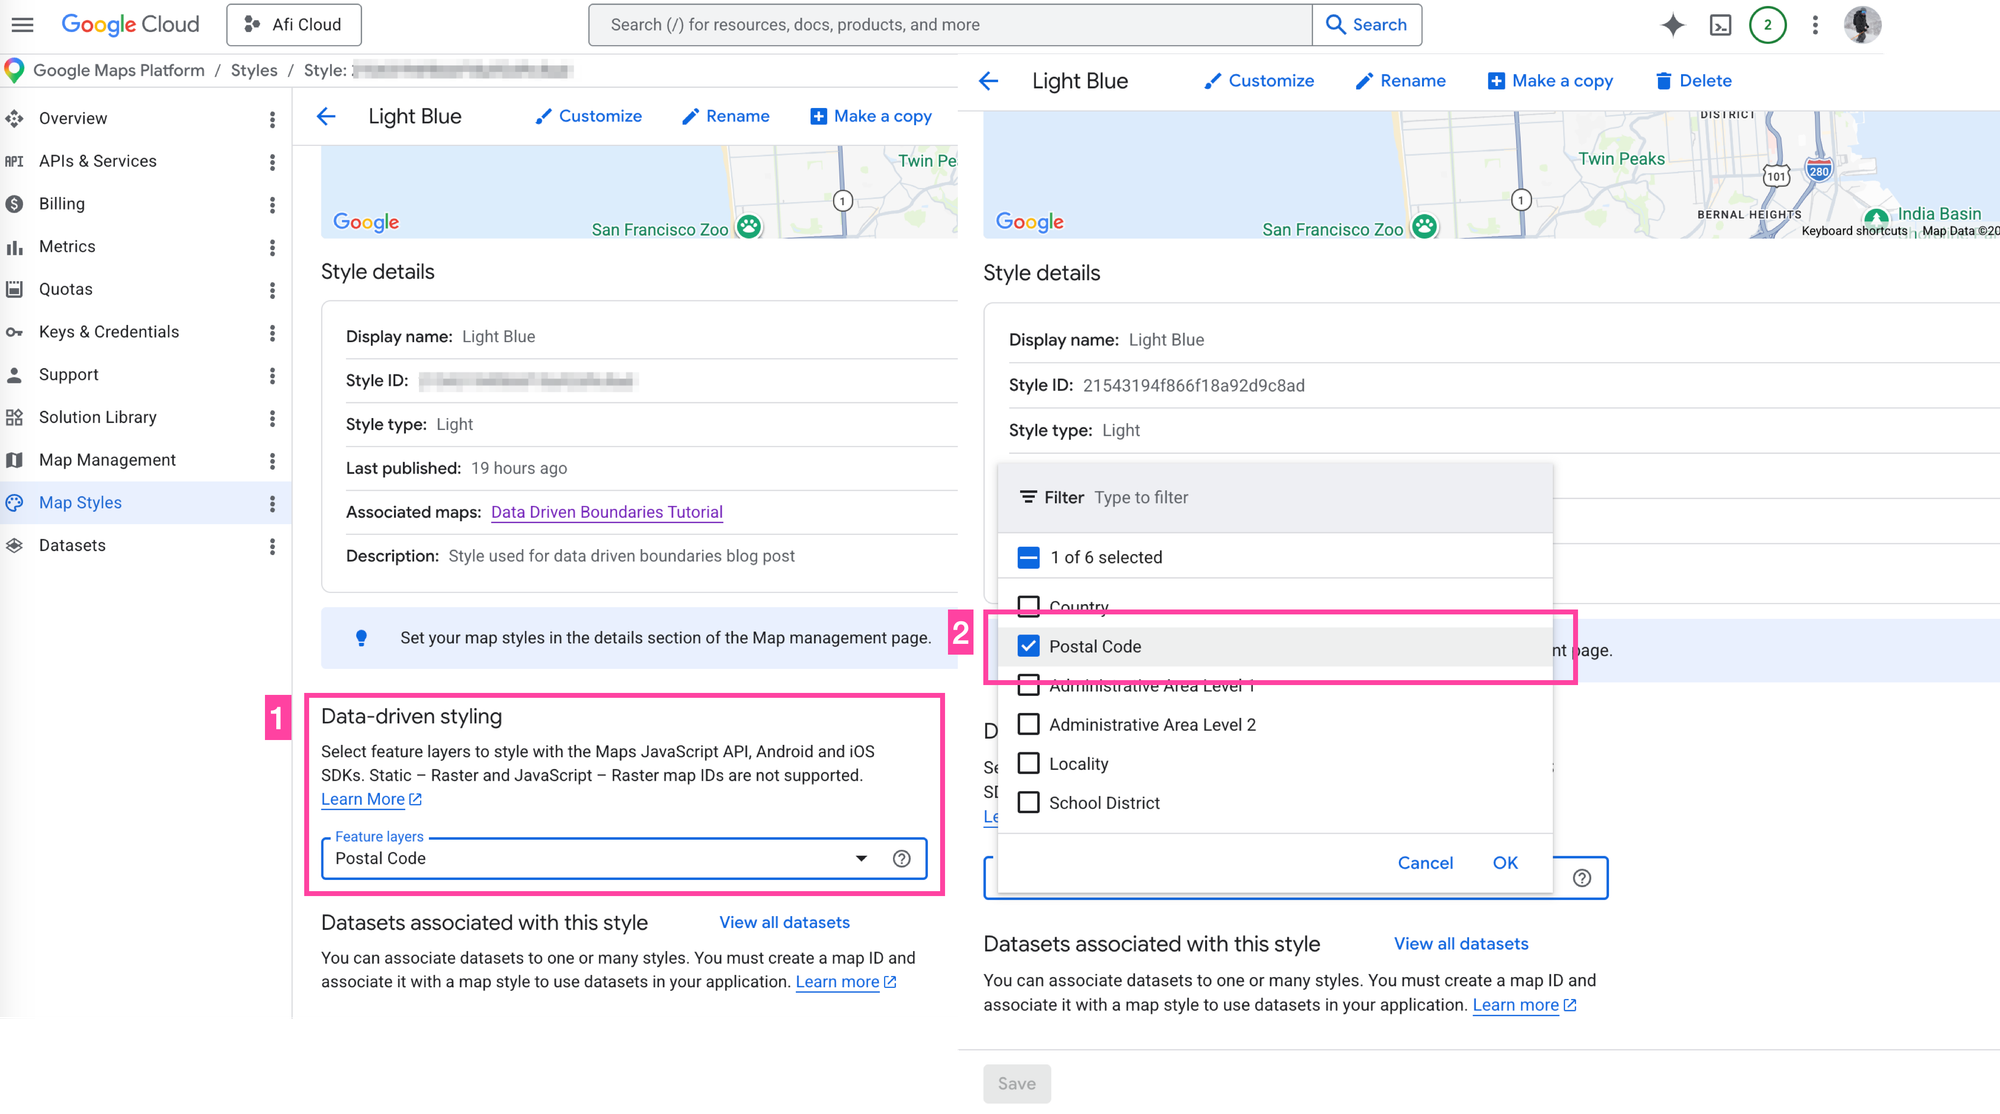
- Create a new Google Maps style in your Google Cloud Console.
- After you create the style, click on the Map Styles section in the left hand navigation bar and select the style you just created.
- You'll see a Data Driven Styling section at the bottom (you might need to scroll down a bit). Select the Postal Code feature layer.
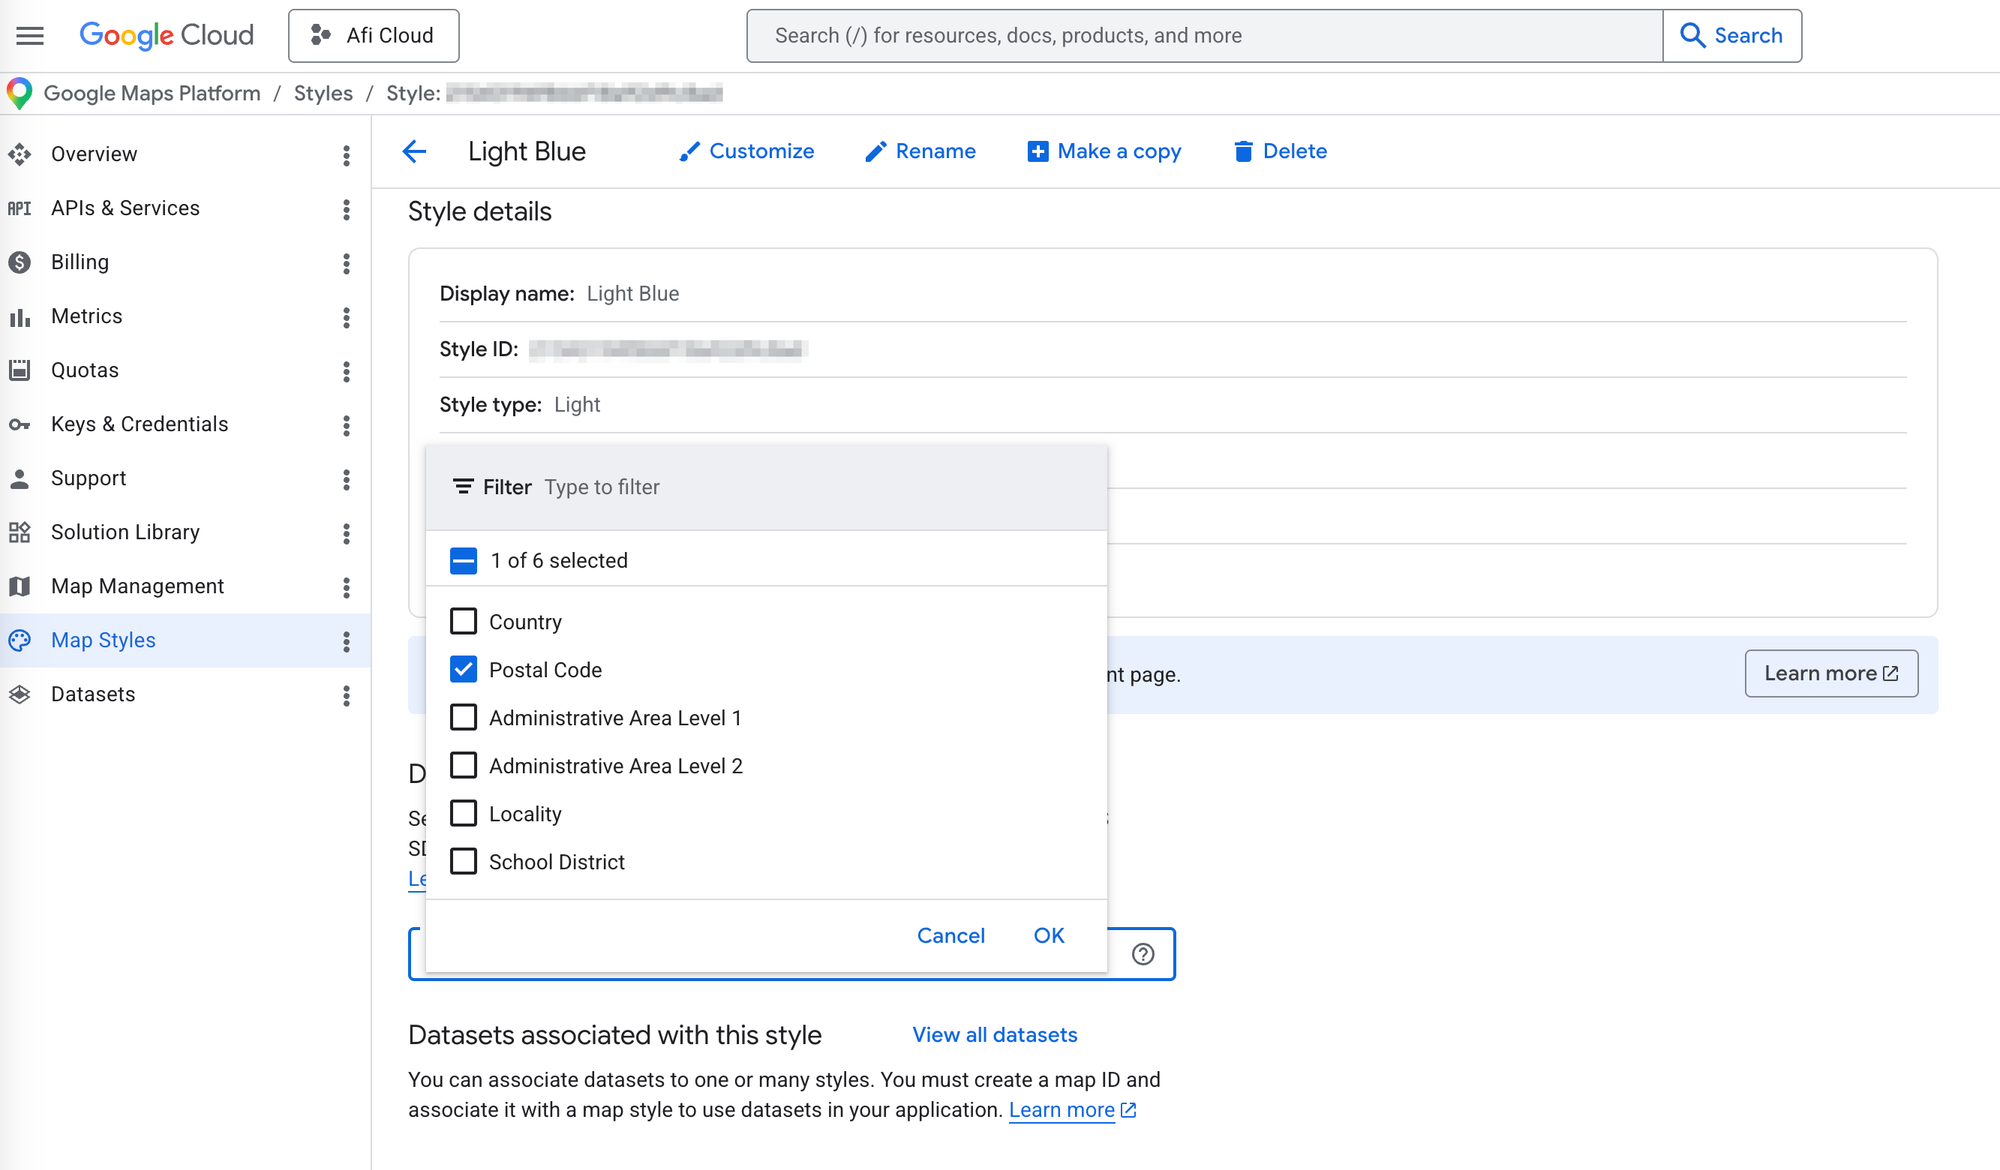
- Click [Save]. Don't miss this step!
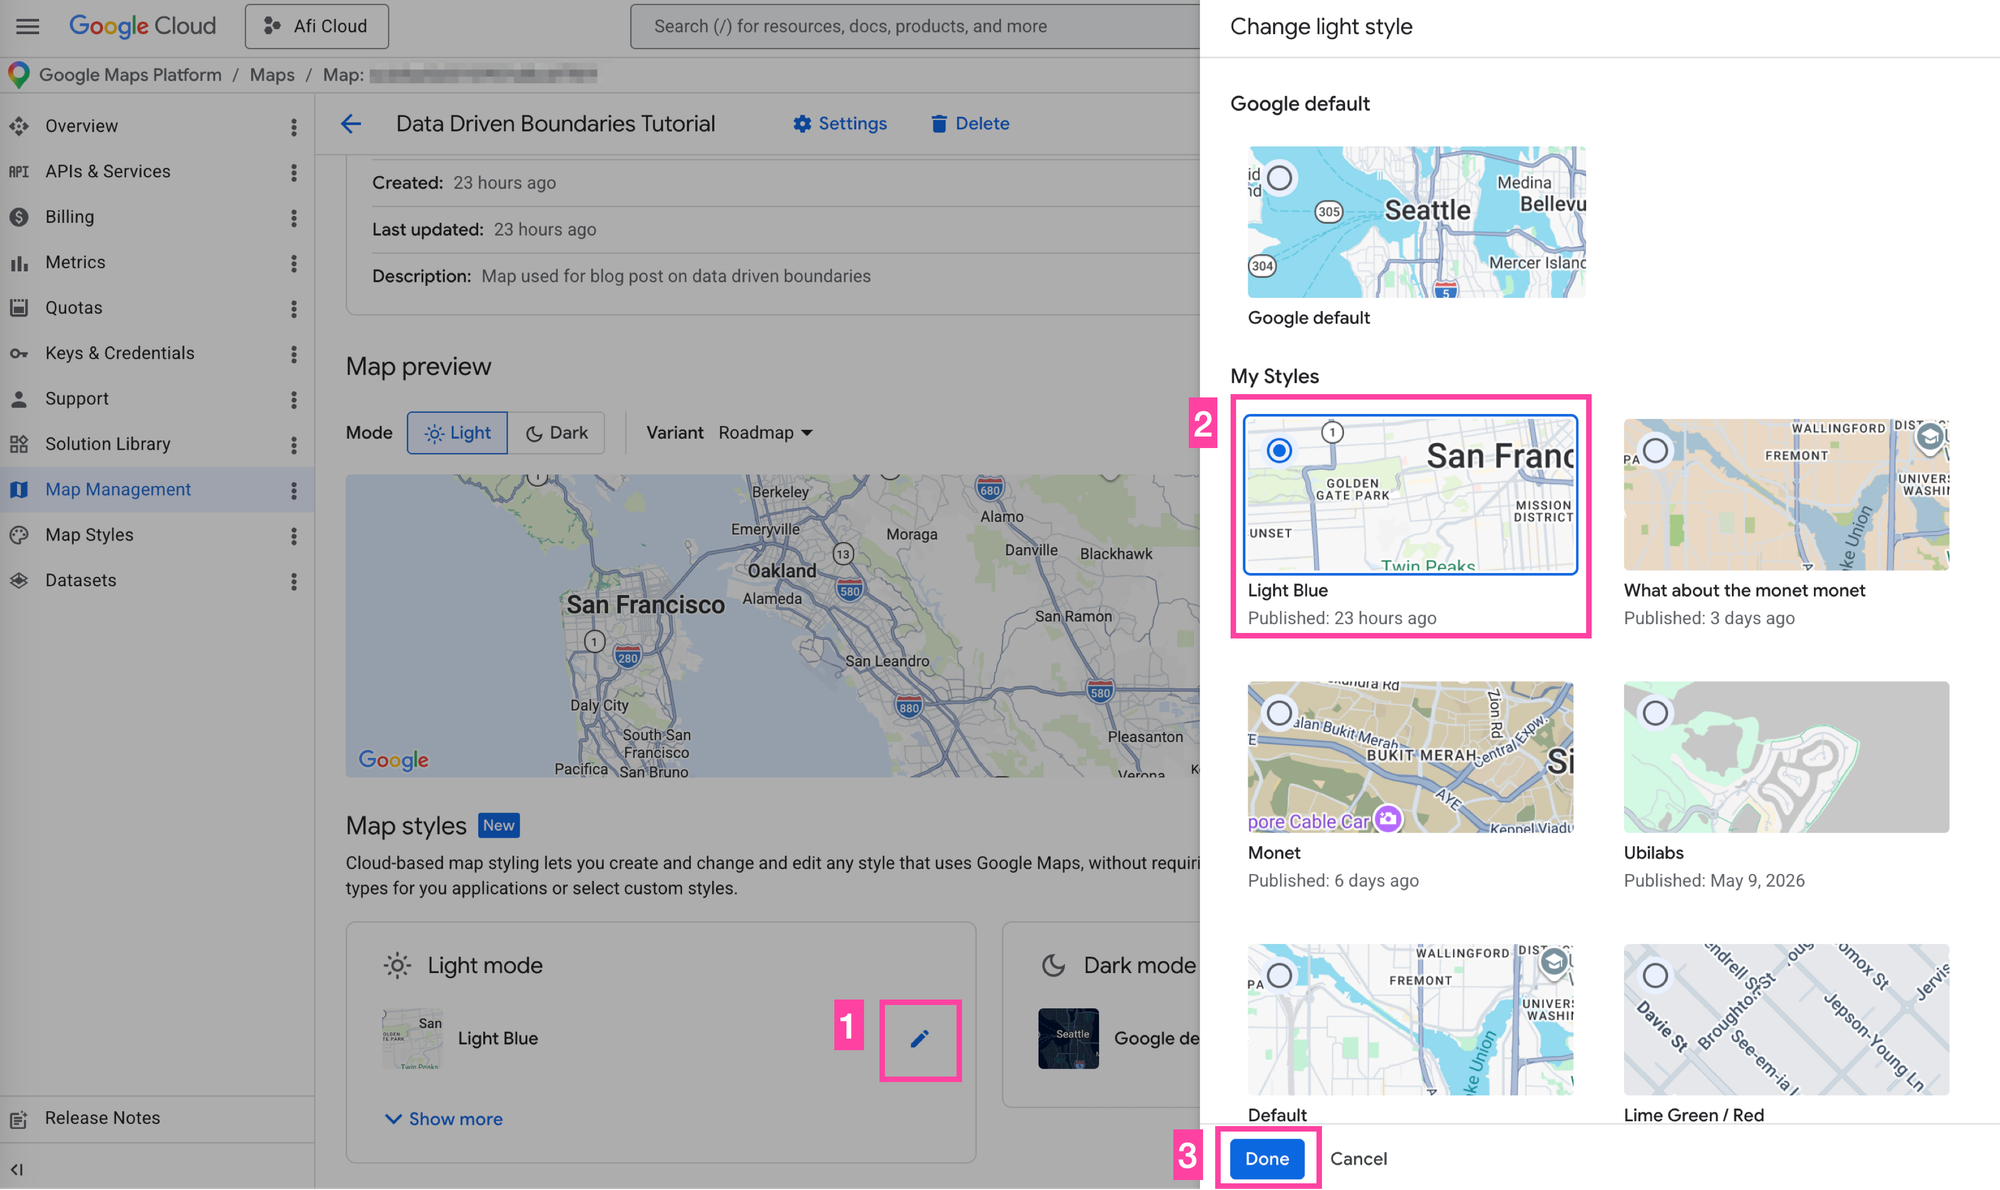
- Now go to Map Management and click on [+ Create Map ID].
- In the map detail screen, click the [✏️] icon at the bottom, pick your style from the list, and click [Done].
Next, follow the instructions in my blog post: Google Maps with React: Add a Google Map and style it to create a fresh React app with a Google Map. Alternatively, clone the google_data_driven_styling_boundaries (coming soon!) repository locally.
Third, create a standard App.jsx with a Google Map set up using the @vis.gl/react-google-maps library. Make sure to point the mapId prop in the <Map/> component the map ID we just created a few moments ago.
/*** App.jsx ***/
import {APIProvider} from '@vis.gl/react-google-maps';
import {Map} from '@vis.gl/react-google-maps';
import { useCallback } from 'react';

import SinglePostalCodeLayer from './SinglePostalCodeLayer';

function App() {

  return (
    <APIProvider
      apiKey={import.meta.env.VITE_GOOGLE_MAPS_API_KEY}
    >
      <Map
        style={{ width: '100vw', height: '100vh' }}
        defaultCenter={{ lat: 37.773972, lng: -122.431297 }}
        defaultZoom={12}
        mapTypeControl={false}
        mapId={'6cbfee565110901d8c6f781f'}
      >
        <SinglePostalCodeLayer />

      </Map>


    </APIProvider>
  )
}

export default App
The <Map/> component has one child: <SinglePostalCodeLayer/>. It doesn't render any DOM of its own. Instead, it configures the POSTAL_CODE feature layer on the map so Google's renderer draws the boundary we want. Here's how it works, step by step:
const map = useMap();returns thegoogle.maps.Mapinstance created by the<Map />component inApp.jsxconst layer = map.getFeatureLayer('POSTAL_CODE');retrieves thePOSTAL_CODEfeature layer we just enabled in the Cloud Console.- We assign a
FeatureStyleFunctionto the postal code layerfeatureLayer.style, styling it withSF_STYLE(tinted light blue fill with a dark blue outline) if theplaceIdfor that feature is in our whitelist.
const SF_STYLE = {
  strokeColor: "#1d4ed8",
  strokeOpacity: 1,
  strokeWeight: 2.5,
  fillColor: "#3b82f6",
  fillOpacity: 0.25,
};

layer.style = (params) => {
  const placeId = params.feature.placeId;
  if (!SF_ZIP_PLACEIDS.has(placeId)) return null;

  return SF_STYLE;
};
Here's what the complete SinglePostalCodeLayer.jsx looks like.
/*** SinglePostalCodeLayer.jsx ***/
import { useEffect } from 'react';
import { useMap } from '@vis.gl/react-google-maps';

const SF_ZIP_PLACEIDS = new Set([
  'ChIJ61hhQeGAhYARo_x_aAlCar8'
]);

export default function PostalCodeLayer() {

  const map = useMap();

  useEffect(() => {
    if (!map) return;

    const layer = map.getFeatureLayer('POSTAL_CODE');
    if (!layer) {
      console.warn(
        'POSTAL_CODE feature layer not available. ' +
        'Check that your Map ID has the Postal Code layer enabled.'
      );
      return;
    }

    const SF_STYLE = {
        strokeColor: '#1d4ed8',
        strokeOpacity: 1,
        strokeWeight: 2.5,
        fillColor: '#3b82f6',
        fillOpacity: 0.25,
    };

    layer.style = (params) => {
        const placeId = params.feature.placeId;
        if (!SF_ZIP_PLACEIDS.has(placeId)) return null;

        return SF_STYLE;
    };

  }, [map]);

  return null;
}
Add interactivity to data driven styling by handling mouse events
Drawing a boundary is great and all, but a static polygon isn't very useful. To do real work, a map needs a way for users to poke around and surface the data they need, which in practice means wiring up hover and click handlers. The code below adds a hover effect: when the user mouses over the boundary, its stroke weight (thickness) increases.
/*** InteractivePostalCodeLayer.jsx ***/
import { useEffect, useRef } from 'react';
import { useMap } from '@vis.gl/react-google-maps';

const SF_ZIP_PLACEIDS = new Set([
  'ChIJ61hhQeGAhYARo_x_aAlCar8'
]);

const styleDefault = {
      strokeColor: '#1d4ed8',
      strokeOpacity: 1,
      strokeWeight: 2.5,
      fillColor: '#3b82f6',
      fillOpacity: 0.25, // ≥ 0.1 required to receive events
};

const styleHovered = {
  ...styleDefault,
  strokeWeight: 3.5,
};

export default function InteractivePostalCodeLayer() {

  const map = useMap();

  const hoveredIdRef = useRef(null);

  useEffect(() => {
    if (!map) return;

    const layer = map.getFeatureLayer('POSTAL_CODE');
    if (!layer) {
      console.warn(
        'POSTAL_CODE feature layer not available. ' +
        'Check that your Map ID has the Postal Code layer enabled.'
      );
      return;
    }

    const applyStyles = () => {
      layer.style = (params) => {
        const placeId = params.feature.placeId;
        if (!SF_ZIP_PLACEIDS.has(placeId)) return null;
        if (placeId === hoveredIdRef.current) return styleHovered;
        return styleDefault;
      };
    };

    applyStyles();

    const moveListener = layer.addListener('mousemove', (e) => {
      const placeId = e.features[0]?.placeId;
      const next = SF_ZIP_PLACEIDS.has(placeId) ? placeId : null;
      if (next !== hoveredIdRef.current) {
        hoveredIdRef.current = next;
        applyStyles();
        map.getDiv().style.cursor = next ? 'pointer' : '';
      }
    });

    const mapMoveListener = map.addListener('mousemove', () => {
      if (hoveredIdRef.current !== null) {
        hoveredIdRef.current = null;
        applyStyles();
        map.getDiv().style.cursor = '';
      }
    });

    return () => {
      layer.style = null;
      moveListener.remove();
      mapMoveListener.remove();
      map.getDiv().style.cursor = '';
    };

  }, [map]);

  return null;
}
Here are the key parts of the code that make this work (loosely based on the official feature layer events documentation):
First, we define two style objects in terms of one base and one hover style. Using the style spread pattern, we override strokeWeight to give the hovered polygon a thicker outline.
const styleDefault = {
  strokeColor: "#1d4ed8",
  strokeOpacity: 1,
  strokeWeight: 2.5,
  fillColor: "#3b82f6",
  fillOpacity: 0.25, // ≥ 0.1 required to receive events
};

const styleHovered = {
  ...styleDefault,
  strokeWeight: 3.5,
};
Next, we use useRef to track the placeId of the boundary currently being hovered.
const hoveredIdRef = useRef(null);
Inside the applyStyles() function, we check whether the feature's placeId matches the one stored in hoveredIdRef. If it does, we return styleHovered (thicker outline) otherwise we fall through to styleDefault.
const applyStyles = () => {
  layer.style = (params) => {
    const placeId = params.feature.placeId;
    if (!SF_ZIP_PLACEIDS.has(placeId)) return null;
    if (placeId === hoveredIdRef.current) return styleHovered;
    return styleDefault;
  };
};
After that we write a handler that runs whenever the mouse moves over the feature layer. It reads the placeId of the feature under the cursor, then sets next to that placeId if it's in our allowlist, or null otherwise. If next differs from hoveredIdRef.current (meaning the hovered feature has changed), it updates the ref, reapplies the styles, and switches the cursor to a pointer when hovering over an allowed boundary (or back to default when not).
const moveListener = layer.addListener("mousemove", (e) => {
  const placeId = e.features[0]?.placeId;
  const next = SF_ZIP_PLACEIDS.has(placeId) ? placeId : null;
  if (next !== hoveredIdRef.current) {
    hoveredIdRef.current = next;
    applyStyles();
    map.getDiv().style.cursor = next ? "pointer" : "";
  }
});
In addition, we need to register a mousemove listener on the map itself in addition to the feature layer so that when the cursor leaves the boundary polygon and moves onto the base map (roads, water, etc) the hover state clears.
const mapMoveListener = map.addListener("mousemove", () => {
  if (hoveredIdRef.current !== null) {
    hoveredIdRef.current = null;
    applyStyles();
    map.getDiv().style.cursor = "";
  }
});
Finally, we remove listeners and reset the cursor.
return () => {
  layer.style = null;
  moveListener.remove();
  mapMoveListener.remove();
  map.getDiv().style.cursor = "";
};
Without this cleanup, if the component is ever removed from the page, the event listeners would stay attached to the map forever, and the cursor could stay stuck as a pointer.
Making data driven styling clickable
The last thing we are going to do in this simple worked example is make the postal code boundary clickable. To do this, we need to make several modifications to our existing code.
- Add a new ref to track the selected place ID. Just like
hoveredIdRef, it's initialized asnullbecause nothing is selected on first render.
const clickedIdRef = useRef(null);- Next, we define a
styleClickedto increase the opacity (make darker) of the polygon boundary when clicked.
const styleClicked = {
  ...styleDefault,
  fillOpacity: 0.75,
};
- In the style function, add a new clicked check that runs before the hover check. Order matters: if a polygon is both clicked and hovered, this keeps it in the clicked style. Flip the order and the hover style would override the click, which feels wrong to users. The click should "win."
const applyStyles = () => {
  layer.style = (params) => {
    const placeId = params.feature.placeId;
    if (!SF_ZIP_PLACEIDS.has(placeId)) return null;
    if (placeId === clickedIdRef.current) return styleClicked;
    if (placeId === hoveredIdRef.current) return styleHovered;
    return styleDefault;
  };
};
- In the click listener, a ternary toggles selection: if the clicked
placeIdmatchesclickedIdRef.current, set the ref tonull(deselect). Otherwise, set it toplaceId(select or switch).
const clickListener = layer.addListener("click", (e) => {
  const placeId = e.features[0]?.placeId;
  if (!SF_ZIP_PLACEIDS.has(placeId)) return;
  clickedIdRef.current = placeId === clickedIdRef.current ? null : placeId;
  applyStyles();
});- Add
clickListener.remove();to the cleanup function. This mirrors how we handled the move listeners.
return () => {
  layer.style = null;
  moveListener.remove();
  mapMoveListener.remove();
  clickListener.remove(); // (4) cleanup
  map.getDiv().style.cursor = "";
};
The full code is shown below:
/*** InteractivePostalCodeLayerClickable.jsx ***/
import { useEffect, useRef } from "react";
import { useMap } from "@vis.gl/react-google-maps";

const SF_ZIP_PLACEIDS = new Set(["ChIJ61hhQeGAhYARo_x_aAlCar8"]);

const styleDefault = {
  strokeColor: "#1d4ed8",
  strokeOpacity: 1,
  strokeWeight: 2.5,
  fillColor: "#3b82f6",
  fillOpacity: 0.25,
};

const styleHovered = {
  ...styleDefault,
  strokeWeight: 3.5,
};

const styleClicked = {
  ...styleDefault,
  fillOpacity: 0.75,
};

export default function InteractivePostalCodeLayer() {
  const map = useMap();

  const hoveredIdRef = useRef(null);
  const clickedIdRef = useRef(null);

  useEffect(() => {
    if (!map) return;

    const layer = map.getFeatureLayer("POSTAL_CODE");
    if (!layer) {
      console.warn(
        "POSTAL_CODE feature layer not available. " +
          "Check that your Map ID has the Postal Code layer enabled.",
      );
      return;
    }

    const applyStyles = () => {
      layer.style = (params) => {
        const placeId = params.feature.placeId;
        if (!SF_ZIP_PLACEIDS.has(placeId)) return null;
        if (placeId === clickedIdRef.current) return styleClicked;
        if (placeId === hoveredIdRef.current) return styleHovered;
        return styleDefault;
      };
    };

    applyStyles();

    const moveListener = layer.addListener("mousemove", (e) => {
      const placeId = e.features[0]?.placeId;
      const next = SF_ZIP_PLACEIDS.has(placeId) ? placeId : null;
      if (next !== hoveredIdRef.current) {
        hoveredIdRef.current = next;
        applyStyles();
        map.getDiv().style.cursor = next ? "pointer" : "";
      }
    });

    const mapMoveListener = map.addListener("mousemove", () => {
      if (hoveredIdRef.current !== null) {
        hoveredIdRef.current = null;
        applyStyles();
        map.getDiv().style.cursor = "";
      }
    });

    const clickListener = layer.addListener("click", (e) => {
      const placeId = e.features[0]?.placeId;
      if (!SF_ZIP_PLACEIDS.has(placeId)) return;
      clickedIdRef.current = placeId === clickedIdRef.current ? null : placeId;
      applyStyles();
    });

    return () => {
      layer.style = null;
      moveListener.remove();
      mapMoveListener.remove();
      clickListener.remove();
      map.getDiv().style.cursor = "";
    };
  }, [map]);

  return null;
}
Show an info window on click
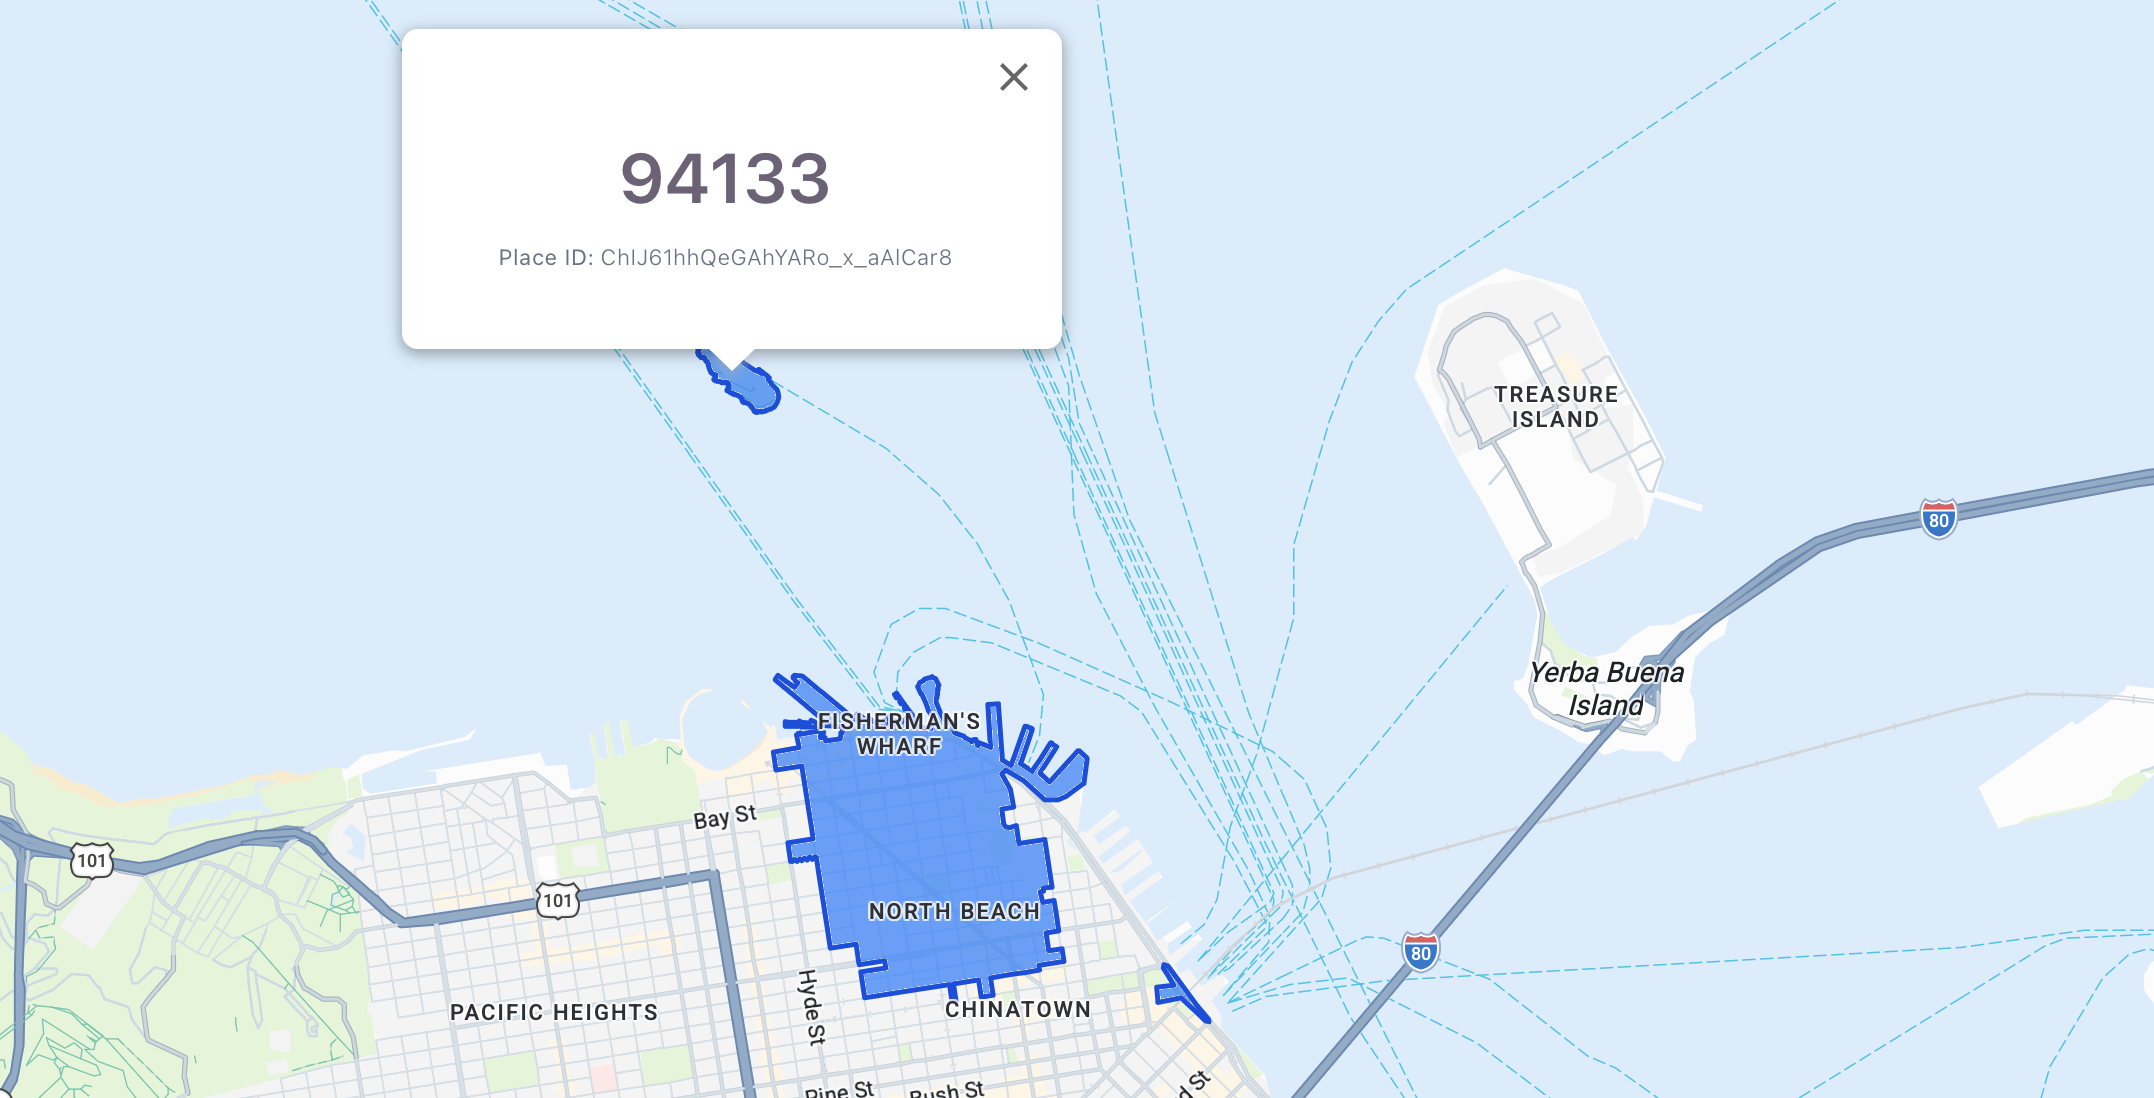
To surface more information about the boundary, we can pop up an info window on click. Here's the same file with an <InfoWindow/> component wired in: it opens when the user clicks the boundary, shows the place ID and fetchPlace details (the five digit postal code), and closes when they click the same polygon again.
/*** InteractivePostalCodeLayerInfoWindow.jsx ***/
import { useEffect, useRef, useState } from "react";
import { useMap, InfoWindow } from "@vis.gl/react-google-maps";

const SF_ZIP_PLACEIDS = new Set(["ChIJ61hhQeGAhYARo_x_aAlCar8"]);

const styleDefault = {
  strokeColor: "#1d4ed8",
  strokeOpacity: 1,
  strokeWeight: 2.5,
  fillColor: "#3b82f6",
  fillOpacity: 0.25,
};

const styleHovered = {
  ...styleDefault,
  strokeWeight: 3.5,
};

const styleClicked = {
  ...styleDefault,
  fillOpacity: 0.75,
};

export default function InteractivePostalCodeLayerInfoWindow() {
  const map = useMap();

  const hoveredIdRef = useRef(null);
  const clickedIdRef = useRef(null);

  const [selected, setSelected] = useState(null);

  useEffect(() => {
    if (!map) return;

    const layer = map.getFeatureLayer("POSTAL_CODE");
    if (!layer) {
      console.warn(
        "POSTAL_CODE feature layer not available. " +
          "Check that your Map ID has the Postal Code layer enabled.",
      );
      return;
    }

    const applyStyles = () => {
      layer.style = (params) => {
        const placeId = params.feature.placeId;
        if (!SF_ZIP_PLACEIDS.has(placeId)) return null;
        if (placeId === clickedIdRef.current) return styleClicked;
        if (placeId === hoveredIdRef.current) return styleHovered;
        return styleDefault;
      };
    };

    applyStyles();

    const moveListener = layer.addListener("mousemove", (e) => {
      const placeId = e.features[0]?.placeId;
      const next = SF_ZIP_PLACEIDS.has(placeId) ? placeId : null;
      if (next !== hoveredIdRef.current) {
        hoveredIdRef.current = next;
        applyStyles();
        map.getDiv().style.cursor = next ? "pointer" : "";
      }
    });

    const mapMoveListener = map.addListener("mousemove", () => {
      if (hoveredIdRef.current !== null) {
        hoveredIdRef.current = null;
        applyStyles();
        map.getDiv().style.cursor = "";
      }
    });

    const clickListener = layer.addListener("click", async (e) => {
      const feature = e.features[0];
      const placeId = feature?.placeId;
      if (!SF_ZIP_PLACEIDS.has(placeId)) return;

      const isDeselecting = placeId === clickedIdRef.current;
      clickedIdRef.current = isDeselecting ? null : placeId;
      applyStyles();

      if (isDeselecting) {
        setSelected(null);
        return;
      }

      const position = { lat: e.latLng.lat(), lng: e.latLng.lng() };
      setSelected({ placeId, position, place: null });

      try {
        const place = await feature.fetchPlace({
          fields: ["displayName", "formattedAddress", "types"],
        });

        if (clickedIdRef.current !== placeId) return;

        setSelected({ placeId, position, place });
      } catch (err) {
        console.error("fetchPlace failed:", err);
      }
    });

    return () => {
      layer.style = null;
      moveListener.remove();
      mapMoveListener.remove();
      clickListener.remove();
      map.getDiv().style.cursor = "";
    };
  }, [map]);

  // (4) Render the InfoWindow when something is selected.
  return selected ? (
    <InfoWindow
      position={selected.position}
      onCloseClick={() => {
        clickedIdRef.current = null;
        // applyStyles isn't reachable here, but reassigning style on the
        // layer would require lifting that helper. Simpler: just trigger a
        // re-render via setSelected, and the next click will restyle.
        setSelected(null);
      }}
    >
      <div
        style={{
          fontFamily: "system-ui, sans-serif",
          fontSize: 13,
          lineHeight: 1.5,
          minWidth: 300,
          minHeight: 100,
        }}
      >
        {selected.place ? (
          <>
            <div style={{ fontSize: 35, fontWeight: 600, marginBottom: 4 }}>
              {selected.place.displayName ?? "Unknown"}
            </div>
            <div
              style={{
                marginTop: 6,
                color: "#6b7280",
                fontSize: 11,
              }}
            >
              <strong>Place ID:</strong> {selected.placeId}
            </div>
          </>
        ) : (
          <>
            <div>
              <strong>Place ID:</strong> {selected.placeId}
            </div>
            <div
              style={{ marginTop: 4, fontStyle: "italic", color: "#6b7280" }}
            >
              Loading details…
            </div>
          </>
        )}
      </div>
    </InfoWindow>
  ) : null;
}
Here's how we made the InfoWindow show up when the user clicks the boundary. <InfoWindow/> is part of the @vis.gl/react-google-maps library, so don't forget to include it with import { useMap, InfoWindow } from "@vis.gl/react-google-maps";) :
First, we use useState to track which feature (polygon boundary) is selected. When the state changes, React re-renders and the<InfoWindow/> mounts or unmounts to match. The selected state holds a single object with three fields:
placeId: the clicked polygon's place ID, displayed in the InfoWindow and used in the stale response check.position: where to anchor the info window on the map.place: the details fromfetchPlace, ornullwhile they're still loading.
const [selected, setSelected] = useState(null);Second, in the click listener, we detect whether the user is clicking an already selected polygon to deselect it.
const clickListener = layer.addListener("click", async (e) => {
  //... some code

  const isDeselecting = placeId === clickedIdRef.current;
  clickedIdRef.current = isDeselecting ? null : placeId;
  applyStyles();

  if (isDeselecting) {
    setSelected(null);
    return;
  }

  //... more code
});
Further down in the click listener, we save the location of the user's mouse click and update the selected state variable. Then we use the built in fetchPlace() method to asynchronously retrieve the boundary's displayName. For a postal code boundary, this is simply the five digit postal code. The fetchPlace() method isn't free. It is a wrapper for a Place Details API call which is billed at $5 CPM.
const clickListener = layer.addListener("click", async (e) => {
  const feature = e.features[0];
  const placeId = feature?.placeId;
  if (!SF_ZIP_PLACEIDS.has(placeId)) return;

  //... polygon deselect logic

  const position = { lat: e.latLng.lat(), lng: e.latLng.lng() };
  setSelected({ placeId, position, place: null });

  try {
    const place = await feature.fetchPlace({
      fields: ["displayName", "formattedAddress", "types"],
    });

    if (clickedIdRef.current !== placeId) return;

    setSelected({ placeId, position, place });
  } catch (err) {
    console.error("fetchPlace failed:", err);
  }
});
Finally, we use a conditional render (a common React pattern) to display the info window if selected is truthy i.e. it is a a real object like { placeId, position, place }).
return selected ? (
  <InfoWindow
    position={selected.position}
    onCloseClick={() => {
      clickedIdRef.current = null;
      setSelected(null);
    }}
  >
    <div
      style={{
        fontFamily: "system-ui, sans-serif",
        fontSize: 13,
        lineHeight: 1.5,
        minWidth: 300,
        minHeight: 100,
      }}
    >
      {selected.place ? (
        <>
          <div style={{ fontSize: 35, fontWeight: 600, marginBottom: 4 }}>
            {selected.place.displayName ?? "Unknown"}
          </div>
          <div
            style={{
              marginTop: 6,
              color: "#6b7280",
              fontSize: 11,
            }}
          >
            <strong>Place ID:</strong> {selected.placeId}
          </div>
        </>
      ) : (
        <>
          <div>
            <strong>Place ID:</strong> {selected.placeId}
          </div>
          <div style={{ marginTop: 4, fontStyle: "italic", color: "#6b7280" }}>
            Loading details…
          </div>
        </>
      )}
    </div>
  </InfoWindow>
) : null;
Data driven styling for boundaries (multiple)
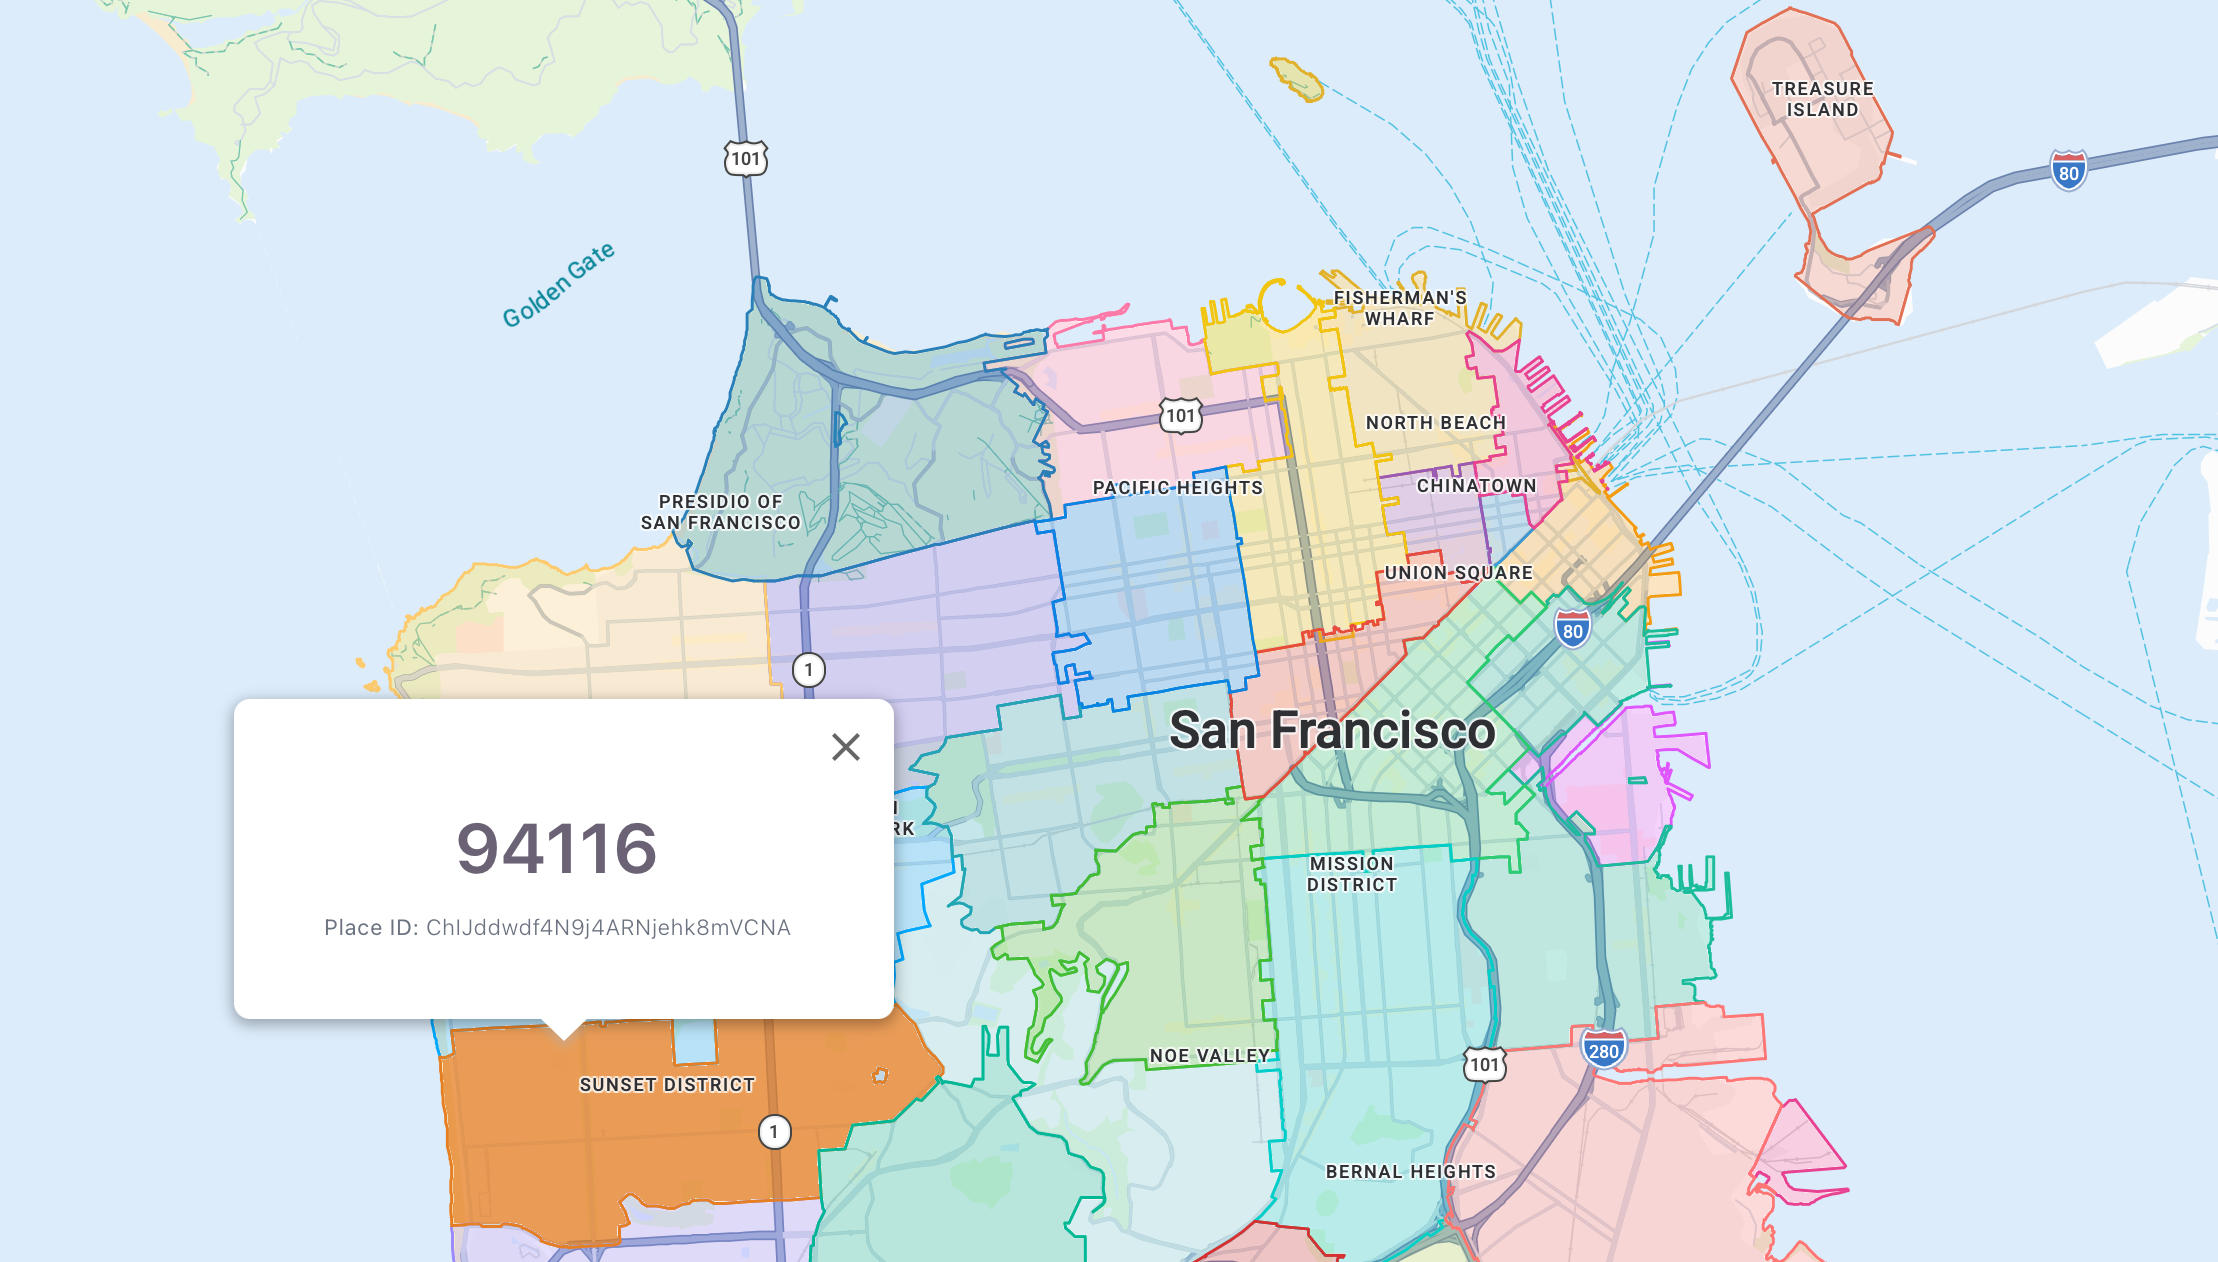
Extending our data driven styling example to multiple postal codes is straightforward: replace the single place ID check with a lookup table keyed by place ID, and have the style function return a style based on the value for each one. There is one big caveat. You must have resolved those place IDs in the first place. For San Francisco 27 postal codes, that's a one time geocoding step you need to do (and pay for) before any of this works.
First, put all 27 San Francisco postal code Place IDs into the allowlist:
const SF_ZIP_PLACEIDS = new Set([
  "ChIJs88qnZmAhYARk8u-7t1Sc2g",
  "ChIJ09mpM52AhYARm2WOMfyfxhs",
  "ChIJD6M14YmAhYAR5WVbcn7uWPk",
  "ChIJDXK6UmKAhYARfzuOY6DDgeM",
  "ChIJg0__2jN-j4AR479OXNRG7O8",
  "ChIJx5rJUYyAhYARxagLGBVGeFs",
  "ChIJy0ilcOmAhYARCLOo6oZQNxk",
  "ChIJjxQcAEF-j4ARegNFVBwq4vg",
  "ChIJ49w0El-AhYAR9WVSnuOiWM8",
  "ChIJ_wUjuoN-j4ARLYl5YXTu7iQ",
  "ChIJ_dA2rgV-j4ARt3snzTZ80Ds",
  "ChIJzyP3rbeAhYARTmAfNPJZzeY",
  "ChIJddwdf4N9j4ARNjehk8mVCNA",
  "ChIJ773z7quAhYARnGZ-5ZUIkcg",
  "ChIJE8NGljiHhYARnSY8nSgLJkk",
  "ChIJ-6VsK6aHhYARhH00Wvw4WGs",
  "ChIJaZi-WHqHhYARP44d5B8lUhI",
  "ChIJrYrvSdeAhYARtJlHJMWNQzY",
  "ChIJe7_iURF_j4ARlf3H78H0YTk",
  "ChIJK9xbjZR9j4ARBsVPOdGWHs8",
  "ChIJ80PrL8OGhYARiuhtoI_sR0s",
  "ChIJTyCM6zGAhYARWkaPBK60p6Q",
  "ChIJ22y0JQt-j4ARCs3ThPYOWpc",
  "ChIJSbCANq99j4ARVMl6KzrGk9c",
  "ChIJ61hhQeGAhYARo_x_aAlCar8",
  "ChIJJ3mtweZ-j4AR2LF94NUnNKI",
  "ChIJTayi3tN_j4ARIwuQJy7-etE",
]);
Next, add a placeId-to-color mapping. These colors come from Flat UI Colors, drawn from its v1, American, British, and Aussie palettes, using only the bright, saturated shades that stand out against a grayscale base map.
const colorByPlaceId = {
  "ChIJs88qnZmAhYARk8u-7t1Sc2g": "#e74c3c", // Alizarin (v1)
  "ChIJ09mpM52AhYARm2WOMfyfxhs": "#2ecc71", // Emerald (v1)
  "ChIJD6M14YmAhYAR5WVbcn7uWPk": "#3498db", // Peter River (v1)
  "ChIJDXK6UmKAhYARfzuOY6DDgeM": "#f39c12", // Orange (v1)
  "ChIJg0__2jN-j4AR479OXNRG7O8": "#1abc9c", // Turquoise (v1)
  "ChIJx5rJUYyAhYARxagLGBVGeFs": "#9b59b6", // Amethyst (v1)
  "ChIJy0ilcOmAhYARCLOo6oZQNxk": "#f1c40f", // Sun Flower (v1)
  "ChIJjxQcAEF-j4ARegNFVBwq4vg": "#00cec9", // Robin's Egg Blue (US)
  "ChIJ49w0El-AhYAR9WVSnuOiWM8": "#e84393", // Prunus Avium (US)
  "ChIJ_wUjuoN-j4ARLYl5YXTu7iQ": "#d63031", // Chi-Gong (US)
  "ChIJ_dA2rgV-j4ARt3snzTZ80Ds": "#44bd32", // Skirret Green (GB)
  "ChIJzyP3rbeAhYARTmAfNPJZzeY": "#0984e3", // Electron Blue (US)
  "ChIJddwdf4N9j4ARNjehk8mVCNA": "#e67e22", // Carrot (v1)
  "ChIJ773z7quAhYARnGZ-5ZUIkcg": "#22a6b3", // Greenland Green (AU)
  "ChIJE8NGljiHhYARnSY8nSgLJkk": "#6c5ce7", // Exodus Fruit (US)
  "ChIJ-6VsK6aHhYARhH00Wvw4WGs": "#fdcb6e", // Bright Yarrow (US)
  "ChIJaZi-WHqHhYARP44d5B8lUhI": "#00a8ff", // Protoss Pylon (GB)
  "ChIJrYrvSdeAhYARtJlHJMWNQzY": "#fd79a8", // Pico-8 Pink (US)
  "ChIJe7_iURF_j4ARlf3H78H0YTk": "#ff7675", // Pink Glamour (US)
  "ChIJK9xbjZR9j4ARBsVPOdGWHs8": "#00b894", // Mint Leaf (US)
  "ChIJ80PrL8OGhYARiuhtoI_sR0s": "#2980b9", // Belize Hole (v1)
  "ChIJTyCM6zGAhYARWkaPBK60p6Q": "#e17055", // Orangeville (US)
  "ChIJ22y0JQt-j4ARCs3ThPYOWpc": "#7ed6df", // Middle Blue (AU)
  "ChIJSbCANq99j4ARVMl6KzrGk9c": "#9c88ff", // Periwinkle (GB)
  "ChIJ61hhQeGAhYARo_x_aAlCar8": "#e1b12c", // Nanohanacha Gold (GB)
  "ChIJJ3mtweZ-j4AR2LF94NUnNKI": "#badc58", // June Bud (AU)
  "ChIJTayi3tN_j4ARIwuQJy7-etE": "#e056fd", // Heliotrope (AU)
};
Third, styleDefault can no longer be static. Each polygon now needs its own fillColor and strokeColor, so the style has to be computed per feature instead of declared upfront. To do this, we add a small helper function that returns a style object.
const makeStyle = (color) => ({
  strokeColor: color,
  strokeOpacity: 1,
  strokeWeight: 1.5,
  fillColor: color,
  fillOpacity: 0.25,
});
Inside the style function, we look up the feature's color, build a base style with it, and return that base, or a variant with hover or click modifications applied via spread.
const applyStyles = () => {
  layer.style = (params) => {
    const placeId = params.feature.placeId;
    if (!SF_ZIP_PLACEIDS.has(placeId)) return null;

    const base = makeStyle(colorByPlaceId[placeId]);
    if (placeId === clickedIdRef.current) return { ...base, fillOpacity: 0.75 };
    if (placeId === hoveredIdRef.current) return { ...base, strokeWeight: 2.5 };
    return base;
  };
Everything else has stayed the same. Listeners, refs, InfoWindow, cleanup. Support for multiple postal codes is fully contained in the data and the style function. Here's what the code looks like.
/*** MultiplePostalCodeInteractive.jsx ***/
import { useEffect, useRef, useState } from "react";
import { useMap, InfoWindow } from "@vis.gl/react-google-maps";

const SF_ZIP_PLACEIDS = new Set([
  "ChIJs88qnZmAhYARk8u-7t1Sc2g",
  "ChIJ09mpM52AhYARm2WOMfyfxhs",
  "ChIJD6M14YmAhYAR5WVbcn7uWPk",
  "ChIJDXK6UmKAhYARfzuOY6DDgeM",
  "ChIJg0__2jN-j4AR479OXNRG7O8",
  "ChIJx5rJUYyAhYARxagLGBVGeFs",
  "ChIJy0ilcOmAhYARCLOo6oZQNxk",
  "ChIJjxQcAEF-j4ARegNFVBwq4vg",
  "ChIJ49w0El-AhYAR9WVSnuOiWM8",
  "ChIJ_wUjuoN-j4ARLYl5YXTu7iQ",
  "ChIJ_dA2rgV-j4ARt3snzTZ80Ds",
  "ChIJzyP3rbeAhYARTmAfNPJZzeY",
  "ChIJddwdf4N9j4ARNjehk8mVCNA",
  "ChIJ773z7quAhYARnGZ-5ZUIkcg",
  "ChIJE8NGljiHhYARnSY8nSgLJkk",
  "ChIJ-6VsK6aHhYARhH00Wvw4WGs",
  "ChIJaZi-WHqHhYARP44d5B8lUhI",
  "ChIJrYrvSdeAhYARtJlHJMWNQzY",
  "ChIJe7_iURF_j4ARlf3H78H0YTk",
  "ChIJK9xbjZR9j4ARBsVPOdGWHs8",
  "ChIJ80PrL8OGhYARiuhtoI_sR0s",
  "ChIJTyCM6zGAhYARWkaPBK60p6Q",
  "ChIJ22y0JQt-j4ARCs3ThPYOWpc",
  "ChIJSbCANq99j4ARVMl6KzrGk9c",
  "ChIJ61hhQeGAhYARo_x_aAlCar8",
  "ChIJJ3mtweZ-j4AR2LF94NUnNKI",
  "ChIJTayi3tN_j4ARIwuQJy7-etE",
]);

const colorByPlaceId = {
  "ChIJs88qnZmAhYARk8u-7t1Sc2g": "#e74c3c", // Alizarin (v1)
  "ChIJ09mpM52AhYARm2WOMfyfxhs": "#2ecc71", // Emerald (v1)
  "ChIJD6M14YmAhYAR5WVbcn7uWPk": "#3498db", // Peter River (v1)
  "ChIJDXK6UmKAhYARfzuOY6DDgeM": "#f39c12", // Orange (v1)
  "ChIJg0__2jN-j4AR479OXNRG7O8": "#1abc9c", // Turquoise (v1)
  "ChIJx5rJUYyAhYARxagLGBVGeFs": "#9b59b6", // Amethyst (v1)
  "ChIJy0ilcOmAhYARCLOo6oZQNxk": "#f1c40f", // Sun Flower (v1)
  "ChIJjxQcAEF-j4ARegNFVBwq4vg": "#00cec9", // Robin's Egg Blue (US)
  "ChIJ49w0El-AhYAR9WVSnuOiWM8": "#e84393", // Prunus Avium (US)
  "ChIJ_wUjuoN-j4ARLYl5YXTu7iQ": "#d63031", // Chi-Gong (US)
  "ChIJ_dA2rgV-j4ARt3snzTZ80Ds": "#44bd32", // Skirret Green (GB)
  "ChIJzyP3rbeAhYARTmAfNPJZzeY": "#0984e3", // Electron Blue (US)
  "ChIJddwdf4N9j4ARNjehk8mVCNA": "#e67e22", // Carrot (v1)
  "ChIJ773z7quAhYARnGZ-5ZUIkcg": "#22a6b3", // Greenland Green (AU)
  "ChIJE8NGljiHhYARnSY8nSgLJkk": "#6c5ce7", // Exodus Fruit (US)
  "ChIJ-6VsK6aHhYARhH00Wvw4WGs": "#fdcb6e", // Bright Yarrow (US)
  "ChIJaZi-WHqHhYARP44d5B8lUhI": "#00a8ff", // Protoss Pylon (GB)
  "ChIJrYrvSdeAhYARtJlHJMWNQzY": "#fd79a8", // Pico-8 Pink (US)
  "ChIJe7_iURF_j4ARlf3H78H0YTk": "#ff7675", // Pink Glamour (US)
  "ChIJK9xbjZR9j4ARBsVPOdGWHs8": "#00b894", // Mint Leaf (US)
  "ChIJ80PrL8OGhYARiuhtoI_sR0s": "#2980b9", // Belize Hole (v1)
  "ChIJTyCM6zGAhYARWkaPBK60p6Q": "#e17055", // Orangeville (US)
  "ChIJ22y0JQt-j4ARCs3ThPYOWpc": "#7ed6df", // Middle Blue (AU)
  "ChIJSbCANq99j4ARVMl6KzrGk9c": "#9c88ff", // Periwinkle (GB)
  "ChIJ61hhQeGAhYARo_x_aAlCar8": "#e1b12c", // Nanohanacha Gold (GB)
  "ChIJJ3mtweZ-j4AR2LF94NUnNKI": "#badc58", // June Bud (AU)
  "ChIJTayi3tN_j4ARIwuQJy7-etE": "#e056fd", // Heliotrope (AU)
};

const makeStyle = (color) => ({
  strokeColor: color,
  strokeOpacity: 1,
  strokeWeight: 1.5,
  fillColor: color,
  fillOpacity: 0.25,
});

export default function MultiplePostalCodeLayer() {
  const map = useMap();

  const hoveredIdRef = useRef(null);
  const clickedIdRef = useRef(null);

  const [selected, setSelected] = useState(null);

  useEffect(() => {
    if (!map) return;

    const layer = map.getFeatureLayer("POSTAL_CODE");
    if (!layer) {
      console.warn(
        "POSTAL_CODE feature layer not available. " +
          "Check that your Map ID has the Postal Code layer enabled.",
      );
      return;
    }

    const applyStyles = () => {
      layer.style = (params) => {
        const placeId = params.feature.placeId;
        if (!SF_ZIP_PLACEIDS.has(placeId)) return null;

        const base = makeStyle(colorByPlaceId[placeId]);
        if (placeId === clickedIdRef.current) return { ...base, fillOpacity: 0.75 };
        if (placeId === hoveredIdRef.current) return { ...base, strokeWeight: 2.5 };
        return base;
      };
    };

    applyStyles();

    const moveListener = layer.addListener("mousemove", (e) => {
      const placeId = e.features[0]?.placeId;
      const next = SF_ZIP_PLACEIDS.has(placeId) ? placeId : null;
      if (next !== hoveredIdRef.current) {
        hoveredIdRef.current = next;
        applyStyles();
        map.getDiv().style.cursor = next ? "pointer" : "";
      }
    });

    const mapMoveListener = map.addListener("mousemove", () => {
      if (hoveredIdRef.current !== null) {
        hoveredIdRef.current = null;
        applyStyles();
        map.getDiv().style.cursor = "";
      }
    });

    const clickListener = layer.addListener("click", async (e) => {
      const feature = e.features[0];
      const placeId = feature?.placeId;
      if (!SF_ZIP_PLACEIDS.has(placeId)) return;

      const isDeselecting = placeId === clickedIdRef.current;
      clickedIdRef.current = isDeselecting ? null : placeId;
      applyStyles();

      if (isDeselecting) {
        setSelected(null);
        return;
      }

      const position = { lat: e.latLng.lat(), lng: e.latLng.lng() };
      setSelected({ placeId, position, place: null });

      try {
        const place = await feature.fetchPlace({
          fields: ["displayName", "formattedAddress", "types"],
        });

        if (clickedIdRef.current !== placeId) return;

        setSelected({ placeId, position, place });
      } catch (err) {
        console.error("fetchPlace failed:", err);
      }
    });

    return () => {
      layer.style = null;
      moveListener.remove();
      mapMoveListener.remove();
      clickListener.remove();
      map.getDiv().style.cursor = "";
    };
  }, [map]);

  return selected ? (
    <InfoWindow
      position={selected.position}
      onCloseClick={() => {
        clickedIdRef.current = null;
        setSelected(null);
      }}
    >
      <div
        style={{
          fontFamily: "system-ui, sans-serif",
          fontSize: 13,
          lineHeight: 1.5,
          minWidth: 300,
          minHeight: 100,
        }}
      >
        {selected.place ? (
          <>
            <div style={{ fontSize: 35, fontWeight: 600, marginBottom: 4 }}>
              {selected.place.displayName ?? "Unknown"}
            </div>
            <div
              style={{
                marginTop: 6,
                color: "#6b7280",
                fontSize: 11,
              }}
            >
              <strong>Place ID:</strong> {selected.placeId}
            </div>
          </>
        ) : (
          <>
            <div>
              <strong>Place ID:</strong> {selected.placeId}
            </div>
            <div style={{ marginTop: 4, fontStyle: "italic", color: "#6b7280" }}>
              Loading details…
            </div>
          </>
        )}
      </div>
    </InfoWindow>
  ) : null;
}
My thoughts on Google Maps data driven styling for boundaries
A map can show patterns in your data that a table can't. But sourcing, updating, and maintaining your own boundary data takes serious time and money. For years, one of the most common feature requests from Google Maps customers has been access to the same boundaries Google uses internally. Data driven styling for boundaries solves this problem and opens up use cases across industries:
- Real estate: show whether a listing is in the buyer's target ZIP, school district, or flood zone.
- Travel: highlight which neighborhood a hotel sits in and what's nearby.
- Government and education: build choropleths of demographics, school performance, or election results by administrative level.
- News and media: power interactive maps that let readers explore a story spatially.
That said, Google's boundary coverage is uneven outside the US. Postal codes are available in only about 20 countries. Its notably missing Canada, the UK, Australia, and Brazil and the more granular layers (locality, school district) are even thinner. If your use case lives outside that footprint, Mapbox Boundaries is often the better option, with deeper international coverage including political boundaries, school districts, and neighborhoods.
If you still want to use Google Maps for boundaries Google doesn't have e.g. Canadian postal codes, custom sales territories, neighborhood polygons, anything not in their coverage list, the answer is data driven styling for datasets. You upload the polygons to Google Cloud as a dataset, then style them with the same FeatureStyleFunction pattern this post used. We'll cover this in a future post.
In the next tutorial, I'll show you how to pair Google's boundary data with your own to build an interactive heat map of median household income across San Francisco by postal code.
This article was written by Afi Labs, a Google Maps Platform Premier Partner and reseller. We build route optimization, navigation, and fleet tracking software on Google Maps, and offer volume pricing on GMP licensing. Talk to an engineer or follow Afian on LinkedIn.
Next: Part 5: Create a heatmap in Google Maps with data driven styling