
Upload and style datasets using the Maps Datasets API
How to use the Google Maps Datasets API to upload, store, and manage your geospatial data in the Google Cloud Console.

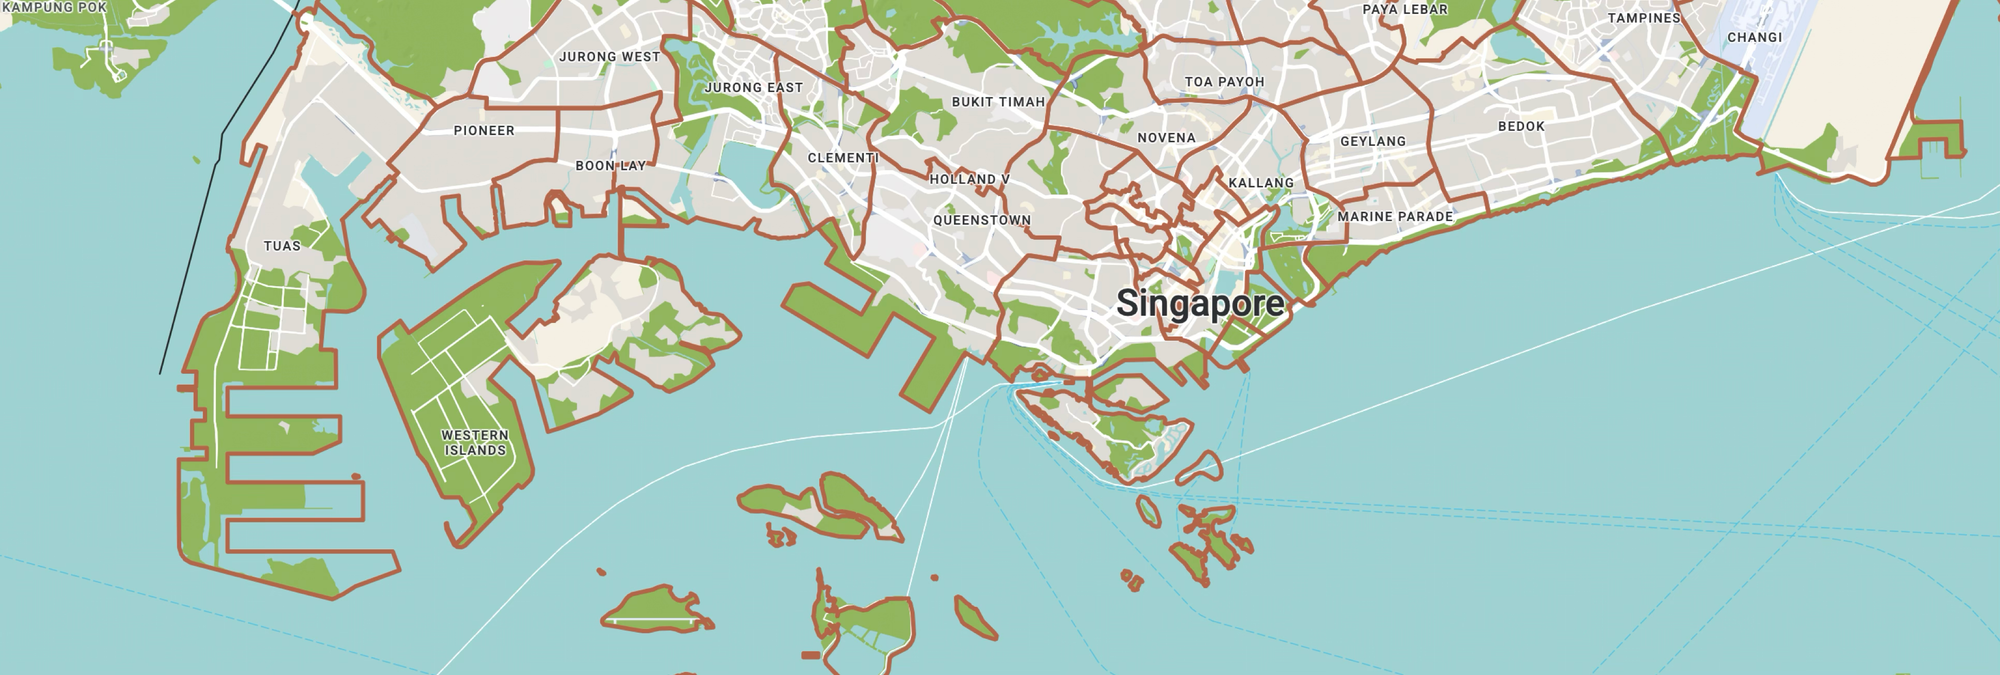
In this blog post, I'll show you how to use the Maps Datasets API to upload and manage geospatial data for data driven styling. We'll publish the Urban Redevelopment Authority 2019 Masterplan Area Boundary dataset via API, and use that to draw Singapore's planning boundaries on an interactive Google Map.
Part 1: Style a Google Map any way you want
Part 2: Apply styles for Google Maps using JSON style arrays
Part 3: Cloud based map styling for Google Maps
Part 4: Google Maps data driven styling for boundaries
Part 5: Create a heatmap in Google Maps with data driven styling
Part 6: Upload and style datasets using the Maps Datasets API (this article)
Part 7: Add data to Google Maps with data driven styling
What is the Maps Datasets API?
The Maps Datasets API lets you create and manage datasets programmatically instead of uploading files through the Google Cloud Console. This is useful when your data updates on a schedule or comes from another system so you can automate the upload rather than doing it by hand each time.
How does the Maps Datasets API work?
The two main endpoints of the Maps Datasets API are create and import: you first create a dataset, then import your data into it. The dataset holds your geospatial data, uploaded to your Google Cloud project.
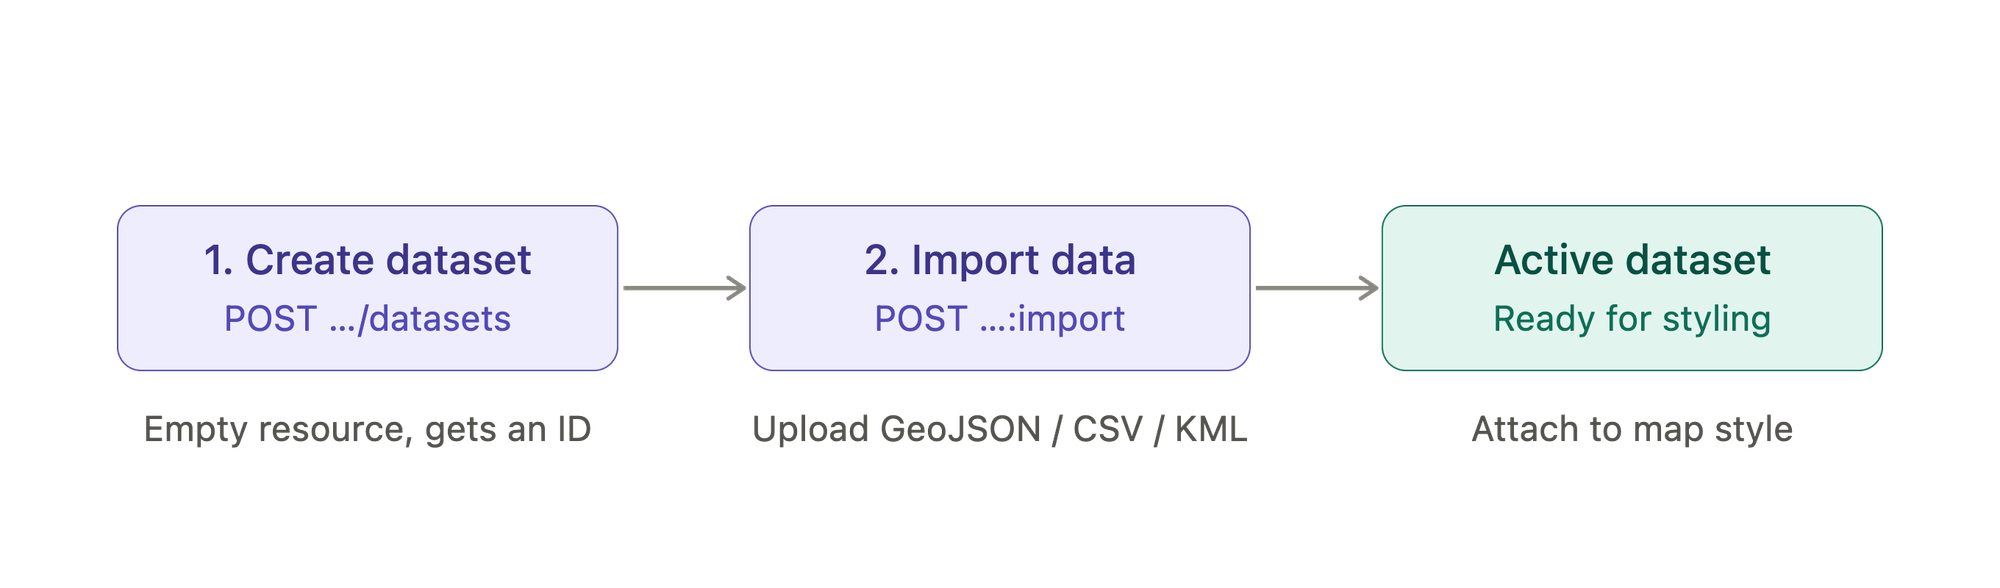
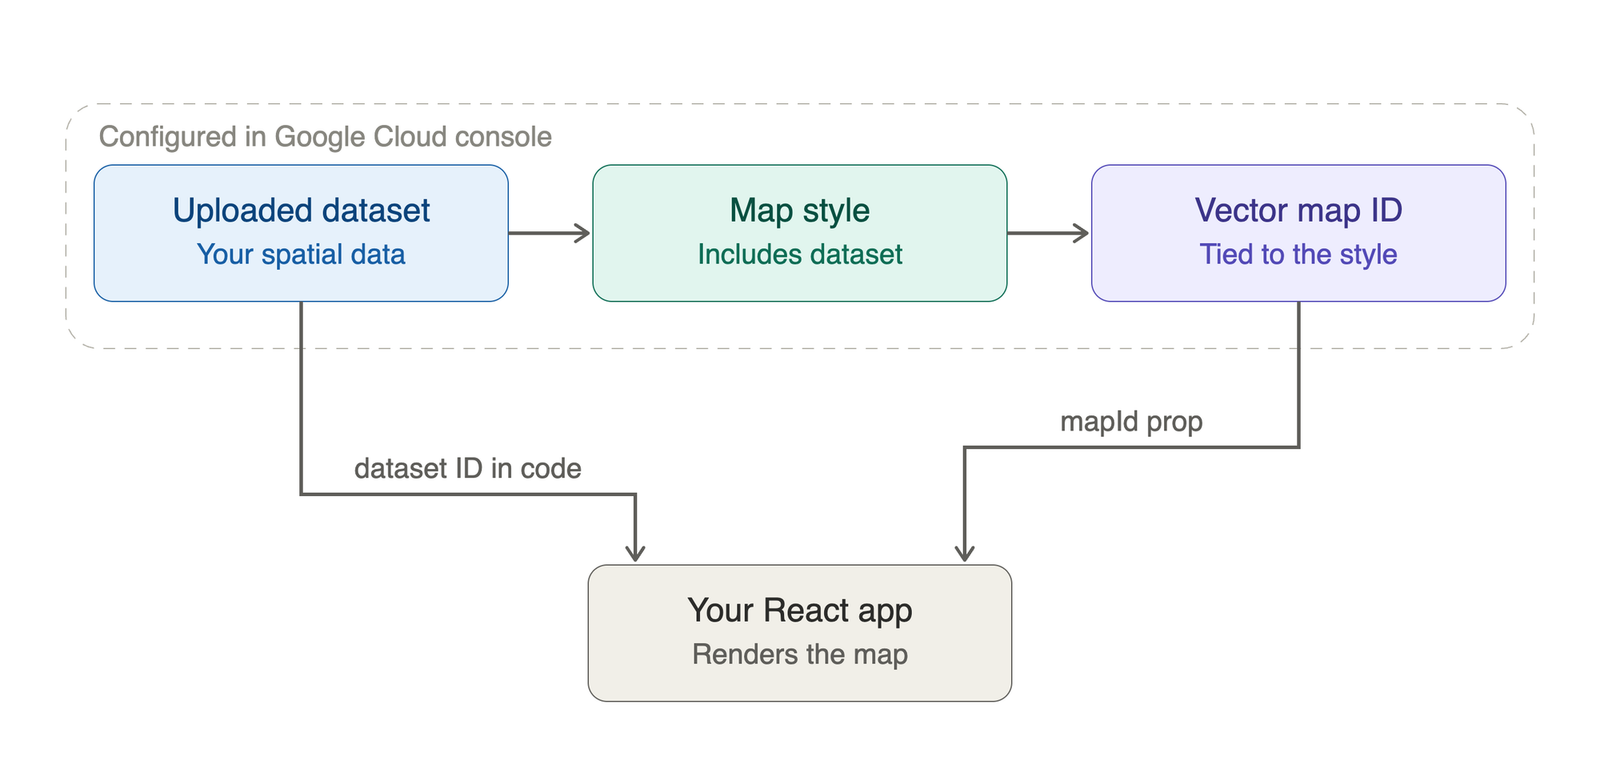
Once that is done, you associate that dataset with a map style, which controls how your map looks. The style, in turn, is attached to a map ID, the identifier your application passes when it loads the map. When the map loads with that ID, Google bakes your dataset's features into the map's vector tiles, ready for your code to style and make interactive.
Maps Datasets API worked example
The easiest way to explain the how the API works is with a real world example. We'll upload and style the planning area boundaries that Singapore's Urban Redevelopment Authority (URA) uses to manage land use across the city to guide development and support economic growth. These boundaries come from the Master Plan, most recently released in 2019.
Acquire Data
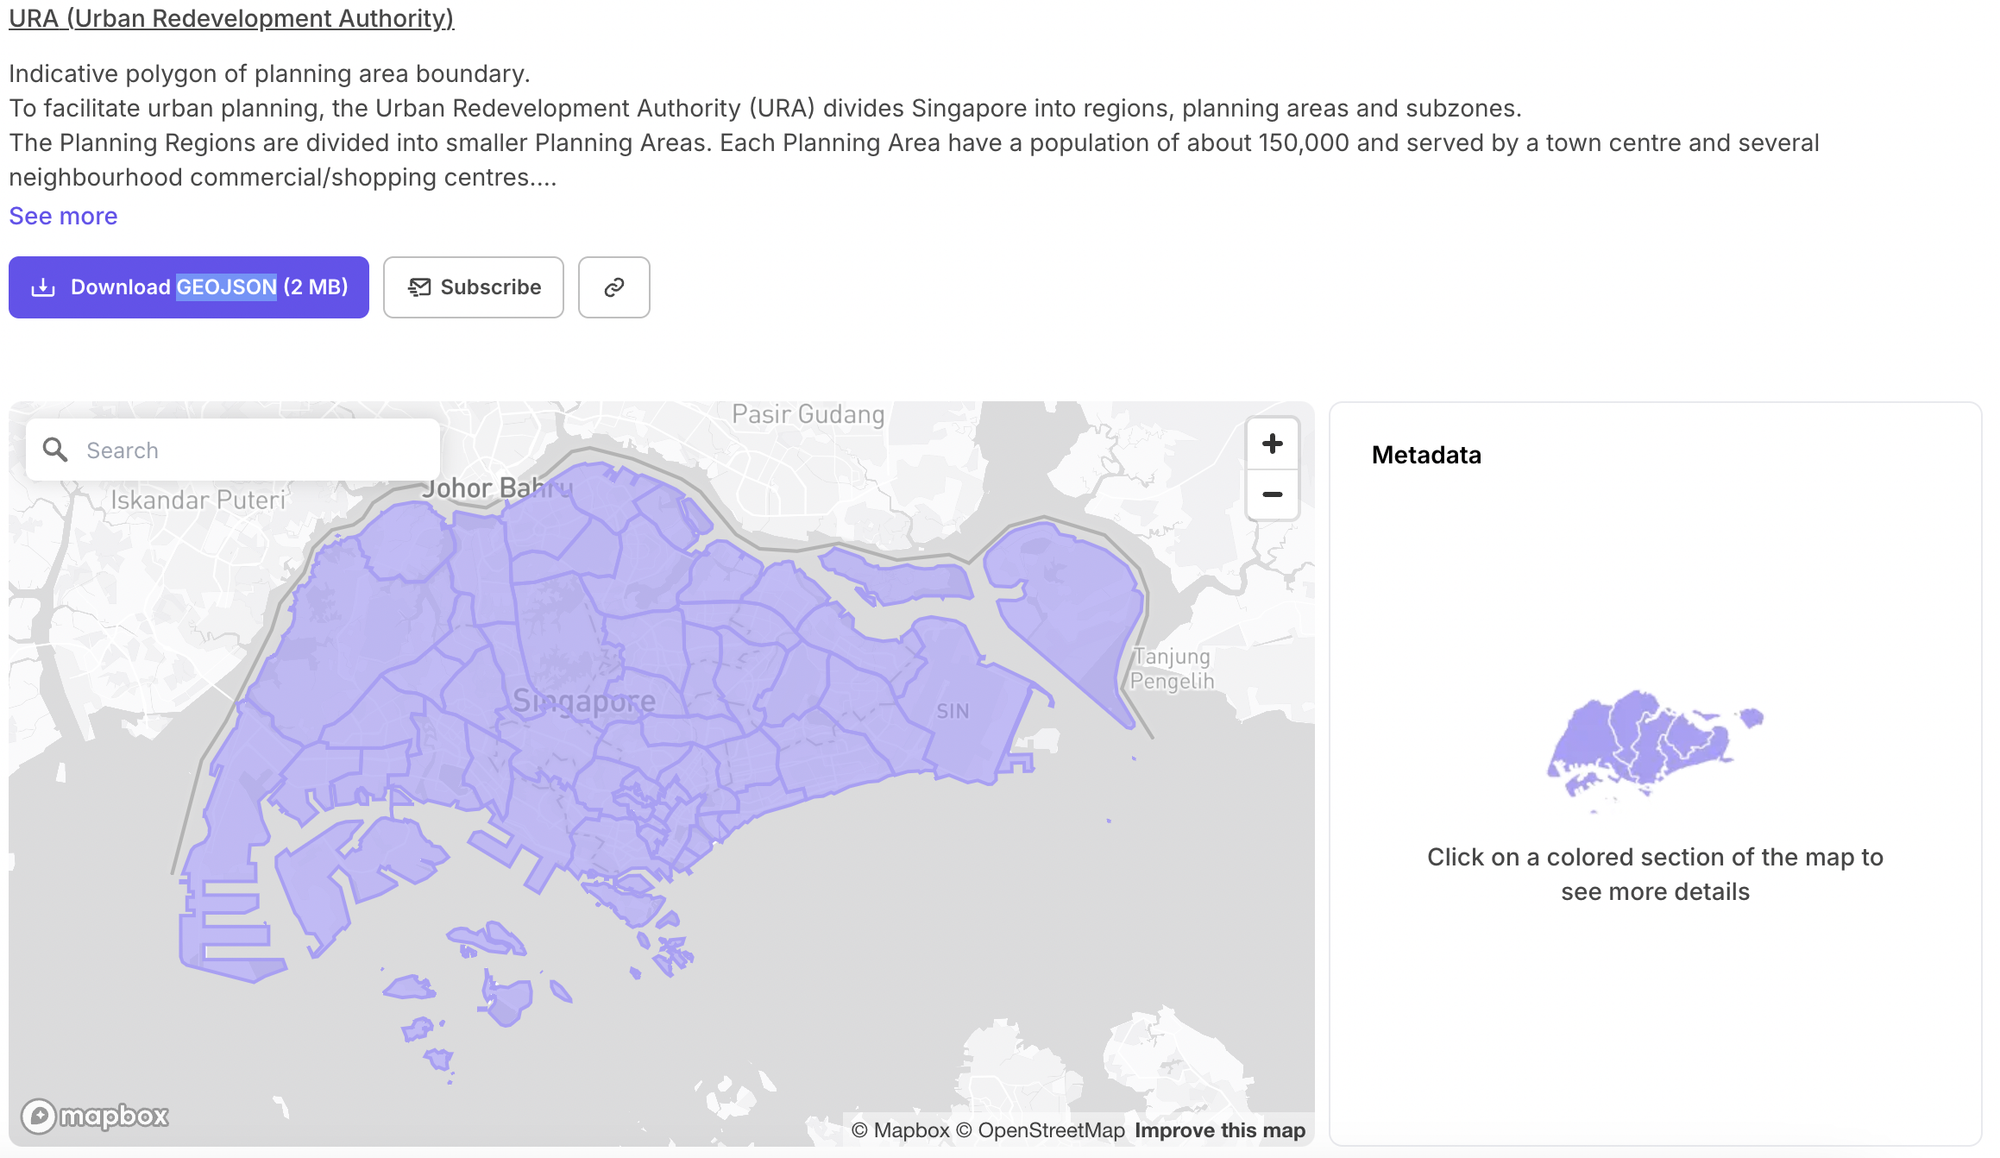
Head over to the Master Plan 2019 Planning Area Boundary page on data.gov.sg and download the dataset (or use this link).
Save the dataset to a new folder on your local machine. Once that is done, we'll need to create a Google Cloud project to host the data.
Create a Google Cloud Project
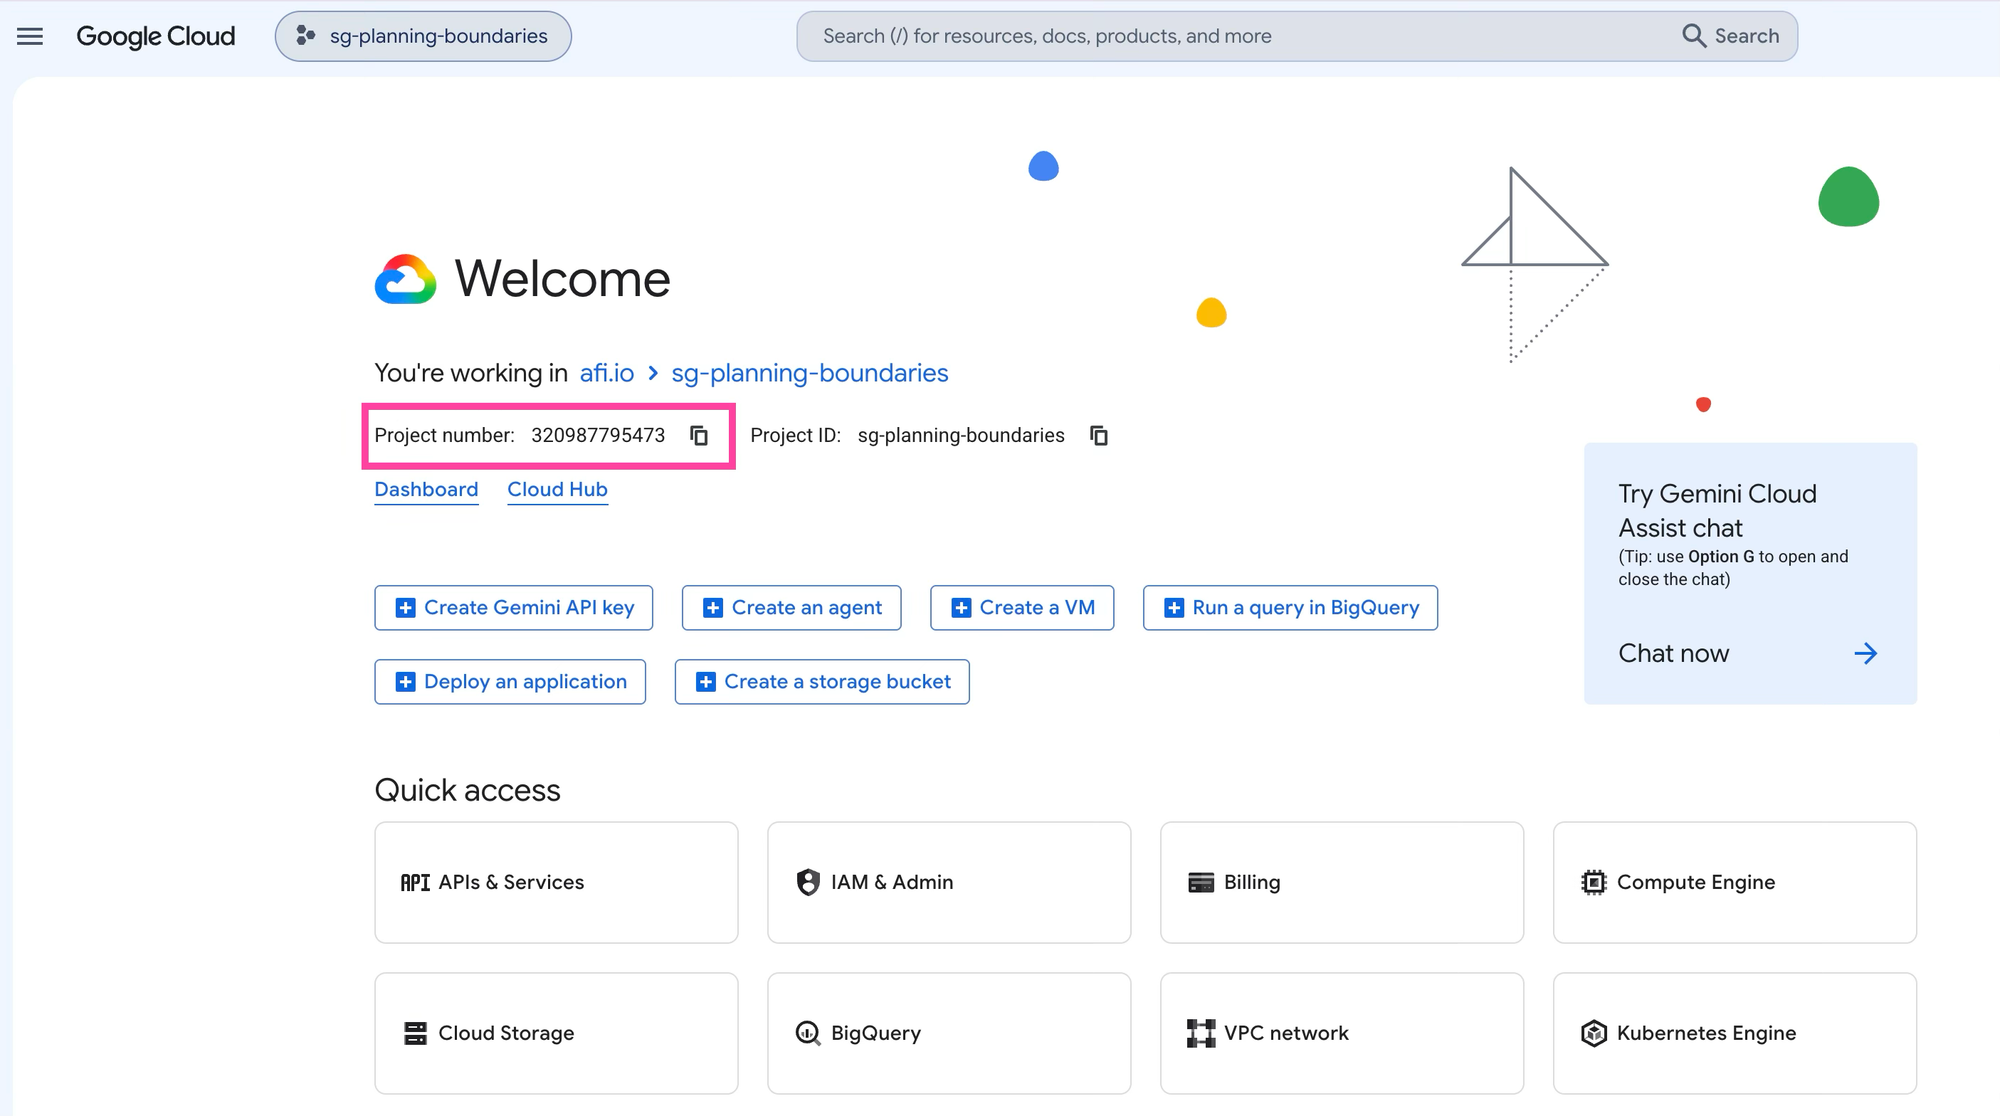
Go to console.cloud.google.com, click the project selector in the top bar, then [New Project]. Give it a descriptive name e.g. sg-planning-boundaries and note the auto generated project ID. We'll need it later, since the Maps Datasets API endpoints are keyed to the project e.g. /v1/projects/{PROJECT_ID}/datasets. Click [Create].
Enable the Maps Datasets API
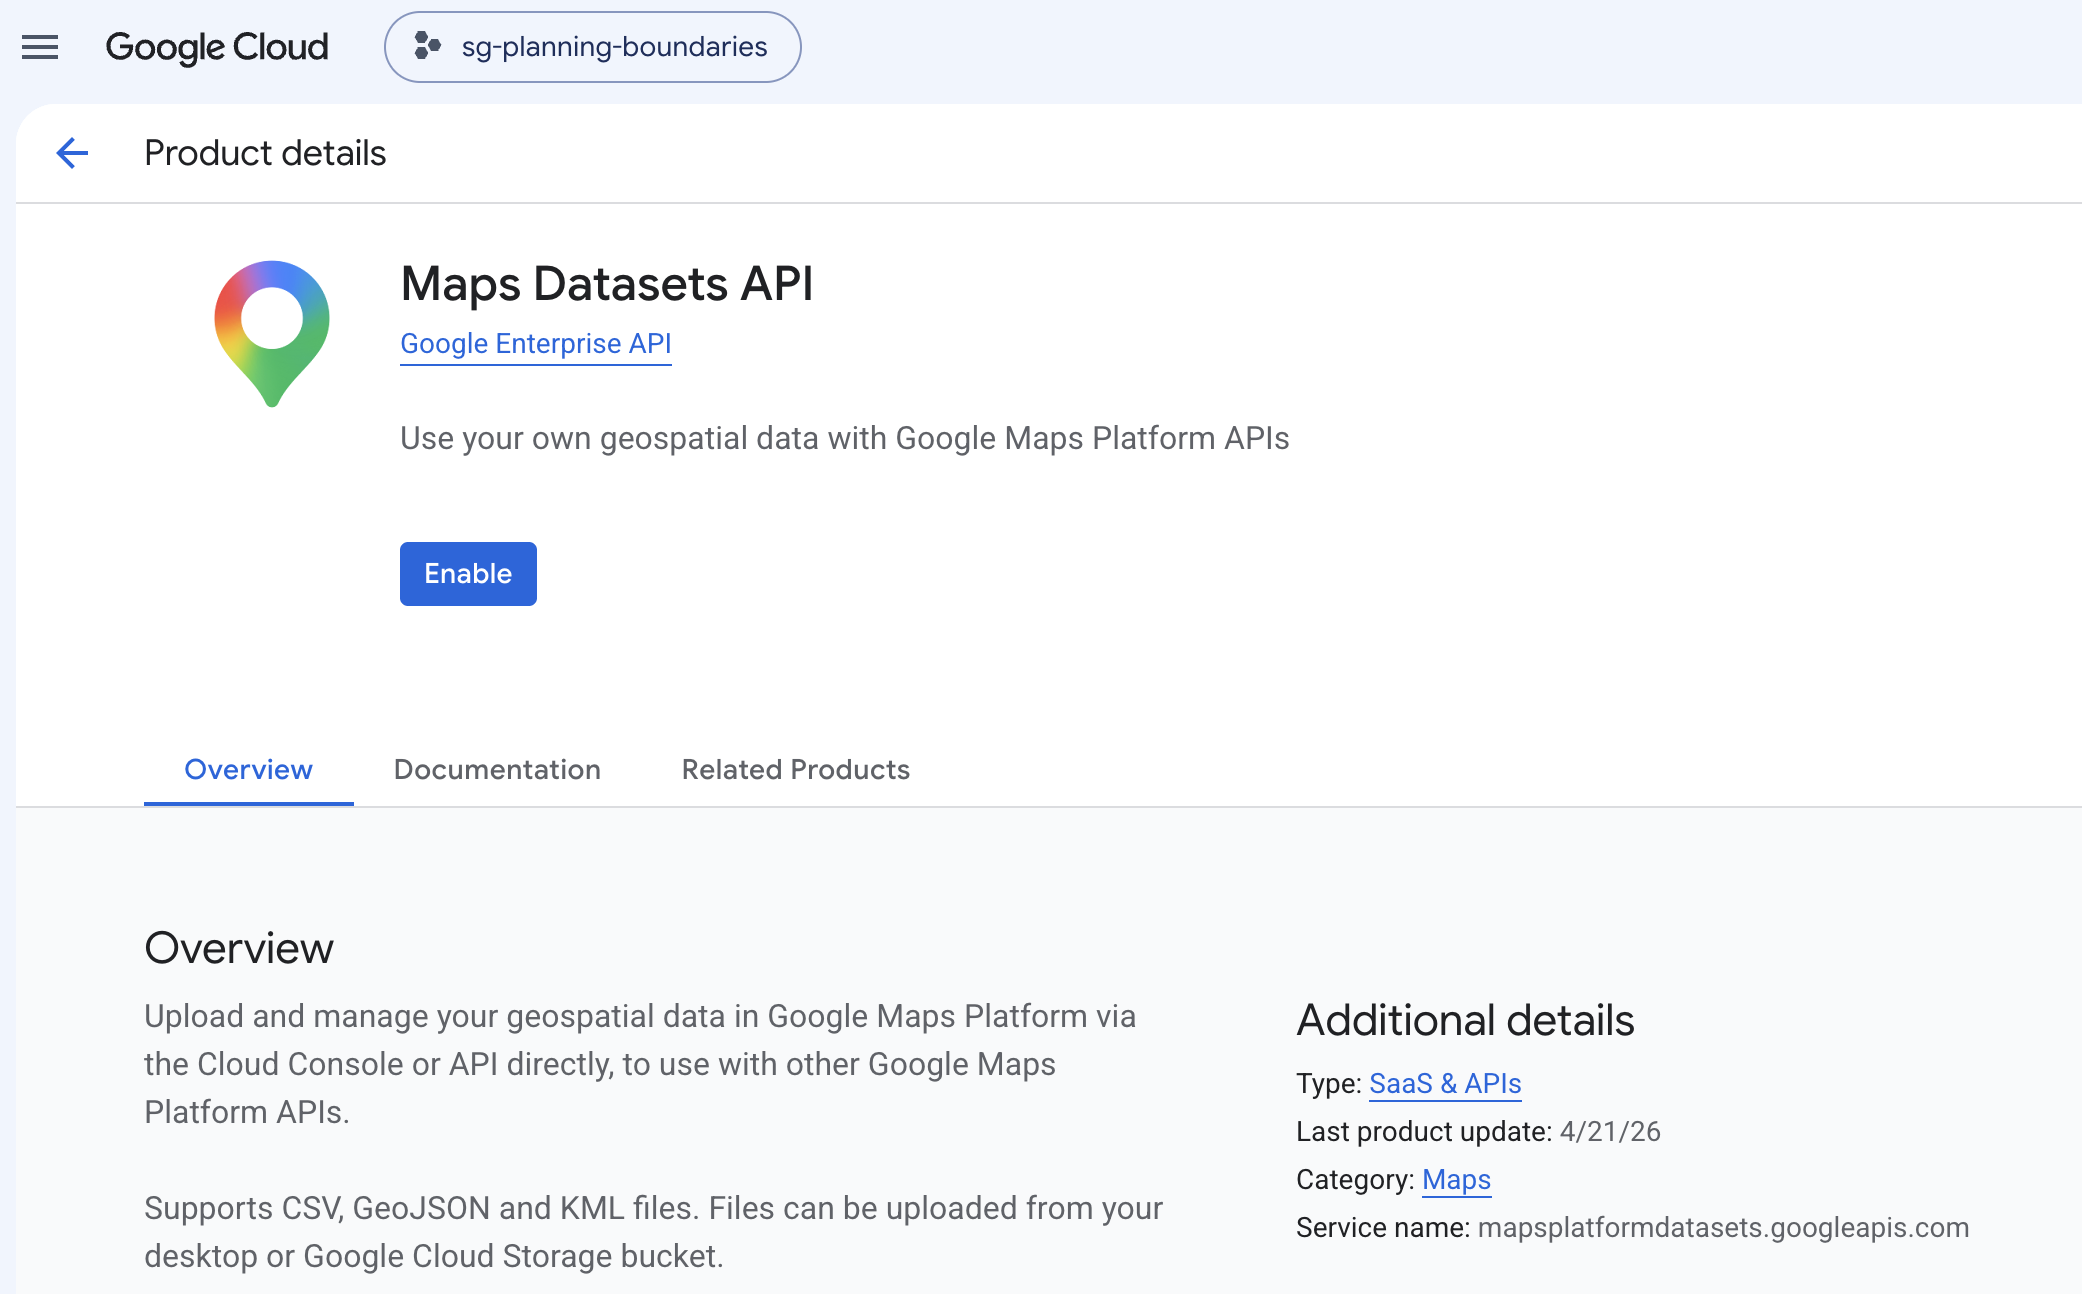
Enable the APIs. Go to APIs & Services → Library and enable the:
- Maps Datasets API: for creating datasets and importing your GeoJSON.
- Maps Javascript API: for the map that will render the boundaries.
Set up authentication for the Maps Datasets API
Unlike the Maps Javascript API, the Maps Datasets API doesn't accept a simple API key. It uses OAuth, and the easiest way to get OAuth up and running on your local machine is by using the Google Cloud CLI. After you download and install the CLI, head to Terminal (MacOS) or Windows Terminal (Windows) and in the same folder that you saved MasterPlan2019PlanningAreaBoundaryNoSea.geojson to, run the following commands.
gcloud auth login
gcloud config set project YOUR_PROJECT_ID
gcloud auth print-access-token
If you've set up the CLI correctly and authenticated with your Google Cloud account, you'll get an access token that looks like this:
ya29.a0ARGnu0ZLRsfAWOim...gke4mG32J_GNUaCgYKAUsSARISFQHGX2MiCg52iAKrGXUa3j_jmfw28Q0211This is your OAuth 2.0 access token and proves to Google that requests are coming from you. Do note that it expires after about an hour. If your request suddenly starts returning 401 after working fine, the token has expired. Just run the gcloud auth print-access-token command again for a fresh one.
Create a dataset
Next, we are going to create an empty dataset in our Google Cloud project. Substitute {PROJECT_ID} with the Google Cloud Project ID we created earlier in this tutorial and {DATASET_DISPLAY_NAME} with a suitably descriptive name for our dataset. I used ura-planning-boundaries.
Request
curl -X POST \
  -H "Authorization: Bearer $(gcloud auth print-access-token)" \
  -H "X-Goog-User-Project: {YOUR_PROJECT_ID}" \
  -H "Content-Type: application/json" \
  -d '{
    "displayName": "{DATASET_DISPLAY_NAME}",
    "usage": "USAGE_DATA_DRIVEN_STYLING"
  }' \
  "https://mapsplatformdatasets.googleapis.com/v1/projects/{YOUR_PROJECT_ID}/datasets"
Response
{
  "name": "projects/320987795473/datasets/4a6ea7f1-2330-42bc-bf0d-8d85503e8d06",
  "displayName": "ura-planning-boundaries",
  "usage": [
    "USAGE_DATA_DRIVEN_STYLING"
  ],
  "createTime": "2026-07-16T05:33:21.059682Z",
  "updateTime": "2026-07-16T05:33:21.059682Z"
}
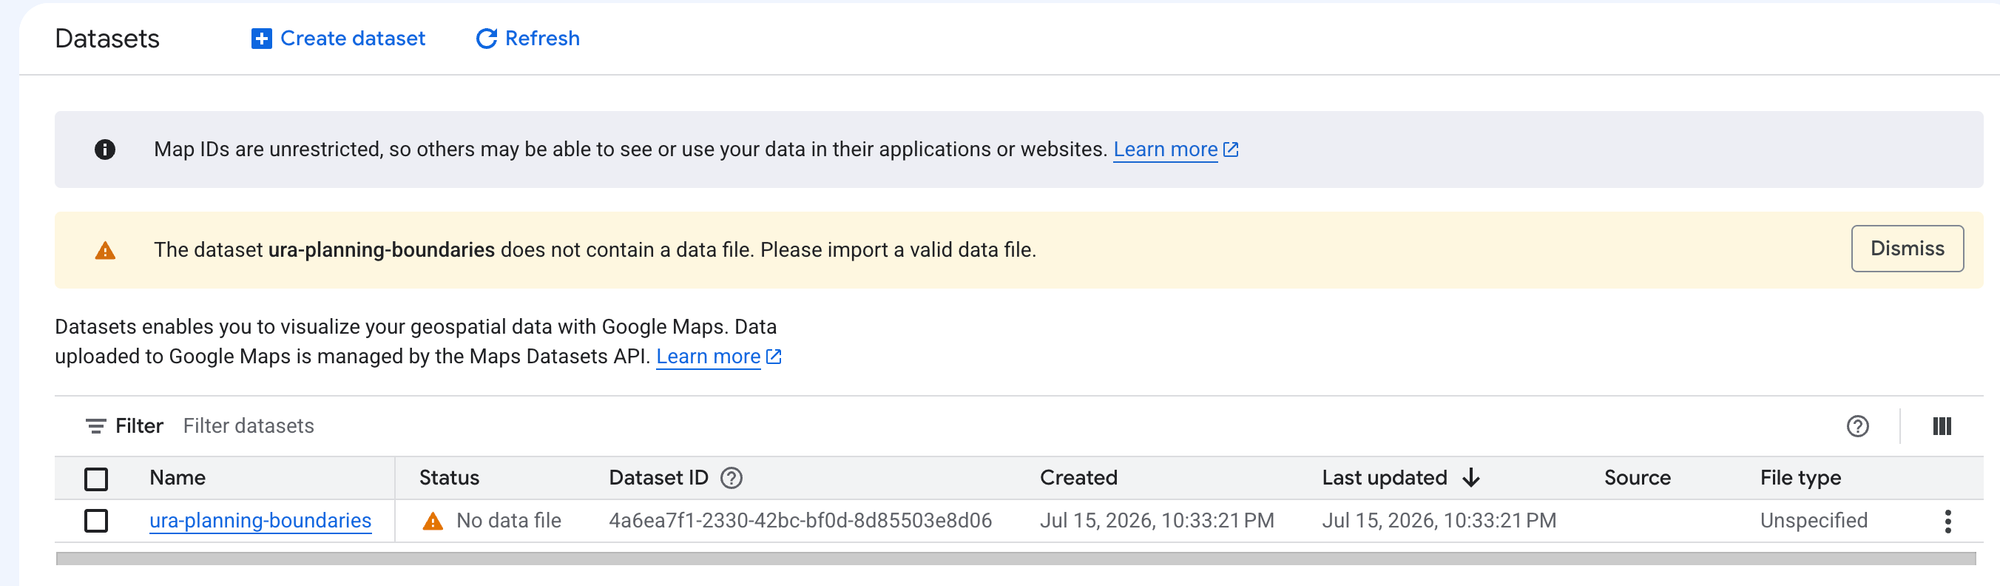
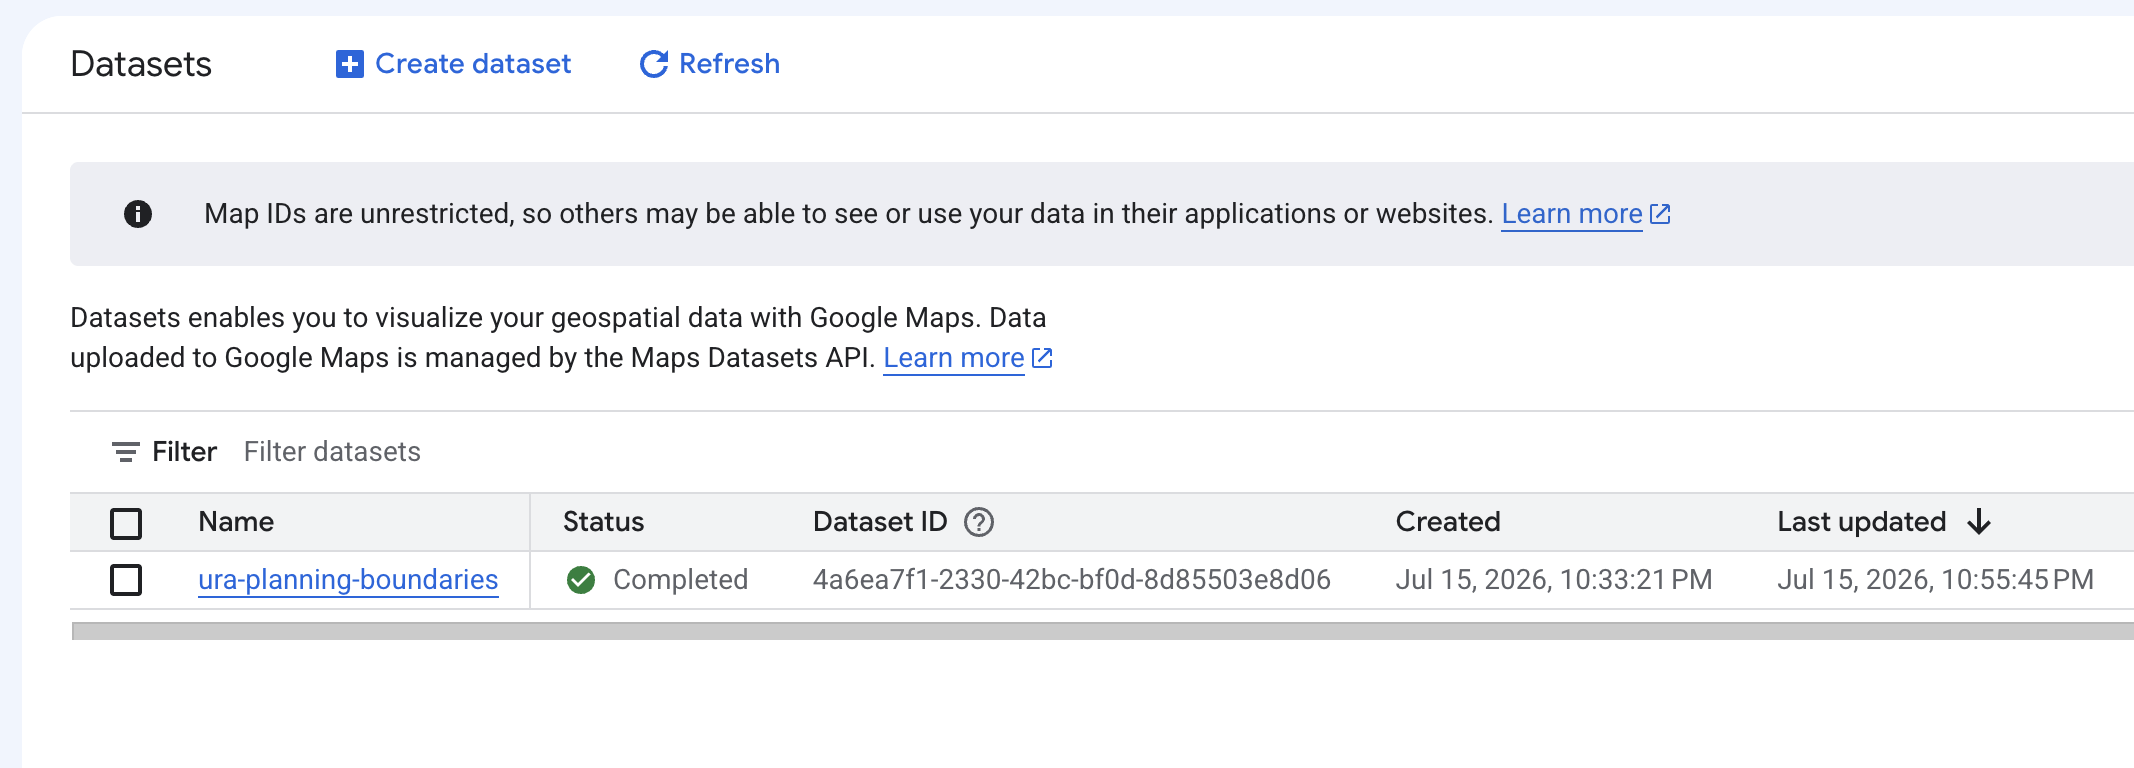
In my example, 4a6ea7f1-2330-42bc-bf0d-8d85503e8d06 is the dataset ID that goes right into the path of the API call to upload the GeoJSON. If you've correctly followed along so far, you'll also be able to see the empty dataset on the Datasets page in the Google Maps Platform section of the Google Cloud Console.
Import a dataset
Next, we import the MasterPlan2019PlanningAreaBoundaryNoSea.geojson file to the newly created dataset.
Request
{PROJECT_ID}: Your Google Cloud Project ID
{DATSET_ID}: The ID of the empty dataset created earlier
curl -X POST \
  -H "X-Goog-User-Project: {YOUR_PROJECT_ID}" \
  -H "Authorization: Bearer $(gcloud auth print-access-token)" \
  -H "X-Goog-Upload-Protocol: multipart" \
  -F 'metadata={"local_file_source": {"file_format": "FILE_FORMAT_GEOJSON"}};type=application/json' \
  -F "rawdata=@MasterPlan2019PlanningAreaBoundaryNoSea.geojson" \
  "https://mapsplatformdatasets.googleapis.com/upload/v1/projects/{YOUR_PROJECT_ID}/datasets/{DATASET_ID}:import"
Response
{
  "name": "projects/320987795473/datasets/4a6ea7f1-2330-42bc-bf0d-8d85503e8d06@1ed742d3-1e2c-4db7-a5f2-6fdae86580c9"
}
If everything went to plan, you should be able to see your new dataset in the Google Cloud Console.
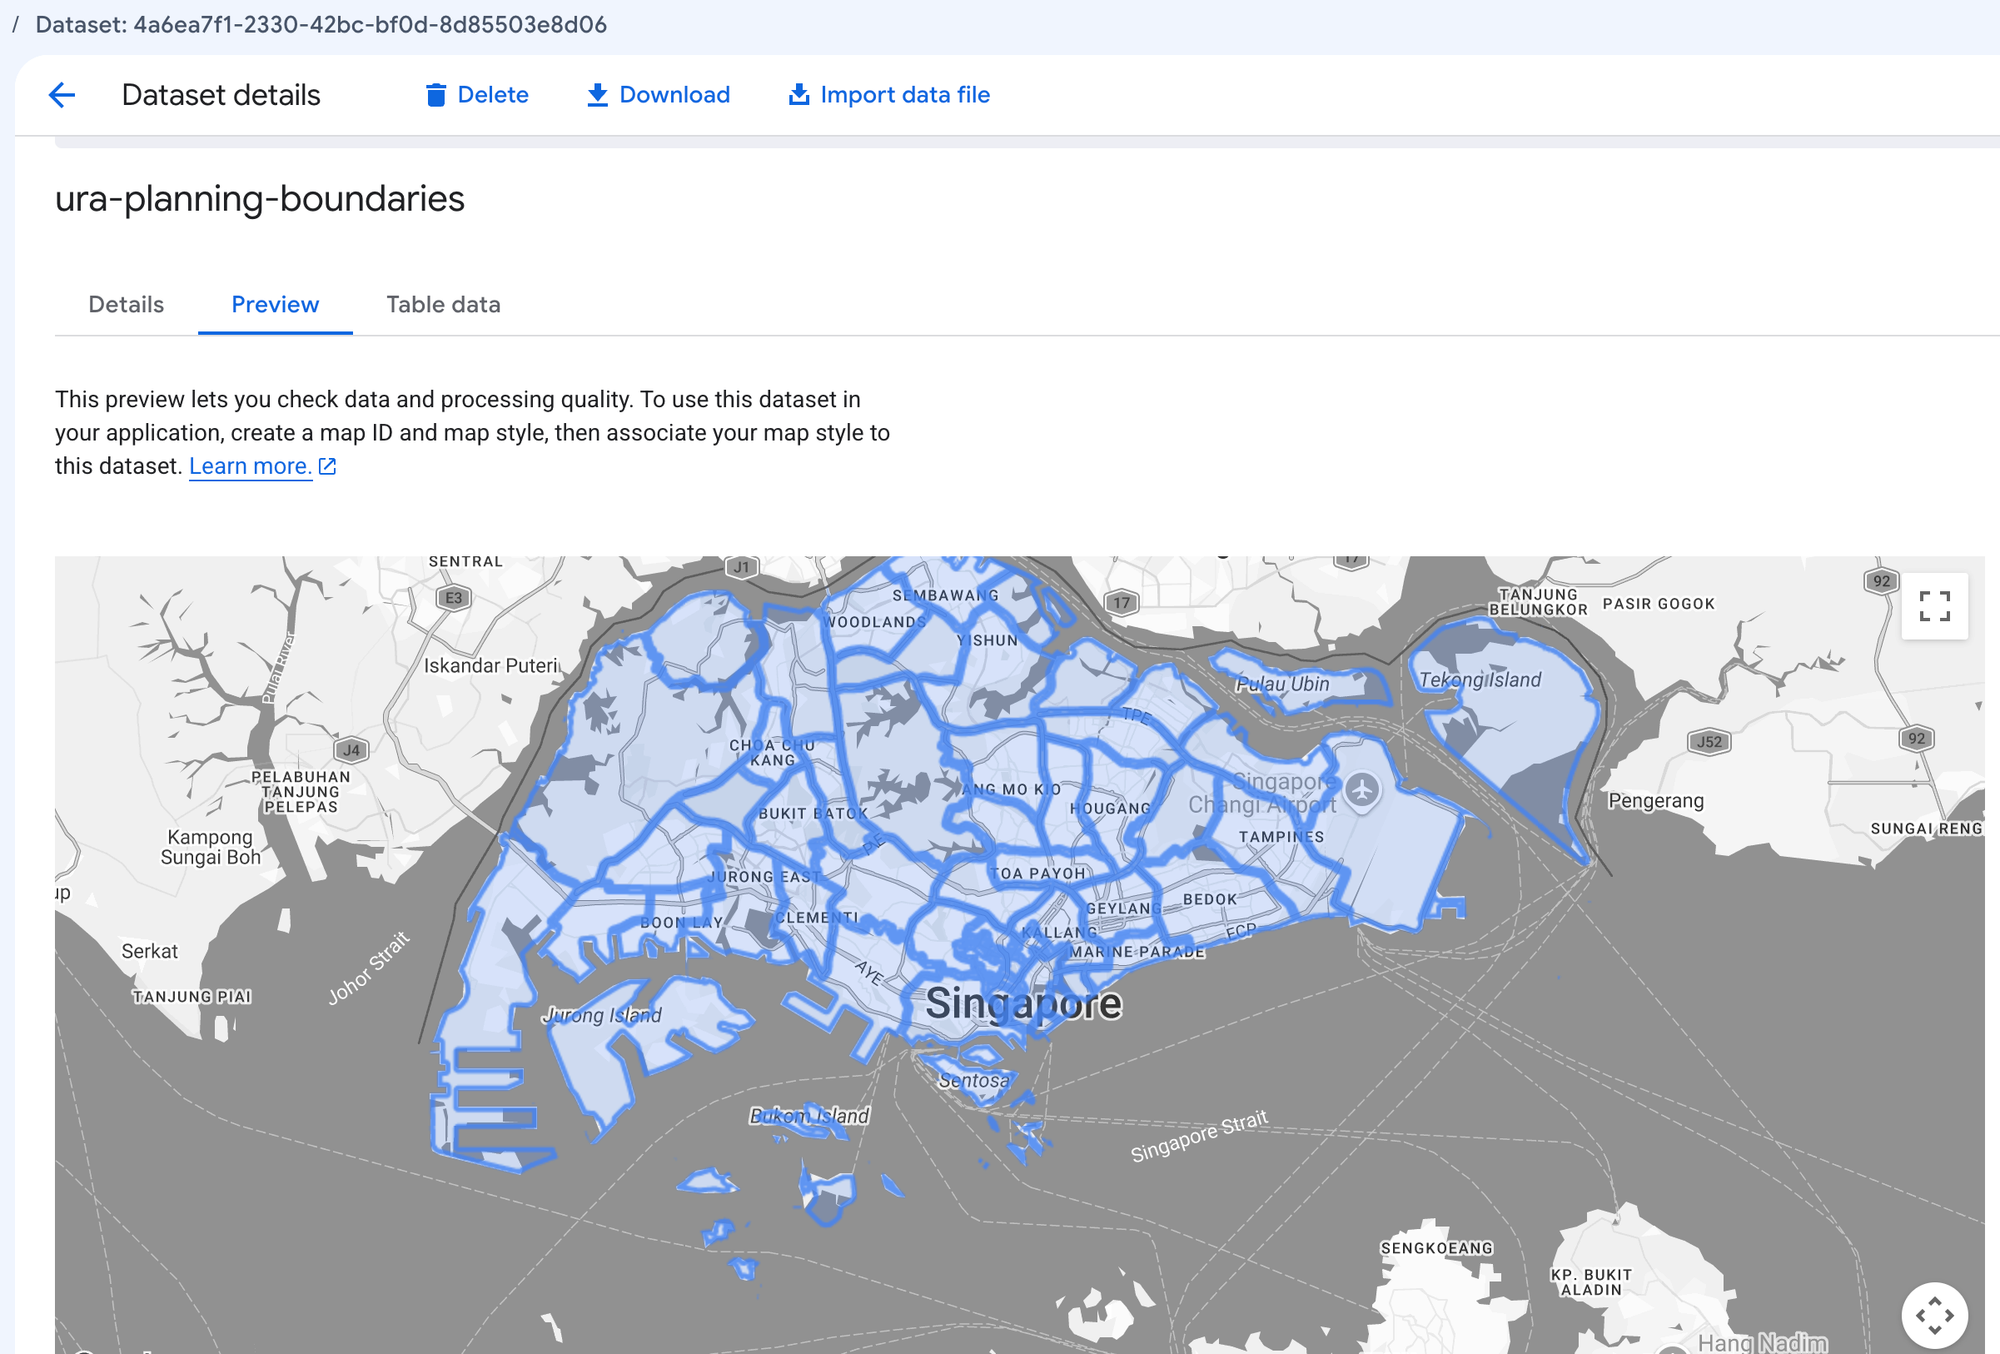
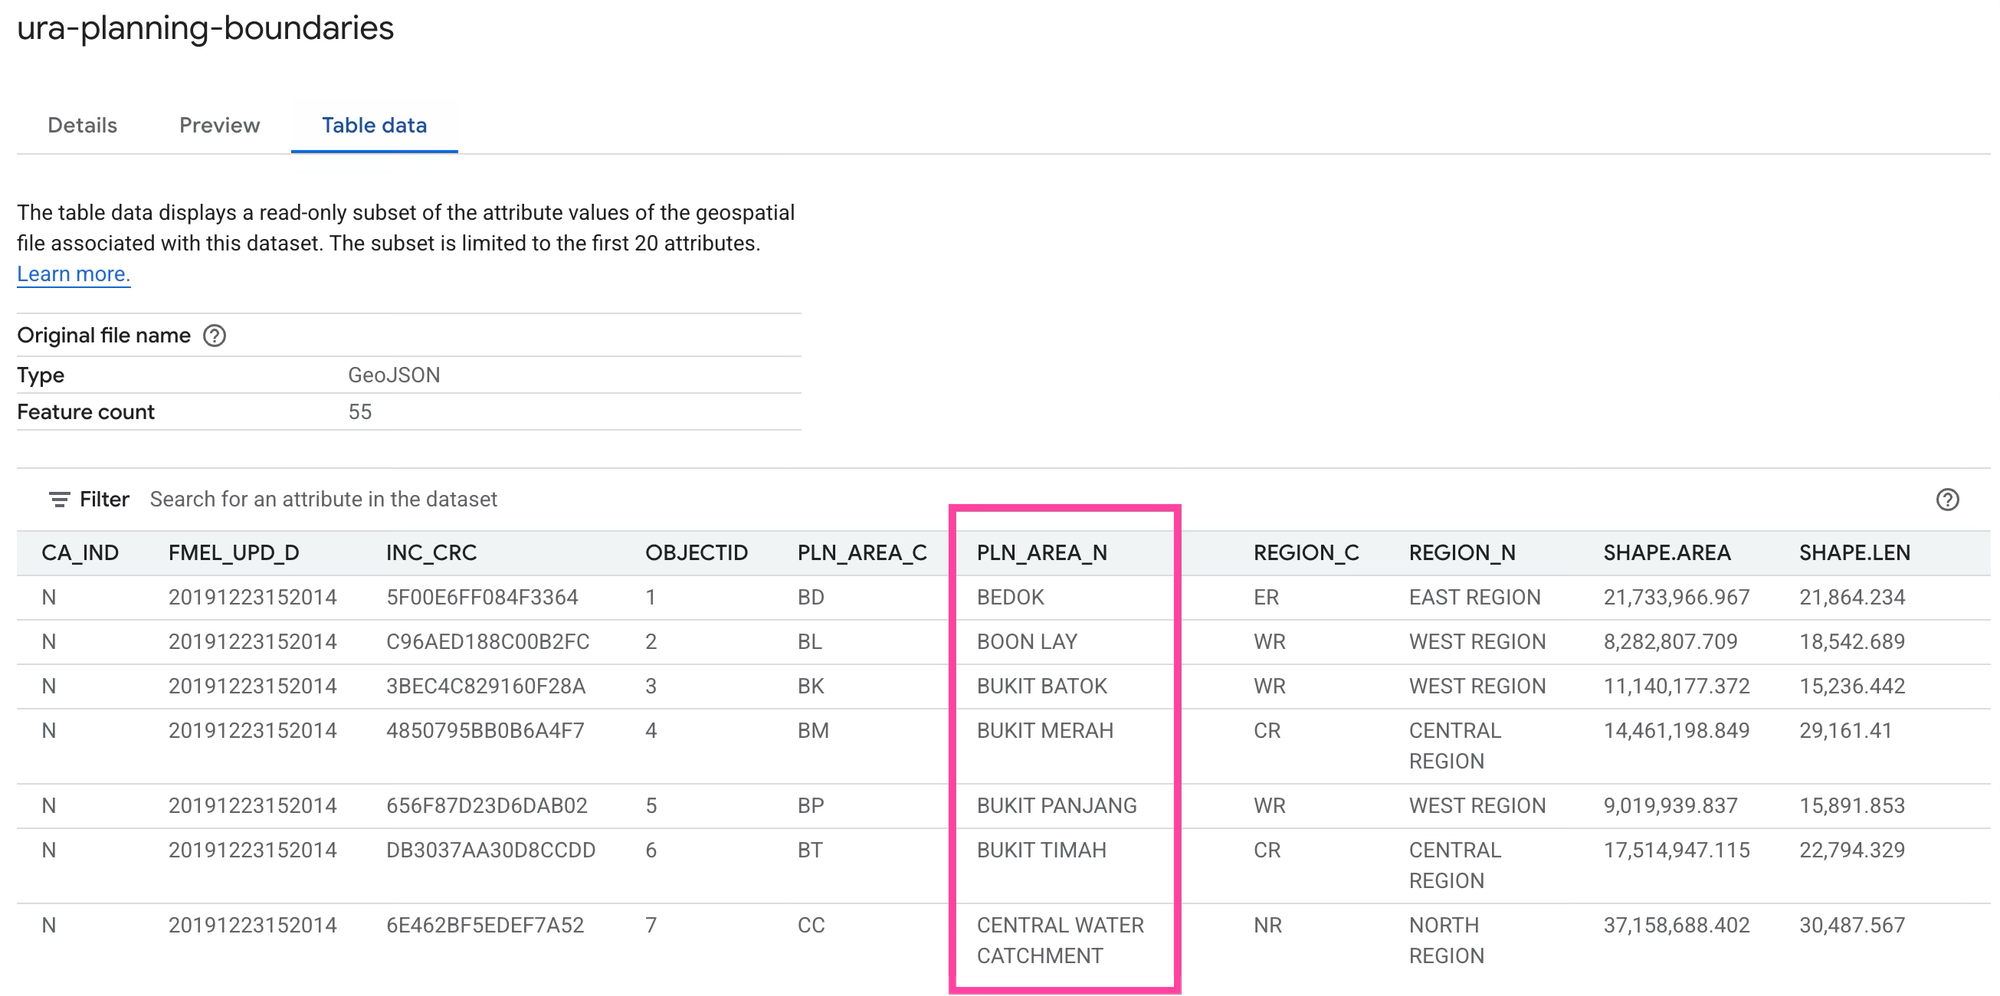
Click the dataset's display name, then select the [Preview] tab to check that your data is correct.
Create a map style and associate it with the dataset
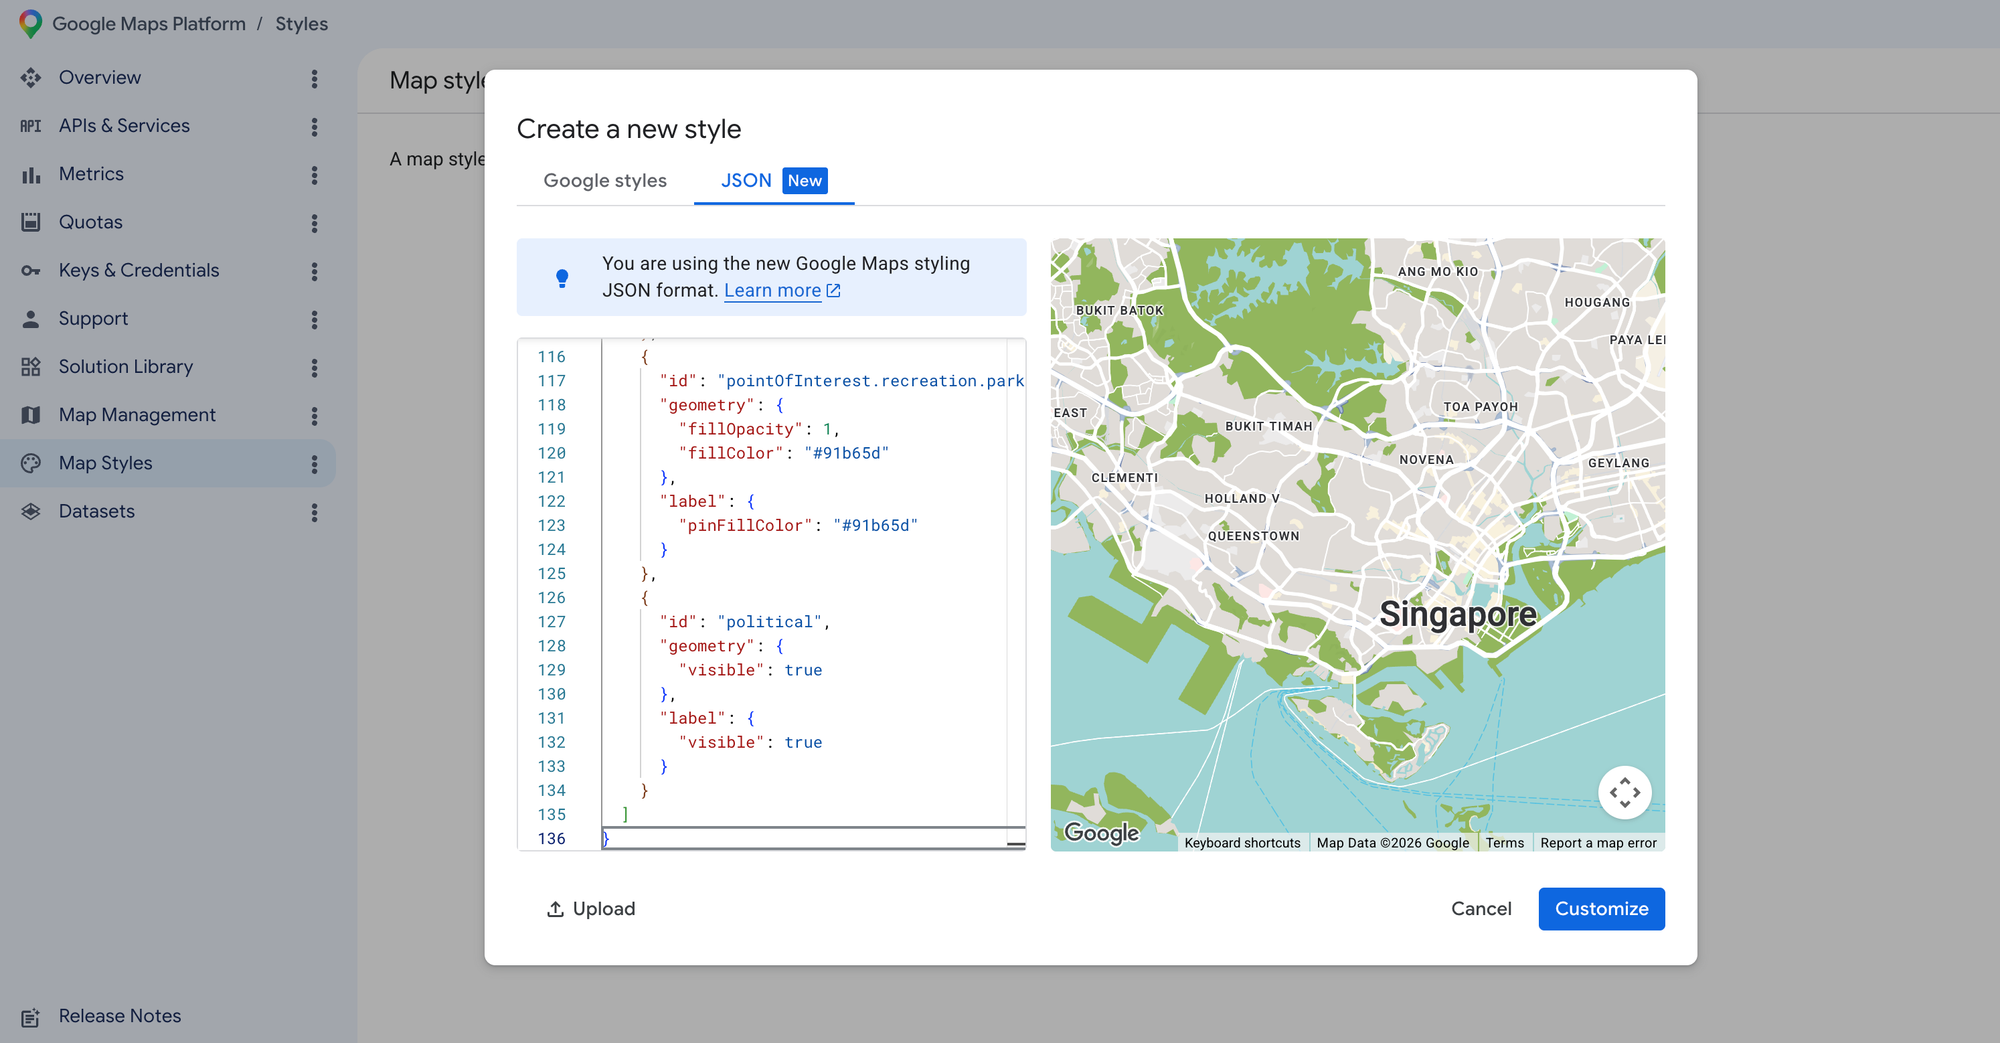
Next, we'll create a map style and associate the dataset with it. While still in the Google Cloud Console, select [Google Maps Platform], [Map Styles] and click on [+ Create Style]. Name the style "ura-style". Choose your own style or use my JSON styles array below.
{
  "variant": "light",
  "styles": [
    {
      "id": "infrastructure",
      "label": {
        "visible": false
      }
    },
    {
      "id": "infrastructure.roadNetwork.road",
      "geometry": {
        "fillOpacity": 1,
        "fillColor": "#ffffff"
      }
    },
    {
      "id": "infrastructure.roadNetwork.road.arterial",
      "geometry": {
        "fillOpacity": 1,
        "fillColor": "#ffffff",
        "strokeOpacity": 1,
        "strokeColor": "#ffffff"
      }
    },
    {
      "id": "infrastructure.roadNetwork.road.highway",
      "geometry": {
        "fillOpacity": 1,
        "fillColor": "#ffffff",
        "strokeOpacity": 1,
        "strokeColor": "#ffffff"
      }
    },
    {
      "id": "infrastructure.roadNetwork.road.local",
      "geometry": {
        "fillOpacity": 1,
        "fillColor": "#ffffff",
        "strokeOpacity": 1,
        "strokeColor": "#ffffff"
      }
    },
    {
      "id": "infrastructure.roadNetwork.roadDetail.surface",
      "geometry": {
        "visible": true,
        "fillOpacity": 1,
        "fillColor": "#ffffff"
      }
    },
    {
      "id": "infrastructure.urbanArea",
      "geometry": {
        "fillOpacity": 1,
        "fillColor": "#dfdcd7"
      }
    },
    {
      "id": "natural",
      "label": {
        "visible": false
      }
    },
    {
      "id": "natural.land.landCover.crops",
      "geometry": {
        "fillOpacity": 1,
        "fillColor": "#91b65d"
      }
    },
    {
      "id": "natural.land.landCover.dryCrops",
      "geometry": {
        "fillOpacity": 1,
        "fillColor": "#91b65d"
      }
    },
    {
      "id": "natural.land.landCover.forest",
      "geometry": {
        "fillOpacity": 1,
        "fillColor": "#91b65d"
      }
    },
    {
      "id": "natural.water",
      "geometry": {
        "fillOpacity": 1,
        "fillColor": "#a0d3d3"
      }
    },
    {
      "id": "pointOfInterest",
      "label": {
        "visible": false
      }
    },
    {
      "id": "pointOfInterest.recreation.golfCourse",
      "geometry": {
        "fillOpacity": 1,
        "fillColor": "#91b65d"
      },
      "label": {
        "pinFillColor": "#91b65d"
      }
    },
    {
      "id": "pointOfInterest.recreation.natureReserve",
      "geometry": {
        "fillOpacity": 1,
        "fillColor": "#91b65d"
      }
    },
    {
      "id": "pointOfInterest.recreation.park",
      "geometry": {
        "fillOpacity": 1,
        "fillColor": "#91b65d"
      },
      "label": {
        "pinFillColor": "#91b65d"
      }
    },
    {
      "id": "political",
      "geometry": {
        "visible": true
      },
      "label": {
        "visible": true
      }
    }
  ]
}
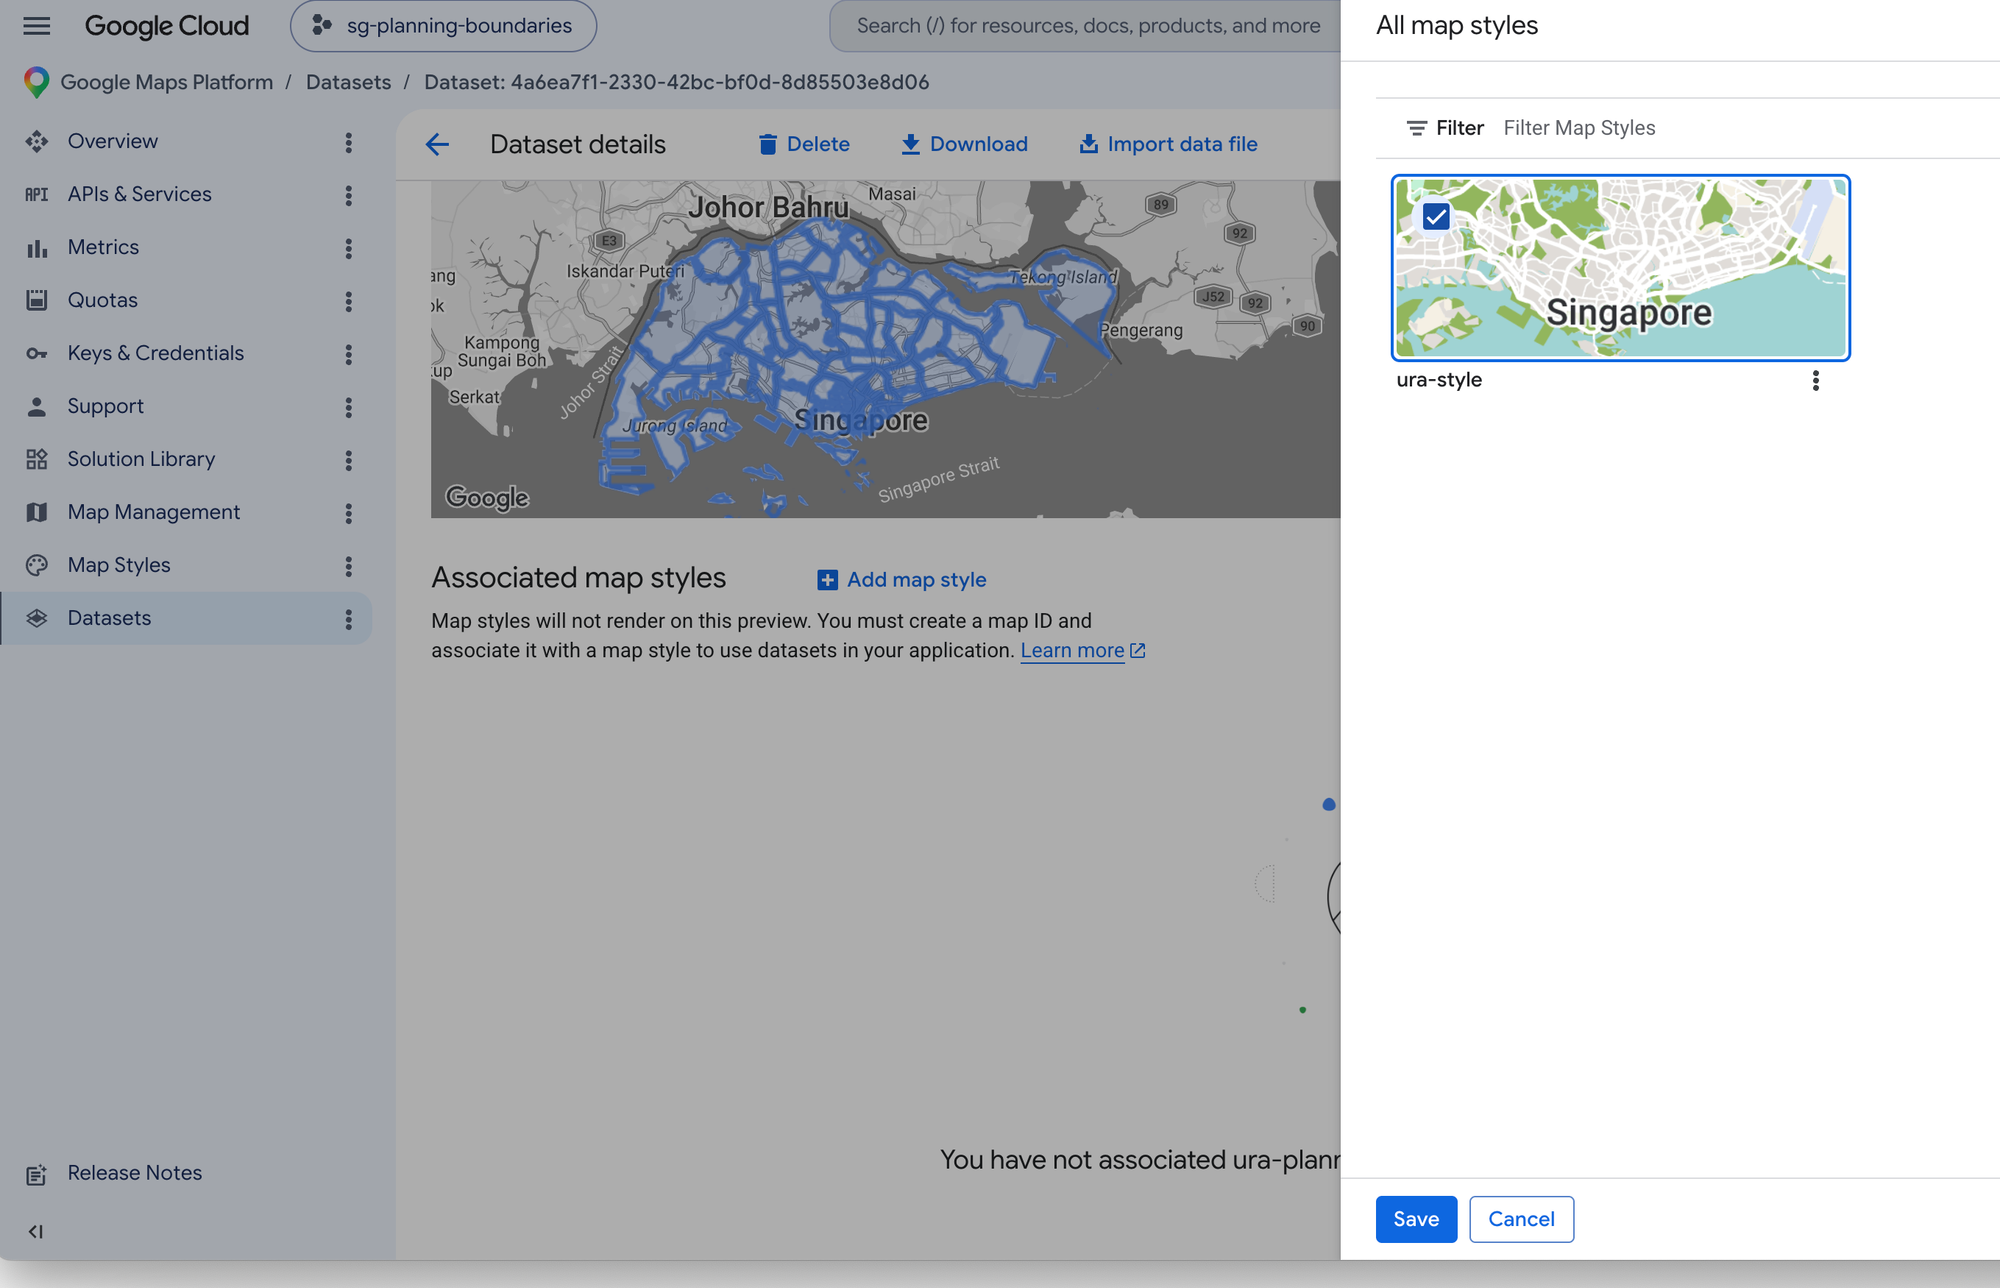
To link the URA planning boundary dataset to the style you just created, click the dataset name, select the [Preview] tab, and scroll down to the Associated map styles section. Click [Edit Map Styles], choose ura-style, and hit [Save].
Create a Map ID and link it to the map style
The last step is to create a map ID and link it to a style. This is what gets your data into the map's tiles. When <Map mapId="..."> mounts, the Maps JavaScript API sends the ID along with its tile requests. Google looks up the style attached to that ID, finds the URA dataset associated with the style, and includes the boundary geometries in the vector tiles it serves. Without the right map ID, the features never make it into the tiles, and nothing downstream can work.
Under Google Maps Platform → Map Management → [Create Map ID], choose Javascript with the vector map type. Data driven styling only works on vector maps with a map ID. Give your map a descriptive name e.g. "ura-style".
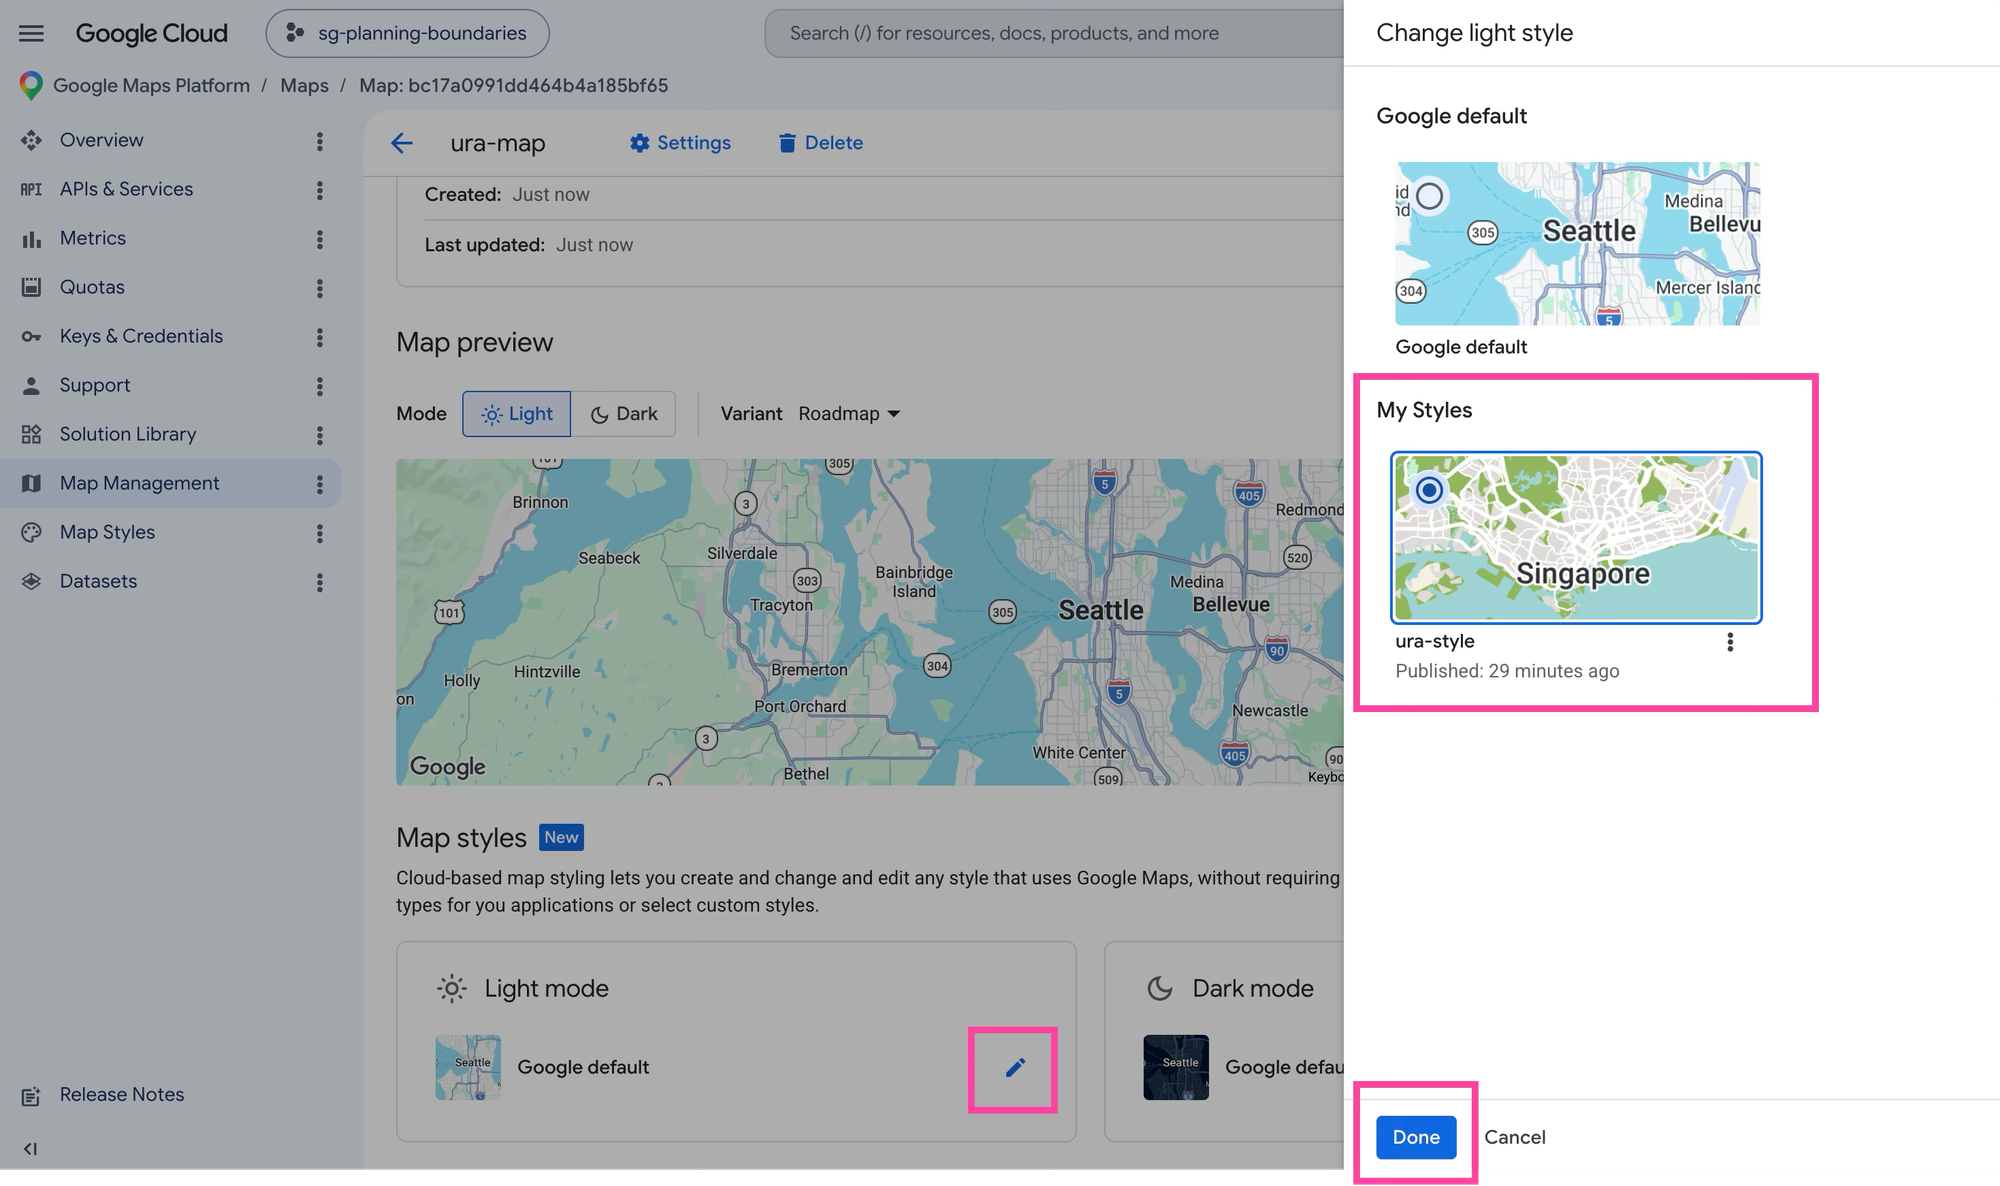
Once your map ID is created, scroll down until you find the "Light mode" section. Click the [✏️] icon and choose the ura-style created earlier. Click [Done] to save that style to the map. We are finally ready to render the planning boundary dataset on a Google Map.
Display the dataset on a map
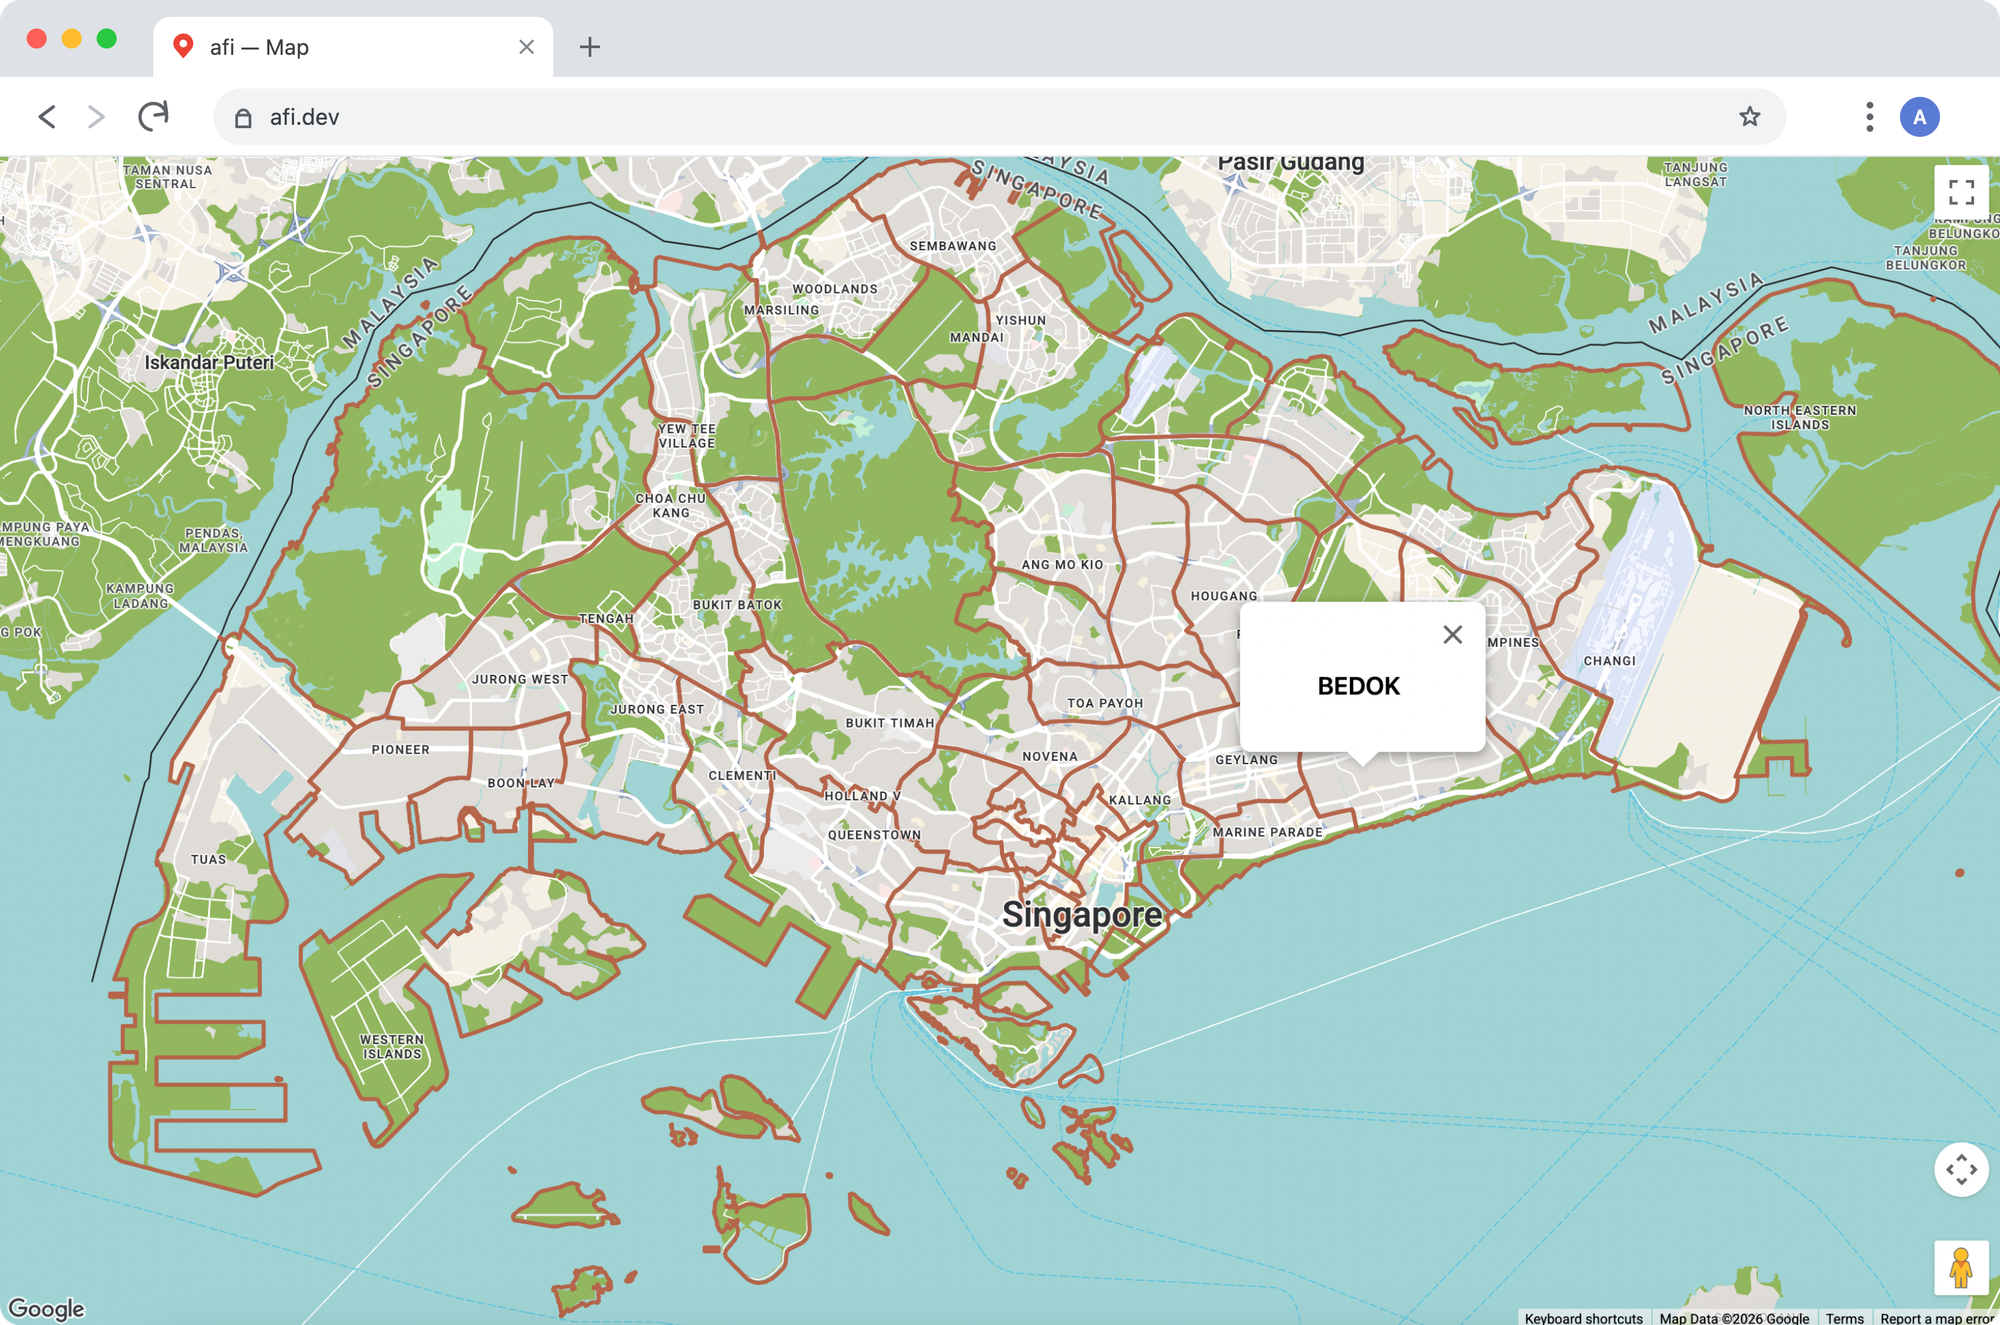
Now for the fun part! We'll build a single page React app that displays the planning area boundaries on a Google Map. Click a boundary, and a popup shows the planning area's name.
Create a basic React app
Follow the instructions in this blog post: Google Maps with React: Add a Google Map and style it to create a fresh React app with a Google Map.
App.jsx
In the app, replace the default App.jsx with a Google Map set up using the @vis.gl/react-google-maps library (code shown below). Make sure to point the mapId prop in the <Map/> component the map ID we just created a few moments ago.
Add a new file, PlanningBoundaryDatasetLayer.jsx to the /src folder but leave it empty. We'll code it up next.
/*** App.jsx ***/
import { APIProvider } from "@vis.gl/react-google-maps";
import { Map } from "@vis.gl/react-google-maps";
import { useCallback } from "react";

import PlanningBoundaryDatasetLayer from "./PlanningBoundaryDatasetLayer";

function App() {
  return (
    <APIProvider apiKey={import.meta.env.VITE_GOOGLE_MAPS_API_KEY}>
      <Map
        style={{ width: "100vw", height: "100vh" }}
        defaultCenter={{ lat: 1.29027, lng: 103.851959 }}
        defaultZoom={12}
        mapTypeControl={false}
        mapId={import.meta.env.VITE_GOOGLE_MAPS_MAP_ID}
        gestureHandling="greedy"
      >
        <PlanningBoundaryDatasetLayer />
      </Map>
    </APIProvider>
  );
}

export default App;
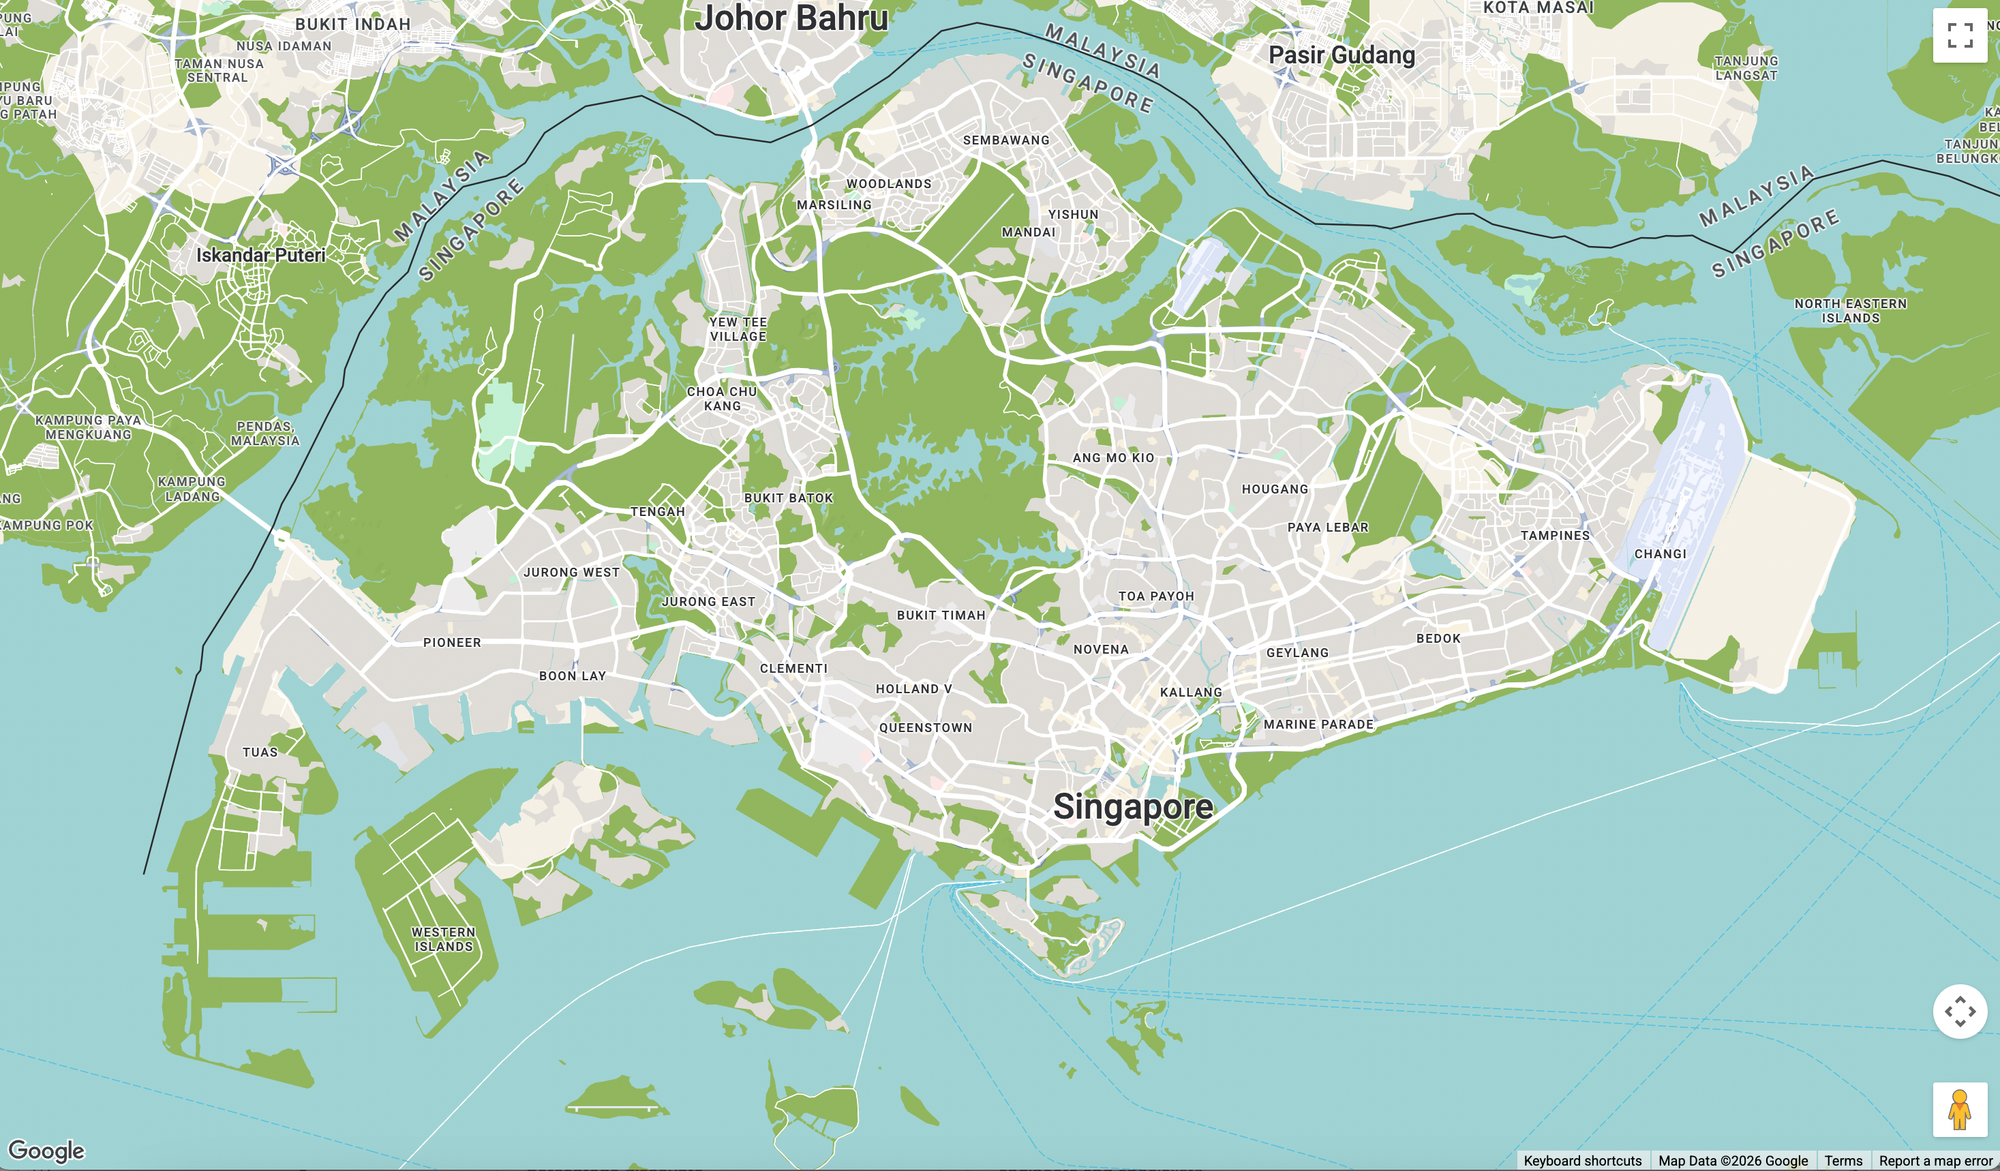
Run npm install @vis.gl/react-google-maps to install the @vis.gl/react-google-maps library followed by npm run dev to start the app on your local machine. Open your browser and go to http://localhost:5173. You should see a full screen Google Map centered on Singapore.
PlanningBoundaryDatasetLayer.jsx
PlanningBoundaryDatasetLayer.jsx configures the URA planning boundary feature layer, telling the map renderer how to draw the boundaries, and adds a click handler that opens an <InfoWindow/> with the planning area's name. Here's how it works.
First, we save a reference to the planning area boundary dataset ID. This information can be found in the Datasets section of the Google Cloud Console.
const PLANNING_BOUNDARY_DATASET_ID = "4a6ea7f1-2330-42bc-bf0d-8d85503e8d06"Then, we retrieve the dataset feature layer for the dataset so that we can style and listen for events on it.
import { useMap, InfoWindow } from "@vis.gl/react-google-maps";
import { useEffect, useState } from "react";

const PLANNING_BOUNDARY_DATASET_ID = "bb55a8a9-46f5-48af-8091-b491d88b61be";

export default function PlanningBoundaryDatasetLayer() {
  const map = useMap();
  const [popup, setPopup] = useState(null); // { position, attributes }

  useEffect(() => {
    if (!map) return;

    const layer = map.getDatasetFeatureLayer(PLANNING_BOUNDARY_DATASET_ID);

    //... Feature style function code
    //... clickListener code we'll add later

    return () => {
      clickListener.remove();
      layer.style = null;
    };
  }, [map]);

  if (!popup) return null;

  return (
    <div></div>
    //... Infowindow code
  );
}
map.getDatasetFeatureLayer(PLANNING_BOUNDARY_DATASET_ID); hands you a layer object that represents the planning area boundary, which we'll style with a dark red outline.
layer.style = (params) => {
  const attrs = params.feature.datasetAttributes;

  return {
    pointRadius: 6,
    fillColor: "#FFFFFF",
    fillOpacity: 0.01,
    strokeColor: "#B5654A",
    strokeWeight: 3.0,
  };
};
Note the fillOpacity: 0.01. The fill is nearly invisible, but it's what makes the interior of each polygon clickable; set it to 0 and clicks will only register on the boundary lines themselves.
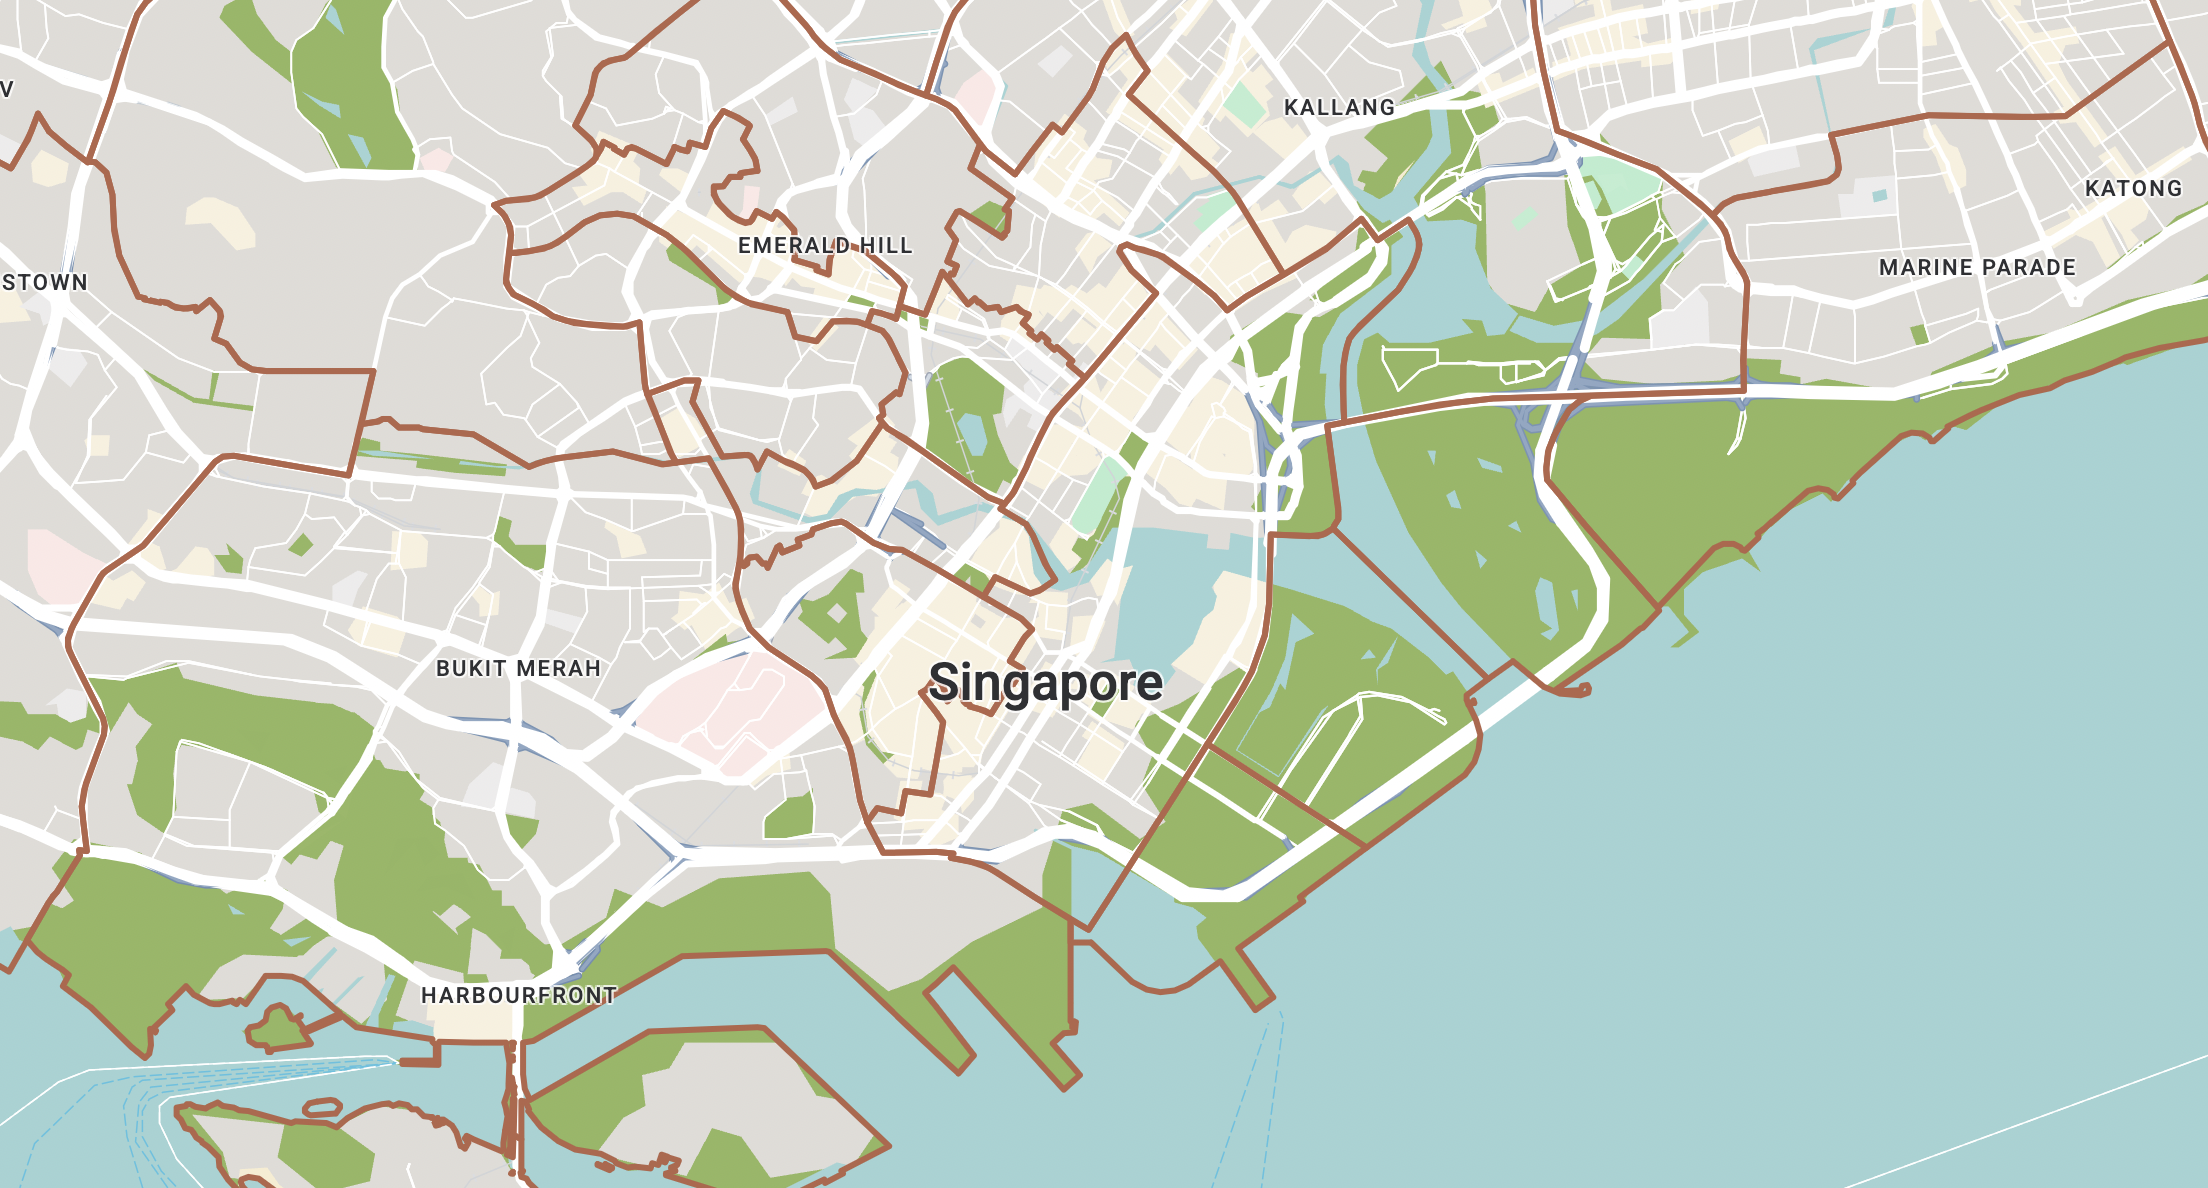
Third, we register a handler that fires whenever the user clicks anywhere on the planning boundary feature layer with layer.addListener("click", (event) => {});.
const clickListener = layer.addListener("click", (event) => {
  const feature = event.features?.[0];
  if (!feature) return;
  setPopup({ position: event.latLng, attributes: feature.datasetAttributes });
});
When a user clicks on the boundary, we save the click location and the feature's data in state, which triggers a re-render. The render half of this happens in the return statement (below), which displays an <InfoWindow/> component with the planning area's name.
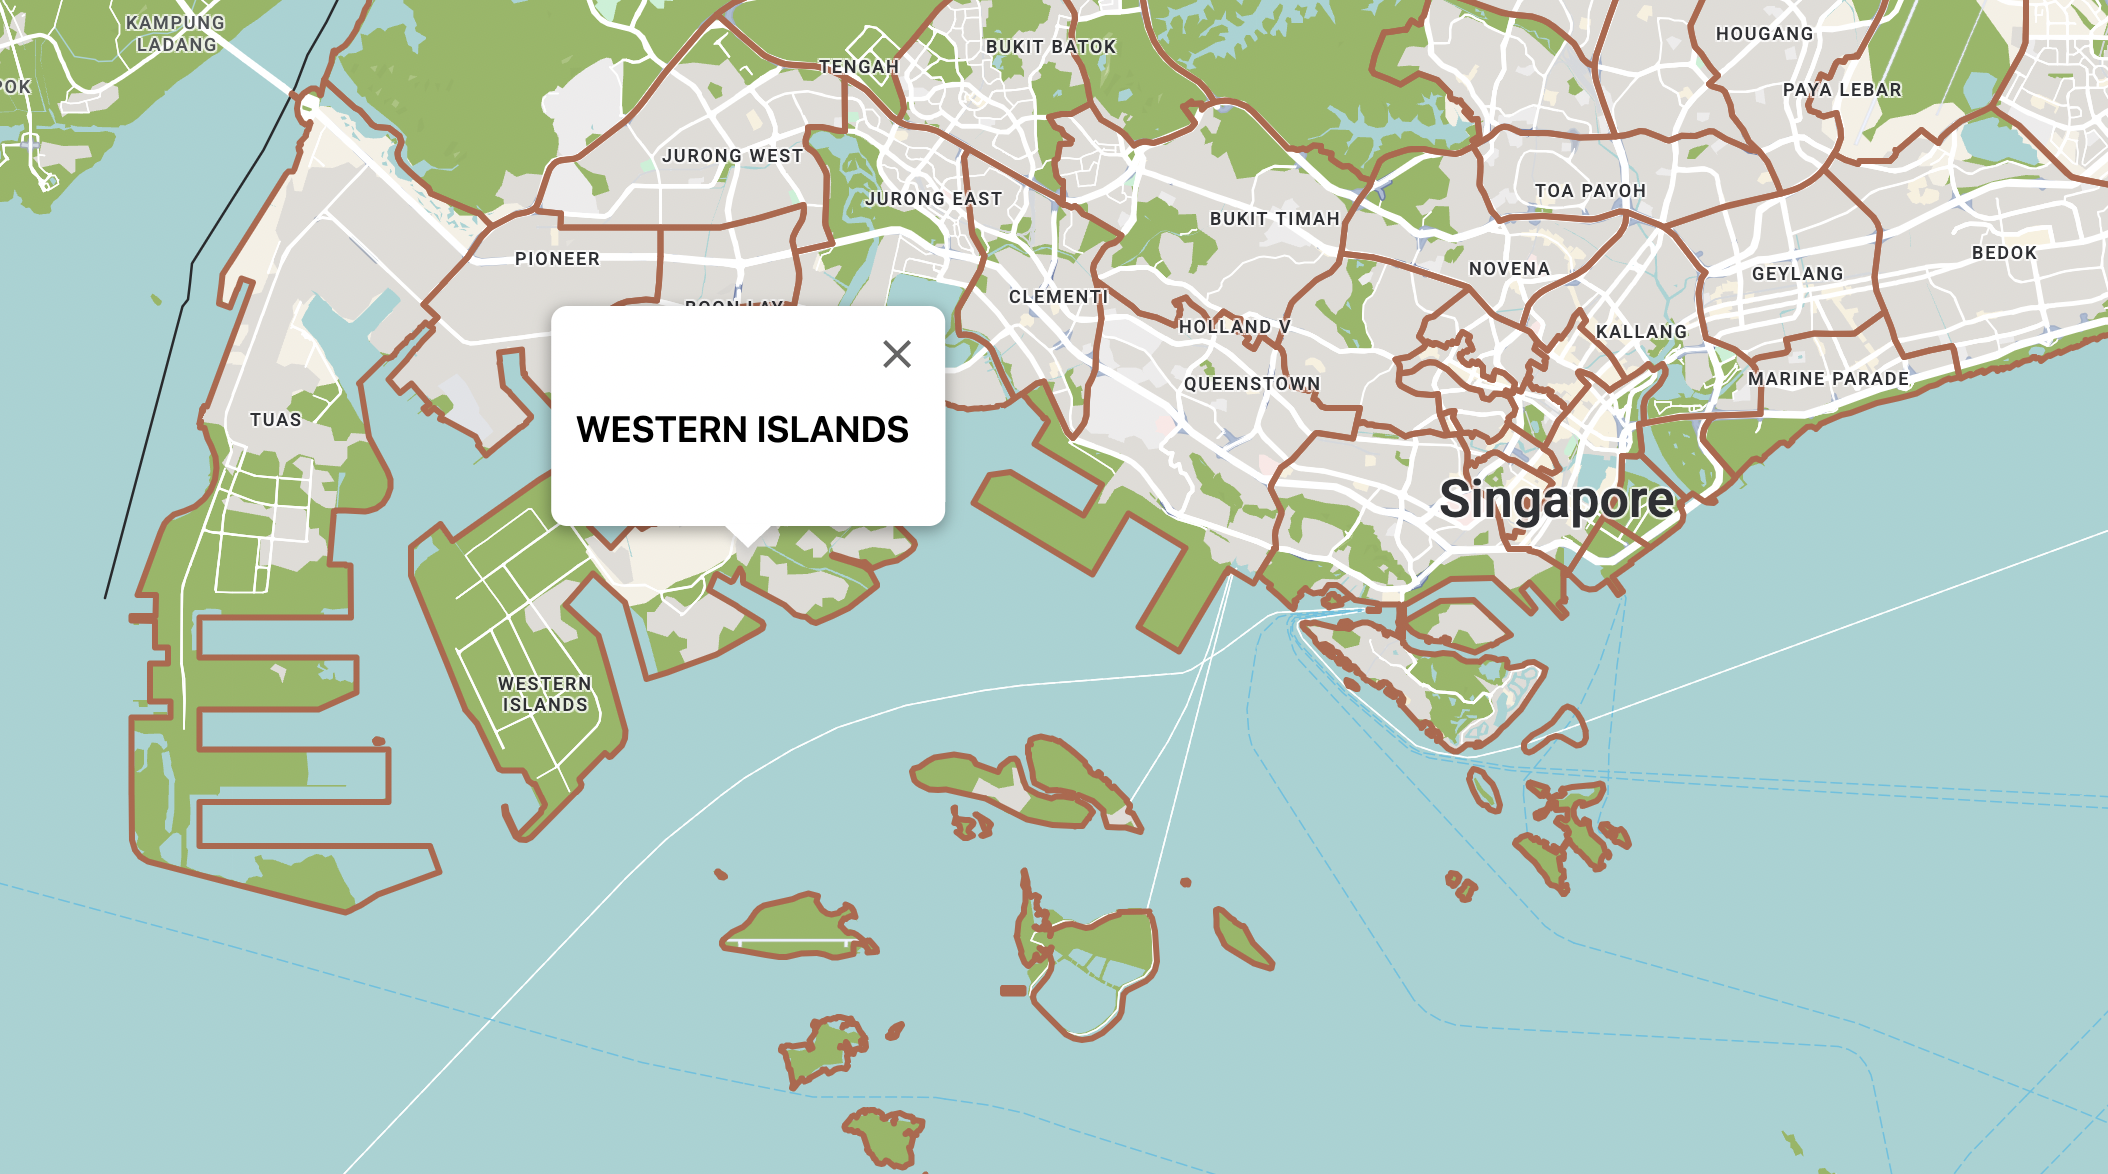
<InfoWindow/> is a declarative wrapper from @vis.gl/react-google-maps around the native google.maps.InfoWindowm the classic white speech bubble popup you see on Google Maps. The position prop controls where the window opens. Here, we pass it the coordinates of the user's click.
return (
  <InfoWindow position={popup.position} onCloseClick={() => setPopup(null)}>
    <div
      style={{
        fontFamily: "system-ui, sans-serif",
        fontSize: 13,
        lineHeight: 1.5,
        minWidth: 150,
        minHeight: 50,
      }}
    >
      <div
        style={{
          fontSize: 18,
          fontWeight: 600,
          marginBottom: 4,
          textAlign: "center",
        }}
      >
        {popup.attributes.PLN_AREA_N}
      </div>
    </div>
  </InfoWindow>
);
The planning area's name is retrieved from the PLN_AREA_N (planning area name) field of the datasetAttributes object of the clicked feature.
To try the worked example, clone the google_maps_datasets_api repository and set two environment variables: VITE_GOOGLE_MAPS_API_KEY (your API key) and VITE_GOOGLE_MAPS_MAP_ID (your map ID, which must point to a style with the dataset uploaded and associated, as covered earlier). Then run npm install and npm run dev.
Coming up next
In this tutorial, I showed you how to upload and style datasets programmatically using the Maps Datasets API. In the next post, I'll cover the alternative: uploading datasets through the Google Cloud Console UI. Since most geospatial datasets change infrequently, the console is actually the more common route for data driven styling.
This article was written by Afi Labs, a Google Maps Premier Partner and reseller. We build route optimization, navigation, and fleet tracking software on Google Maps, and offer volume pricing on GMP licensing. Talk to an engineer or follow Afian on LinkedIn.
Next: Part 7: Add data to Google Maps with data driven styling